

1 Introduction
In most mammals, the embryo reaches the blastocyst stage around one week post fertilization. Soon after that stage, the embryo rapidly implants in the uterus; this is the case in rodents and in primates. This pattern of development is not the rule, however, in all mammals. In ungulates such as ruminants and the pig, the spherical blastocyst undergoes a tremendous phase of growth and elongation before the implantation which begins around 2–3 weeks after fertilization in that species. The elongation process of the trophoblastic vesicle is characterized by morphological changes in the shape and size of the spherical blastocyst so that 4 main shapes have been initially described: expanded spherical (S; 1 mm diameter), ovoid (O; 1–2 mm), tubular (T; 3–5 mm long) and filamentous (F; from 1 to 30 cm long) (Fig. 1) [1]. At the end of the elongation period which lasts about 4–5 days in cattle and 3–4 days in sheep, the long filamentous conceptus is immobilized close to the implantation sites and occupies the whole length of the uterine horns. This rapid growth of the conceptus is controlled by the uterine environment in vivo [2] but has not been reproduced in vitro. The cellular mechanisms which drive the elongation process are unknown at the present time. While elongating, the whole conceptus differentiates so that both embryonic and extra-embryonic tissues undergo specific differentiations in a highly coordinated manner. Nevertheless, the ablation of the embryonic tissues at the tubular stage does not prevent in utero elongation from occurring, thus evidencing no-dependency on the embryonic tissues at that stage [3].
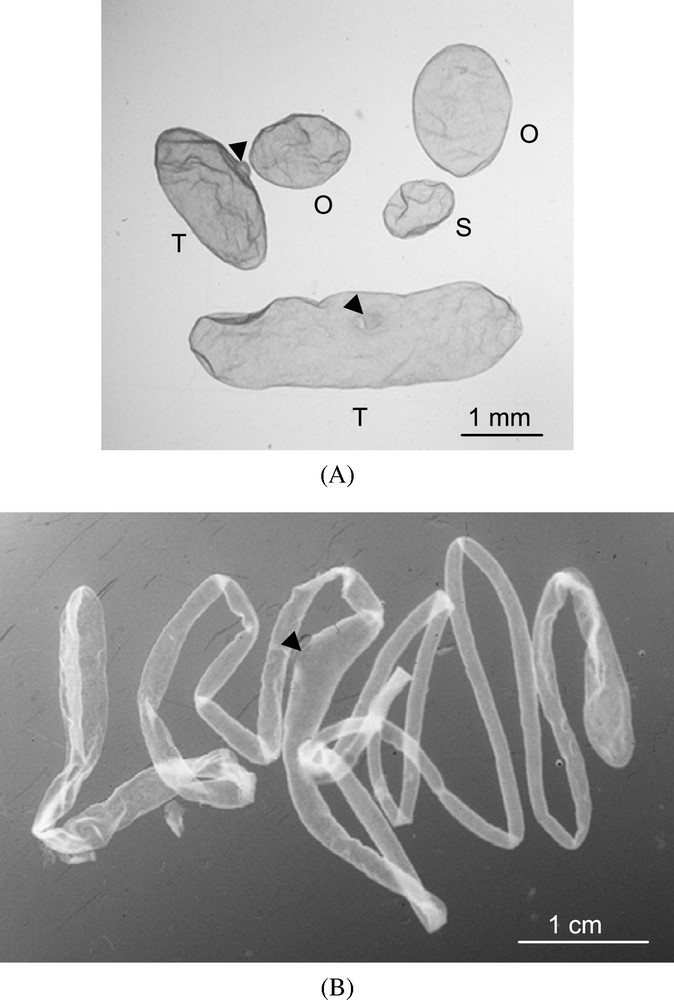
Ovine conceptuses at different stages of elongation. (A) expanded spherical (S), ovoid (O), tubular (T) and (B) filamentous. Arrows point the embryonic discs.
Image analysis and mathematical tools have been used extensively to study tissue growth and spatial organization in developmental models such as D. melanogaster and C. elegans embryos, wild-type or mutants, and these studies showed that cell shape modification, cell intercalation or cell rearrangements drive epithelial morphogenesis and impact on the body shape of the embryos [4–6]. In view of these data we have undertaken a basic analysis of the elongation process in ruminants, asking whether this genesis of shapes lays on modifications of the cell size, cell shape and/or cell orientation within the external epidermal layer of the conceptus. With that aim, we questioned the cell morphologies of this extra-embryonic tissue, also called extra-embryonic ectoderm or trophoblastic epithelium, at the different stages of elongation in ovine conceptuses.
Using actin labeling and 2D confocal imaging on fixed samples, we developed computational tools to address efficiently the questions raised from describing and understanding cellular reorganization in large tissues. Firstly, a set of mathematical and statistical indicators were introduced to measure the cellular geometry and morphology. Those indicators included the area, perimeter, major and minor axes, orientation, elongatedness index and the nearest neighborhood of each cell. Secondly, statistical analyses were applied to extract relevant features from the data and generate a global view of individual cell's behaviors. The mechanisms underlying tissue growth and embryonic development, however, may correspond to complex processes which, as a whole, exhibit properties that are not obvious from the properties of its individual parts. Such emerging behaviors could not be understood by only studying the behaviors of individualized cells or their very local environments. We needed therefore basic tools to describe the collective behaviors of the epithelial cell population. For example, in the mammary gland, the hypothesis of the existence of a special cell cluster around mammary stem cells had never been validated from the point of view of the quantitative and spatial analysis because of the lack of appropriate tools [7,8]. This had motivated Fernandez-Gonzalez et al. [9] to: (i) introduce the concept of K-nearest neighborhood graph as a mean to establish spatial linking between cells in an image; and (ii) use tools from classical spatial statistics to detect the existence of spatial patterns in a cell population. Inspired by the ideas raised in the above mentioned work, we explored tools from spatial statistics for assessing long range and multi-scale organization structures of the trophoblastic epithelium and its spatial–temporal dynamics along the different stages of elongation. These tools enabled us to envisage trophoblastic cellular behavior from an innovative point of view.
2 Methods
2.1 Tissue treatment and image acquisition
Estrus-synchronized ewes were sacrificed from days 11 to 14 post-coitum (p.c.) to collect embryos by uterine flushing. The conceptuses were staged in 4 classes according to their morphology: spherical (S), ovoid (O), tubular (T) and filamentous (F). Shortly after the collect, the embryos were fixed in 4% paraformaldehyde for 4 h, rinsed and stored in 0.1 M phosphate buffer at 4 °C until use. Spherical and ovoid conceptuses were used as a whole whereas pieces of tubular and filamentous conceptuses were cut along the axis of elongation. In each conceptus, 3 to 4 areas were located at various distances from the embryonic disc (Fig. 2). Whole mount fluorescence staining for F-Actin was performed as published previously [1]. Briefly, the tissues were permeabilized in 0.5% Triton X-100, rinsed in phosphate buffer and incubated with rhodamine-phalloidin (Molecular Probes, Eugene OR, USA) for 1 h at room temperature in dark. After washing, the cell nuclei were counterstained using DNA labeling by YO-PRO1 (Y3603; Molecular Probes, Eugene OR, USA). The samples were mounted with a drop of anti-fading agent onto a slide and covered with a glass coverslip. The preparations were observed with a laser confocal microscope (LSM5, Zeiss, Germany). Sample areas were scanned by sequences of 20–30 optical sections with 1 μm intervals.
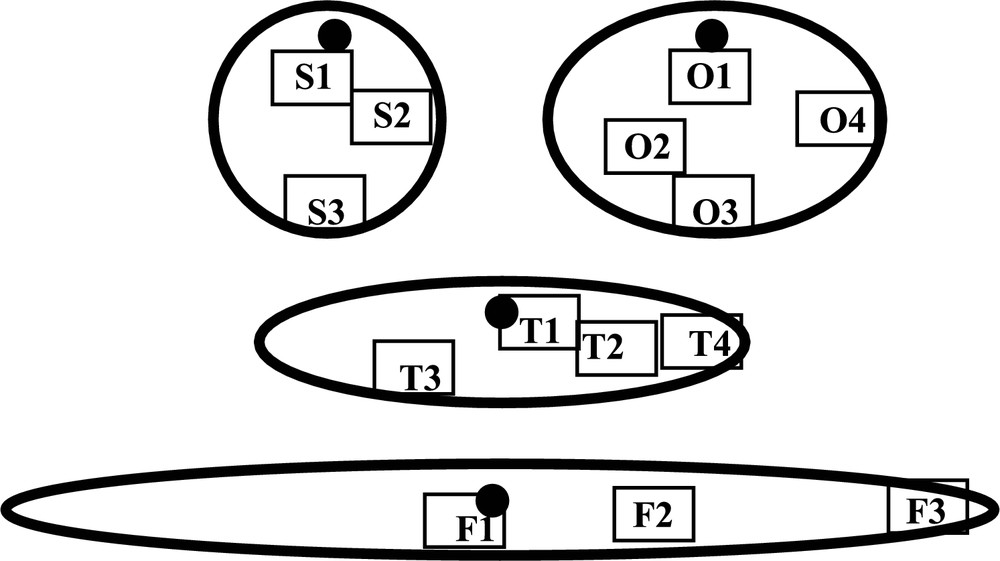
Sampling positions used to analyze the cellular organization of the trophoblast in Spherical (S), Ovoid (O), Tubular (T) and Filamentous (F) conceptuses. Each area (black rectangle) is oriented with respect to the embryonic disc (black spot).
2.2 Image analysis
Based on the variational principle, we developed a hybrid framework with quality control for cell segmentation from confocal microscopy. The nuclei were modeled as blobs with additive noise, and a filter derived from the Laplacian of a Gaussian kernel was applied to detect such blobs [10]. Image segmentation was formulated with front propagation using level-set approach, and energy optimization was obtained near the boundaries of the nuclei with the Fast-Marching algorithm [11]. A user-friendly interface was provided that allows a user to manually fine-tune the results. Details for technical considerations of the image analysis were given in [12].
2.3 Geometrical cell parameters
Cell size
Cell size was estimated by calculating the cell surface. The cell surface was estimated by counting the number of pixels contained in each cell and then rescaling the obtained number with the factor () representing the physical resolution of the microscope used in our study. The data were expressed in μm2.
Cell shape
To analyze the cell shape, three parameters were considered: the major and minor axes, the elongatedness index.
Major and minor axes
If we regard the cell as an ellipse, its major and minor axes are defined as the diameters of the ellipse. The major axis is the longest diameter and the minor axis the shortest. Each axis is the perpendicular bisector of the other. If the major and minor axes are equal in length, then the ellipse becomes a circle. On the other hand, if the minor axis has a length equal to 0, the ellipse becomes a segment. We can therefore use these two parameters to define the elongation of a cell.
These two measures are estimated by standard moment computing. The major axis length corresponds to the length of the major axis of the ellipse that has the same normalized second central moment as the cell region, and the minor axis length corresponds to the minor axis of the ellipse that has the same normalized second central moment as the cell region. Assume that with are the pixels included in a cell region and are the barycenter coordinates of this region. We can calculate the central moments of as following:
2.3.1 Elongatedness index
Once the ellipse representing the cell is reconstructed according to the method introduced in the precedent section, we can calculate the lengthening of a shape. It corresponds to the ratio of the between-foci distance and the length of the major axis. The result is between 0 and 1. The value 0 corresponds to a circle and the value 1 corresponds to a segment. Thus, that value allows us to evaluate the degree of elongation of a shape.
2.4 Neighborhood
This measure represents the number of neighboring cells that a cell disposes. One cell A is considered in contact with another cell B if at least one pixel in the image of cell A is in the 8-connecting neighborhood (top, bottom, left, right, top-left, top-right, bottom-left, bottom-right) of any pixel in the image of the cell B.
2.5 Orientation of the cells
This parameter indicates the main orientation of the cells with respect to the elongation of the conceptus. The cell orientation was given by the value of the angle formed between the major axis of the cell (see above) and a reference axis (0°). In spherical and ovoid conceptuses, we had no information about the orientation of the sample related to the whole conceptus, thus the reference axis was defined arbitrarily as the x axis of the image. In tubular and filamentous conceptuses the elongation axis of the conceptus was taken as the reference axis.
2.6 Statistical analyses
The statistical indicators include the mean, median, percentile and standard deviation of each mathematical indicator defined previously. ANOVA with one factor (sampling positions or stages of development) was applied to know if a series of samples have the same mean values and variances, and pair-wise comparisons among samples were fulfilled with Tukey's HSD (Honestly Significant Differences) test.
2.7 Quantitative assessments of cellular spatial organization
We explored tools from spatial statistics for assessing long range and multi-scale organization structures underlying among different cell populations and their evolution along different stages of development of the conceptuses.
Single population dynamics
We first estimated the center of cells with the moment analysis introduced in the previous section and considered them as spatially distributed points. Then we studied the spatial points with a generalized form of the Ripley's K function to detect spatial clustering or dispersal of the points (cells). Given a set of points in the space, Ripley's K function (Fig. 3) gives estimation about how many points can lie within a circular neighborhood of radius r around a location in the considered space, and this for all locations and all size of circular neighborhood. Its mathematical definition is given as follows:

Ripley's K function. This function was used to detect spatial clustering or dispersing of points by comparing the observed data with an expected K function for a Poisson's process (illustrated by the central line x = y in the figure). (A) A spatial organization where points are clustered at a small scale and regularly dispersed at a large scale. (B) The plot of a transformation of the Ripley's K function calculated from data illustrated in (A).
By using a circular neighborhood, Ripley's K function is based on an isotropic cumulative count of all points at distances from 0 to r. The statistical mean of this count is equal to under a completely random Poisson process, which is usually considered the reference distribution to assess the spatial organization of points at different scaling levels.
To linearize and stabilize the variance, a transformed graphics of K function is commonly used with:
Interaction between different cells populations
The Ripley's K function presented in the above section assesses spatial patterns for a single population. To deepen our insight into the cellular organization at the tissue level, we were trying to separate the trophoblastic cells into sub-populations and understand their interactions. We considered the cells with higher number of neighbors to be a sub-population and questioned how those cells are placed inside the tissue and how they are organized regarding to other types of cells. This was carried out with a function called , derived as follows: the extension of Ripley's K function into two populations A and B gives the cross K function which counts the expected number of members of sub-population B within a given distance of any arbitrary member of sub-population A, and defined as follows.
2.8 Assessment of spatial and temporal dynamics of cellular organization
To survey the changes of the cellular organization along different sampling positions, we first calculated the function from samples obtained at different positions inside a stage of development (S, O, T, F), and then we visually compared the evolution of the function by plotting the corresponding curves together. Gaps between two successive curves measure the intensity of the structural change from a sampling position to another. In case that the cellular organization has changed, the variation can be easily highlighted. The same procedure was applied to make assessment of the temporal dynamics of cellular organization and their spatial interactions. The indicators were calculated and compared for data obtained from different developmental stages.
2.9 Spatial and temporal dynamics of the interaction among different cells populations
Again, different cellular populations were formed and their functions were plotted together and compared as well at different sampling positions and along different stages of development.
3 Results
Microfilaments of F-Actin were distributed equally in all trophoblastic cells whatever the stages of conceptus development. Staining was diffuse in the apical cytoplasm of the cells (not shown) whereas 5–6 μm deeper within the cells, F-Actin lined only the lateral cellular membranes (Fig. 4). This optical section depth was used to analyze the various parameters studied in the present work.

Confocal optical section of the trophectoderm layer of a filamentous (c) conceptus after staining of F-Actin with rhodamin-phalloidin (red) and nuclear labelling with YOPRO-1 (green). Arrowheads point on cells in mitosis. Scale bar: 50 μm.
3.1 Cell morphology at various stages of elongation
Cell size
To determine the trophoblastic cell sizes at different stages of elongation and within different areas of the conceptuses, the cell surface was calculated. During the elongation process, the mean cell surface increased significantly from the spherical to the tubular stages (134.8 μm2 vs. 175.7 μm2, respectively; ). No significant changes of the mean cell surface were observed between the tubular and filamentous stages (175.4 μm2 vs. 171.4 μm2, respectively; ). At each elongation stage, the cell surfaces were significantly greater in areas close to the embryonic disc when compared to the distal parts (Fig. 5). In these areas, most cells (90%) displayed a cell surface comprised between 100 to 250 μm2 and the higher cell surface (400 μm2) was observed in the filamentous conceptus. A large variability of the cell surface values was noticed, however, among the same sample area.

Surface values (μm2) of the trophoblast cells along sampling positions in Spherical (S1–S3); Ovoid (O1–O4); Tubular (T1–T4) and Filamentous (F1–F3) conceptuses. The middle bars correspond to the mean values. The crosses mark the median values. The boxes correspond to the values associated with the cell population lying between the fifth and the ninety-fifth percentiles. Non-significant differences among samples are indicated by letters (a)–(e).
Cell shape and topology
To estimate the trophoblastic cell shape in the ovine conceptuses during elongation we measured the major and minor axes, the elongatedness index of the cells and determined the individual cellular neighborhood. Data on the cell shape parameters at the different stages of elongation are summarized in Table 1. From the spherical to the filamentous stages the minor and major axes of the cell increased significantly from 11.81 to 13.31 μm and from 14.9 to 16.61 μm, respectively. The highest increase (2.4 μm) of the major cell axis was observed from the spherical to the tubular stages. The mean elongatedness index remained unchanged from the spherical to the filamentous stages (0.57 vs. 0.56, respectively). Each individual cell maintained a roughly polygonal shape with a mean of 5.6 neighbors. Thus no cell stretching has occurred during the elongation process of the conceptuses. In spherical, ovoid and filamentous conceptuses, the mean lengths of the major and minor axes of the cell were significantly higher in trophoblast areas close to the embryonic disc (Table 2). No significant changes between the different areas could be noticed for the elongatedness index or the neighbor cells (Table 2).
Parameters of the trophoblastic cell shape in elongating conceptuses. Values are expressed as mean ± s.d.
| Conceptus stages | Minor axis (μm) | Major axis (μm) | Elongatedness index | Neighbor cells (mean number) |
| Spherical (n = 1741) | 11.81 ± 1.73 | 14.80 ± 2.34 | 0.57 ± 0.14 | 5.57 ± 1.15 |
| Ovoid (n = 2031) | 12.76 ± 1.77 | 16.08 ± 2.32 | 0.57 ± 0.14 | 5.68 ± 1.18 |
| Tubular (n = 2001) | 13.26 ± 2.09 | 17.24 ± 3.04 | 0.60 ± 0.14 | 5.67 ± 1.18 |
| Filamentous (n = 1317) | 13.31 ± 2.16 | 16.61 ± 2.89 | 0.56 ± 0.13 | 5.62 ± 1.17 |
Parameters of the trophoblastic cell shape in different areas of the elongating conceptuses. Values are expressed as mean ± s.d.
| Conceptus areas | Minor axis (μm) | Major axis (μm) | Elongatedness index | Neighbor cells ( n ) |
| Spherical stage | ||||
| S1 (n = 402) | 12.77 ± 1.78 | 15.95 ± 2.24 | 0.57 ± 1.40 | 5.64 ± 1.16 |
| S2 (n = 643) | 11.91 ± 1.72 | 14.79 ± 2.32 | 0.56 ± 0.13 | 5.72 ± 1.12 |
| S3 (n = 698) | 11.17 ± 1.41 | 14.13 ± 2.16 | 0.58 ± 0.13 | 5.41 ± 1.15 |
| Ovoid stage | ||||
| O1 (n = 270) | 13.33 ± 1.55 | 16.67 ± 2.00 | 0.57 ± 0.14 | 5.53 ± 1.26 |
| O2 (n = 525) | 13.54 ± 1.53 | 16.71 ± 1.87 | 0.55 ± 0.14 | 5.67 ± 1.15 |
| O3 (n = 605) | 12.55 ± 1.65 | 15.59 ± 2.06 | 0.56 ± 0.13 | 5.72 ± 1.14 |
| O4 (n = 631) | 12.05 ± 1.83 | 15.75 ± 2.79 | 0.61 ± 0.14 | 5.72 ± 1.19 |
| Tubular stage | ||||
| T1 (n = 535) | 13.05 ± 2.04 | 17.06 ± 3.17 | 0.61 ± 0.14 | 5.71 ± 1.17 |
| T2 (n = 574) | 12.50 ± 2.15 | 16.54 ± 3.35 | 0.62 ± 0.14 | 5.72 ± 1.22 |
| T3 (n = 416) | 14.79 ± 1.74 | 19.17 ± 2.16 | 0.60 ± 0.15 | 5.59 ± 1.20 |
| T4 (n = 476) | 13.09 ± 1.65 | 16.60 ± 2.39 | 0.58 ± 0.13 | 5.68 ± 1.15 |
| Filamentous stage | ||||
| F1 (n = 365) | 15.72 ± 2.05 | 20.06 ± 2.84 | 0.59 ± 0.14 | 5.58 ± 1.24 |
| F2 (n = 636) | 12.45 ± 1.34 | 15.30 ± 1.52 | 0.56 ± 0.13 | 5.73 ± 1.08 |
| F3 (n = 316) | 12.27 ± 1.41 | 15.34 ± 2.04 | 0.57 ± 0.14 | 5.47 ± 1.25 |
Cell orientation
To test if the trophoblastic cells oriented randomly or paralleled the elongation axis of the conceptus we have measured the angle between the major axis of the cells and an arbitrary horizontal axis of the image for spherical and ovoid conceptuses, or the elongation axis for tubular and filamentous ones. The cells were oriented equally in all directions around the reference axes whatever the stages of development but also within the different parts of the conceptuses at a given stage (Fig. 6). Thus, the distribution of the cells according to angular values is uniform with respect to the elongation axis of the conceptus.
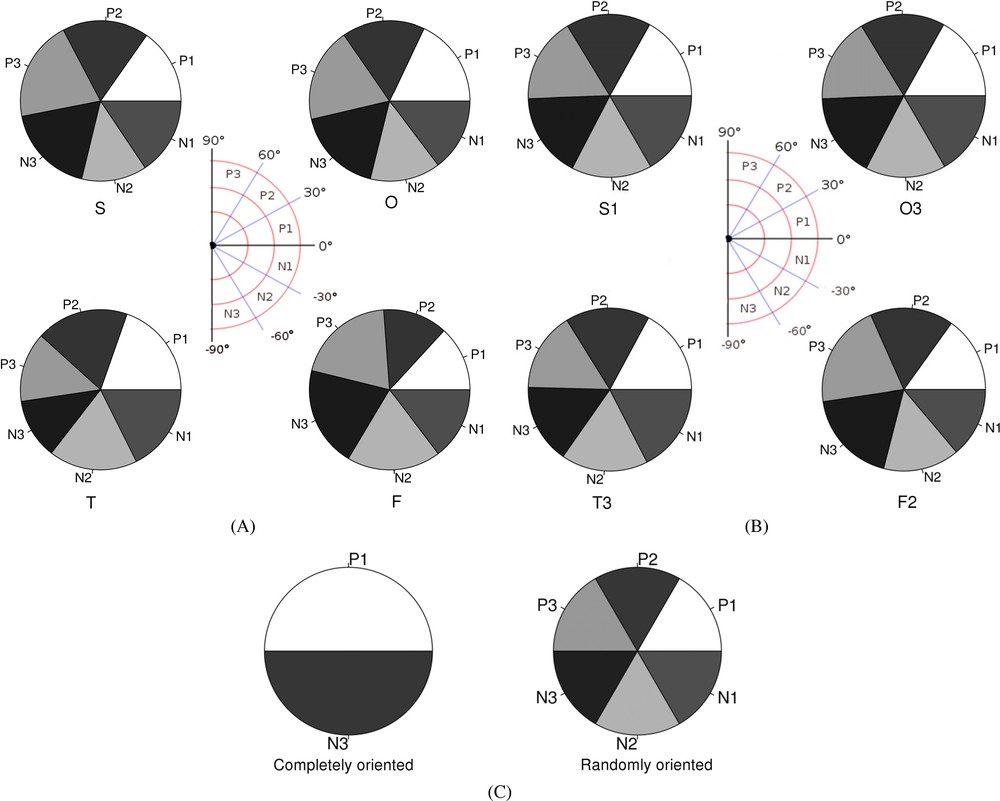
(A) Trophoblastic cell distribution with respect to the angular values of their major axis with the horizontal axes of the images from spherical (S) and ovoid (O) conceptuses or with the elongation axes of tubular (T) and filamentous (F) conceptuses, taken as reference axes (O°). (B) Since no significant differences were observed between the different areas of the conceptuses, only one representative area for each Spherical (S3), Ovoid (O3), Tubular (T3) and Filamentous (F2) conceptuses are represented. (C) Theoretical distribution of the cells specifically (1) or randomly (2) orientated along the elongation axis taken as the reference axis (O°).
3.2 Multiple scales analysis of cellular organization
The function was calculated for samples from different stages of development with the package of spatial analysis developed in [13]. As shown in Fig. 7A, the patterns did not appear to be significantly different from a Poisson's process, except for some very small scales which correspond to the small cells since the mean values of the length of the major and minor axes of the cells were 17 and 13 μm, respectively. Thus, we should exclude these small scales from the spatial statistical analysis. Indeed, data from trophoblastic tissue were not dropped from a real point process on the means that each point is a mathematical concept without additional features. Points in our study are cells. These cells have geometry and topology. They are shaped and oriented. Neighboring cells are connected with no gaps. Spatial analysis is based on distance separating neighboring points, and it gives sense only above the scales corresponding to the minimum size of a cell. In this scope, the Poisson's randomness hypothesis should not be understood as a completely random spatial distribution. It means that cells in the trophoblast is neither arranged regularly, nor organized into clusters.
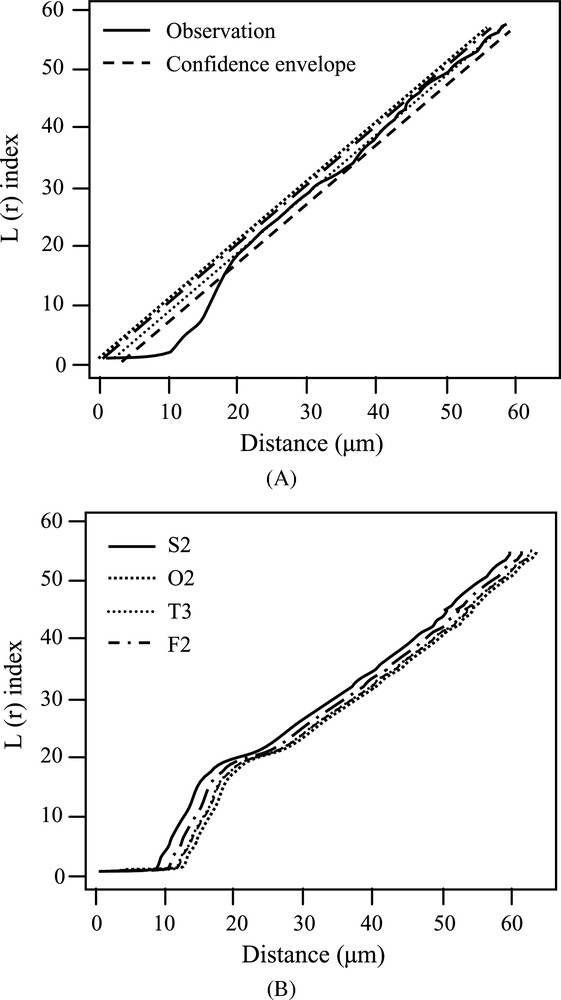
Analyses of cellular spatial organization with the function L(r). (A) L(r) index calculated from a representative sample (O2). The central line corresponds to the expected L(r) curve for Poisson's process (H0), and the envelope corresponds to the lower and upper bounds of 95% confidence interval generated with Monte-Carlo simulation under the hypothesis H0. (B) Comparison of the temporal dynamics of the L(r) index for a set of samples (S2, O2, T3, F2) in the middle area of the conceptuses along different stages of development: Spherical (S), Ovoid (O), Tubular (T) and Filamentous (F). Data for others samples were not shown because of their similitude.
3.3 Spatial and temporal dynamics of trophoblast cellular organization
To evaluate the structural changes of cellular organization at space and at time, we plotted together the curves from samples obtained at different positions (Fig. 7B) and along different stages (data not shown since they have very similar features as in Fig. 7B). We noticed that there were no significant changes among the different sampling positions. This suggests that the organizational structure remains stable along with the different developmental stages of the trophoblast tissue, and there are no structural breaks in the cellular organization. In conjunction with the results obtained from the geometrical and morphological analyses of the trophoblast cell, our analyses suggest that the trophoblast elongation observed at the tissue level was not due to geometrical change of cell shape, as also observed during elongation of Drosophila embryos [14], but should be the consequence of a cell addition process which might itself be spatio-temporally controlled.
3.4 Spatial interaction among cell populations and its dynamics in space and time
To get insight into the structural interaction between different cell populations, cell sub-populations were formed according to the number of the nearest neighbors of its member. Cells with a larger number of neighbors (⩾8) were brought together to form a sub-population, and the spatial organization of this sub-population regarding to other cells was investigated. The principal reason to treat the cells with large neighbor numbers as a particular population is because we noticed that this kind of cells often corresponded to cells in metaphase. Studying the behaviors of this population may help us to better understand the mechanism controlling the cell division which, as we understood from the results of our analyses, should encompass key elements of the trophoblast tissue elongation. The study was achieved with the function with confidence interval equal to 0.95 (Fig. 8A). We observed that the proportion of cells having more than 8 neighbors is relatively small for every sample (between 1% and 5.2%) and these cells were scattered everywhere among other cells. No clustering effect has been observed between these two populations either in the zone near the embryonic disc or at the tips of the conceptus. To investigate the dynamic interactive behavior of cellular organization over space and time, we plotted together the curves calculated from the tissues sampled at different positions and along different stages of development (Fig. 8B). Once again, no structural breaks of cellular organization were observed along the elongation process (from spherical stage to filamentous stage).

Analyses of the spatial interaction among two sub-populations of the cells. (A) The LC(r) index of a representative sample (O2). The central line corresponds to the expected LC(r) curve for Poisson's process (H0), and the envelope corresponds to the lower and upper bounds of 95% confidence interval generated with Monte-Carlo simulation under the hypothesis H0. (B) Comparison of the spatial dynamics of the LC(r) index for a set of samples (F1, F2, F3) got at different areas of filamentous conceptuses. Data for others samples were not shown because of their similitude.
4 Discussion
Our goal in this study was to investigate the elongation process in ruminants, asking whether this process was associated with modifications of the cell size, cell shape and/or cell orientation within the external epithelial layer of the conceptus (trophoblast). To do so, we first developed a computational approach for systematic large tissue imaging and multi-scale analysis of trophoblastic cellular organization at tissue level. Rather than a standalone application, the proposed framework was built from a series of modules available on open-source public platforms [15–18]. First, image segmentation was formulated according to the variational principle and provided with an interactive correction module. The developed method sounded technically robust, and took benefits from both the efficiency of automatic segmentation procedure and the accuracy of manual intervention of the biologist. However, processing the images in 2D raised difficulties for highly deformable tissue such as those we observed in this study, especially for the membrane segmentation. Since F-Actin was not underlining the whole cell membrane, the apex of the cells was often unlabeled. This leaded to breaks in the images where no knowledge about cell shape and boundaries was available. To cope with these difficulties, complementary information could have been collected with different technologies such as exploration of the data in the 3D space or even better in the 4D space (3D + time). Since this was uneasy to achieve with ovine embryos, we estimated the missing boundaries of the cells by interpolating data provided through neighboring sections of the tissue. To measure the cellular geometry and neighborhood linking in the trophoblastic epithelium, we defined and calculated a set of mathematical descriptors. The results highlighted the spatial organization of these cells during the trophoblast elongation and pushed us forward understanding this process at scales beyond the immediate neighborhood of a cell by using a transformation of Ripley's K function. To explore structural changes of cellular organization at space and time, we plotted together all the curves obtained from each sample at different positions and stages and revealed the stability of the cellular structure in the trophoblast tissue. Since the trophoblast elongation observed at the tissue level was not due to geometrical changes of cell shape, the use of spatial analyses made sense to study structural organization and interaction within this population. However, exploratory spatial analyses cannot uncover the processes that lead to such structures. Further studies would thus be needed to explore parametric modeling such as the Gibbs process to extrapolate on the estimated cellular organization process at the positions where sampling is not accessible. This could indeed play a fundamental role in elucidating the mechanism underlying trophoblast elongation, and serve as a basis for the biophysical modeling of the conceptus morphogenesis. At last, an extension of the function to marked spatial process was used to analyze the interaction between different cell populations: the cells with 5–7 neighbors (>95% of the trophoblast cells) and those with 8–9 neighbors (<5%). However, small sized populations lead to statistical difficulties, including the robustness of the analysis and the relevance of the confidence interval generated with Monte-Carlo simulation.
Using these tools, the only changes we detected were a slight increase of the surface and major axes of the cells during the elongation of the conceptuses. That enlargement of the cells (1–2 μm in length) however is not sufficient to explain the rapid growth of the conceptuses which are 10–15 cm long at the end of the process in sheep. The data presented in this study showed that whatever the stages of development or the position within the conceptus the trophoblastic cells retained a polygonal shape and showed no signs of stretching in relation with the elongation process. Moreover, no defined orientation of the cells could be demonstrated in relation with the elongation axis of the conceptuses. Finally, at any stage we could not detect clusters of cells with specific features associated with elongation of the trophoblastic vesicles. All together these results suggest that other mechanisms than morphological changes of the trophoblastic cells should drive the transition from a spherical to a filamentous conceptus in ruminants. It has been suggested that the three-dimensional structure of the uterus exerts a mechanical constraint and orients the elongation process. Attempts to obtain elongated conceptuses after in vitro culture in agar tunnels have been reported but uncompleted elongation of the blastocyst was observed [19]. It should be pointed out that in ungulates, the elongation process is observed in ruminants and pig, only. In other species with elongated uterine horns, such as the horse, in which the conceptus presents a pre-implantation tremendous growth of the trophoblastic vesicle too, there is no elongation. This indicated that more complex mechanisms than the mechanical pressure of the uterus might be responsible of that characteristic elongation of the ruminant conceptuses. On its inner face, the trophoblast layer rests and is in close contact with the parietal endoderm layer. In sheep, the parietal endoderm cells elongated parallel to the elongation axis of the conceptus [1] and similar observations have been made in the cow (personal data). Thus, the elongating parietal endoderm cells might exert a mechanical tension onto the proliferating trophoblast and drive it along the elongation axis. As recently illustrated by Rauzi et al. [20] for the elongation of Drosophila embryos, “estimating cortical tension in vivo raises now the possibility to test how external and internal forces cooperate to drive the variety of forms observed during tissues morphogenesis”. In our model, one may need to estimate such mechanical forces within the trophoblastic epithelium as well as between the internal and external epithelial layers of the conceptus, endoderm and trophoblast.
Elongation of other embryonic tissues in vertebrates and invertebrates have been described and associated with cell intercalation in mesenchymal or epithelial tissues, that is to say, with cells exchanging their neighbors [21]. For example, cell intercalation has been reported during the anteroposterior elongation of the early drosophila embryo or germ-band elongation [22,23]. During this process, the length of the AP axis of the embryo is doubled and time-lapse recording of cell junctions within this epithelium indicated that cells remodeled specific contacts with their neighbors according to an ordered spatio-temporal pattern, which may have included rosette formation and resolution [6]. In the present study, we did not detect any cluster of cells with specific features such as those described for these rosettes, may be due to the observations we made in 2D, on fixed tissues and at sequential stages. Since morphogenesis is a dynamic process, time-lapse analyses will likely be required to get such an accurate picture of the trophoblast tissue during conceptus elongation in ruminants. Interestingly, Drosophila germ band extension resulted in a 2 fold elongation of the anteroposterior axis, while ovine conceptuses elongate from 1 mm to 15 cm (about 150 fold). As simulated by Honda et al. [24], cell intercalation mechanism would result in a small increase in length whereas another mechanism, called cell shuffling by oriented cell extension, would virtually result in no elongation limit. Whether this model suits better the internal epithelium of the ovine conceptuses, namely the parietal endoderm in which the cells elongate parallel to the elongation axis of the conceptus [1], awaits further study.
Last, but not least, the redistribution of neighbors after cell division seem to depend on how fast a tissue proliferates, as recently reported for the Drosophila wing epithelium [25]. Similarly, new studies on the germ-band extension in Drosophila embryos revealed that posterior to the region previously analyzed, another region displayed cell divisions mostly oriented longitudinally to the elongation axis of the embryo [26]. In this study, we primarily looked at the number of neighbors which appeared mostly 5 to 7 with a very small proportion of cells with 8 to 9 neighbors (5% of the sampling areas we looked at) but could not follow their redistribution over time. We thus do not know how these neighbors integrate the pre-existing honeycomb pattern of the trophoblastic epithelium. In this study, cell division has not been investigated either though cell proliferation appears theoretically decisive for the ovine conceptus in order to reach within 3 to 5 days an elongation rate of 150 or, as in cow, a 300 fold rate (from 1 mm to 30 cm). In the future, considering dividing and non-dividing cells with the help of spatial statistics may help us understanding: (i) how these two cell populations interact and organize to sustain trophoblast growth; and (ii) how this epithelial growth contributes to the elongation of the whole conceptus.
Acknowledgements
We thank the staff of the INRA-UCEA unit for providing us with ovine embryos, in particular Cedric Rougheol, and the staff of the MIMA2 platform for confocal microscopy (INRA-Jouy en Josas). We are grateful to Pierre Adenot for his help in image acquisition as well as constructive comments for image processing and to Guan Xue for his contribution to the image analysis software. We also acknowledge Alain Trubuil and Jean-Paul Renard for their constructive instructions and continuous support of the project. This work was supported by a grant from INRA (AgroBI) to Isabelle Hue and Juhui Wang.