

 CC-BY 4.0
1. Introduction
The dramatic rise in demand for freshwater worldwide, due to continued population growth has been posing challenges in the last few decades through increased water stress, both in terms of water scarcity and quality deterioration [1]. On earth, the main sources of drinking water are groundwater and surface water. Industrial, domestic, agricultural activities, and in particular pharmaceutically active compounds (PhACs), increasingly contaminate water in large amounts every year. The conventional biological treatment processes do not tend to reject such organic molecules [2].
In the last few years, nanofiltration and reverse osmosis (NF/RO) membranes have been the object of several studies [3], as an alternative to conventional treatment processes since they are energy-efficient and environment-friendly. Furthermore, many research works based on the use of NF/RO have demonstrated that they are efficient for the rejection of a wide variety of organic molecules from water, such as pesticides [4, 5], dyes [6, 7], antibiotics [8, 9], a natural hormone and endocrine disruptor [10, 11] and PhACs [2, 12].
The literature highlights several points. Firstly, many transfer models exist (irreversible thermodynamics, solubilization–diffusion, or pore flow), but they do not always describe or explain the process correctly and the results obtained in the case of the transfer of organic compounds require significant modifications. The behavior of the NF/RO process for complex solutions is more difficult to describe and predict, due to the large number of mechanisms involved. On the other hand, many interactions can be established between solutes, water, and the membrane (steric dimensions, electrostatic repulsion, hydrophobic/adsorption, and dielectric exclusion) [13, 14].
To overcome these problems, attempts have been made to propose modeling approaches, making it possible to decrease the number of experiments to be carried out to determine the optimal parameters (anti-inflammatory drugs properties, membrane properties, and operating conditions) for the treatment of industrial effluent. For these reasons, we must research new methods of calculation and modeling such as artificial neural network (ANN) and support vector machine (SVM) models. Firstly, the main advantage of ANNs is their ability to model processes without having in-depth knowledge of the phenomenology involved. Secondly, SVMs aim for regression and classification due to their excellent and robust generalization performance.
However, there have been few models of ANNs due to the complexity of mechanisms to predict the rejection of organic compounds by NF/RO [15, 16, 17, 18, 19, 20, 21, 22]. There is no modeling study for the rejection of organic compounds by NF/RO membranes using SVMs.
In this work, an attempt will be made to estimate the rejection of anti-inflammatory drugs by NF/RO using two artificial intelligence approaches (ANNs and SVM). A similar set of inputs is considered for the two approaches that include an effective diameter of the organic compound in water “dc”, logD, dipole moment, molecular length, molecular equivalent width, molecular weight cutoff, sodium chloride salt rejection, zeta potential, contact angle, pH, pressure, temperature, and recovery.
To the best of our knowledge, this will be the first attempt to model the anti-inflammatory drug rejection mechanisms by NF/RO using the SVM and ANN in order to assess their predictive capacities. The remainder of this study is structured as follows: Section 2 includes the machine learning techniques (ANNs and SVMs). Section 3 describes the modeling of the rejection of anti-inflammatory drug. Results and discussion are presented in Section 4. We will end with a conclusion that brings together the main results obtained in Section 5.
2. Artificial intelligence approach “ANN and SVM”
The sketch map of the support vector machine (SVM) model.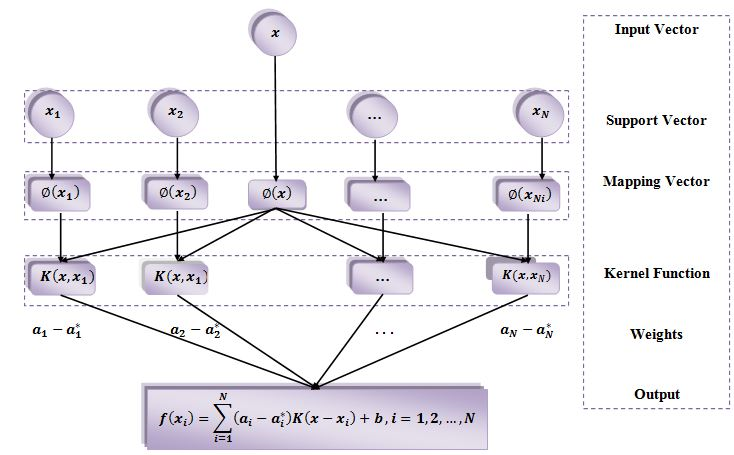
ANN is one of the most appropriate machine learning methods. It is inspired by natural neurons; ANNs are a mesh of several formal connected neurons that relate the inputs to the desired outputs. ANNs consist of both input and output layers and can have a hidden layer (in many cases) that contain units that convert the input into something, which could be used, by the output layer [23]. The input and output variables are weighted and shifted by a bias factor specific to each neuron [24].
In 1990 Vapnik–Chervonenkis developed an excellent methodology of SVM. This method is based on statistical learning theory (SLT), it implements structural risk minimization (SRM) theory. It is used for nonlinear classification and regression analysis [24]. The sketch map of the SVM model is shown in Figure 1. The nonlinear relationship between inputs and outputs in the SVM model can be employed by the regression function.
The outputs of the SVM model are obtained by the following equation [25]:
| (1) |
The database has a D-dimensional input vector xi ∈ RD and a scalar output yi ∈ R.
The SVM optimization model is given by the following equations (for the training database):
| (2) |
Flow diagram for the artificial neural network (ANN) and support vector machine (SVM) development.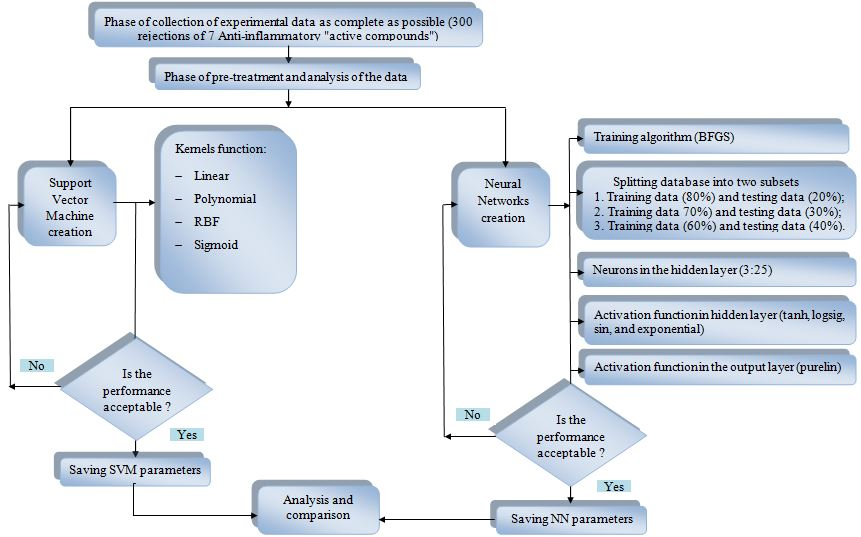
As a standard nonlinear constrained optimization problem, the above problem can be resolved by constructing the dual optimization problem based on the Lagrange multipliers techniques:
| (3) |
: the kernel function satisfying the Mercer’s condition; ai and : the non-negative Lagrange multipliers, respectively.
| (4) |
3. Modeling the rejection of anti- inflammatory drugs
Effect of the division of database: (a) mean squared error “MSE” and (b) coefficient of correlation “”.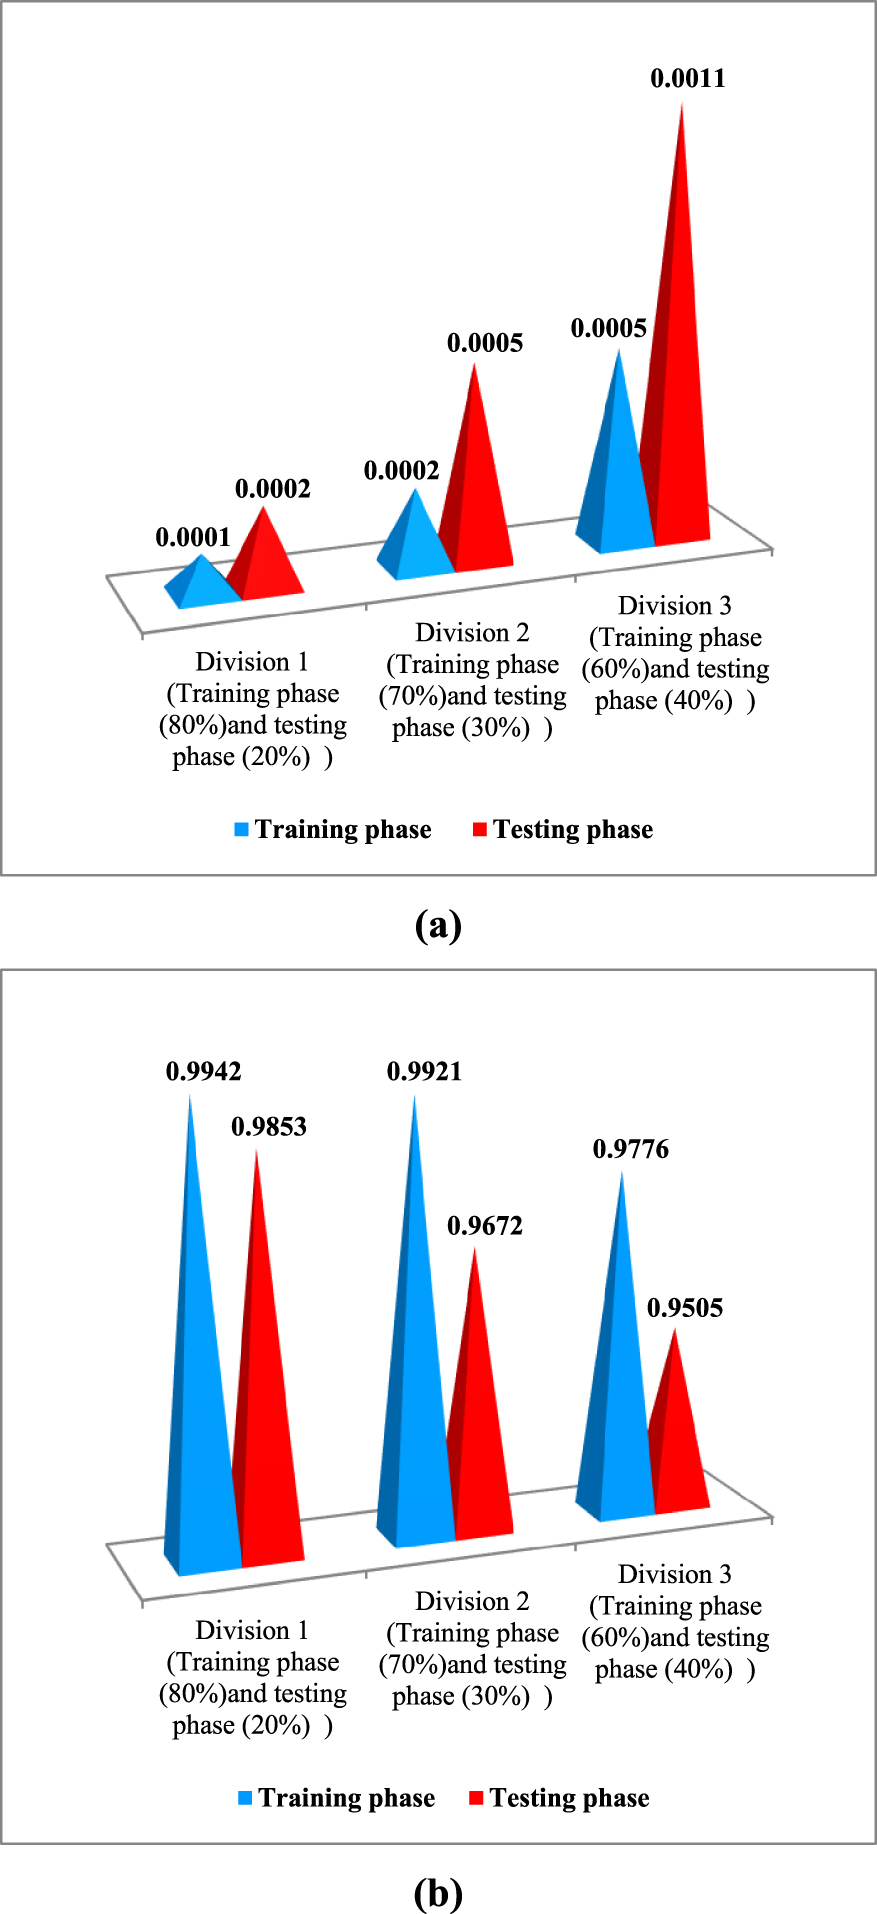
The data sample with 300 rejections of 7 anti-inflammatory drugs used in this study is available in the literature [16, 26, 27, 28, 29, 30, 31, 32, 33, 34, 35, 36, 37, 38] (Supplementary data A). The list of anti-inflammatory drugs, molecular formula, molecular weight, and structure is presented in Supplementary data B (Table B.1).
The choice of input and output variables was based on the sieving effect, electrostatic interactions, and hydrophobic/adsorption interactions between solutes and NF/RO membranes. These solute–membrane interactions are determined by anti-inflammatory drugs properties, membrane characteristics, and filtration conditions. In this work, we have chosen the following inputs: anti-inflammatory drug properties (logD, dipole moment, the effective diameter of the organic compound in water “dc”, molecular length, and molecular equivalent width “eqwidth”); membrane characteristics (molecular weight cutoff “MWCO”, sodium chloride salt rejection “SR (NaCl)”, zeta potential, and contact angle); and filtration conditions (pH, pressure, temperature, and recovery).
The statistical analysis of the input and output data was done in terms of the minimum “min”, the average “mean”, the maximum “max”. The standard deviations “STDs” for training data, testing data, and overall data are mentioned in the Supplementary data B (Table B.2).
Schematic illustration of the optimized ANN model.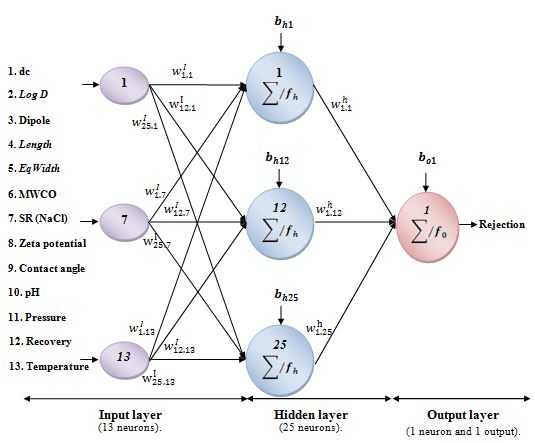
A procedure based on the development and optimization of the architecture of ANNs and SVM is described in Figure 2, in the design of three ANNs models and four SVM models. The ANN model was developed for the total database. The samples were randomly split into two subsets (training phase and testing phase). The training algorithm used in this work is the BFGS quasi-Newton (trainbfg). The ANN contains three layers: one input layer with thirteen neurons in the input layer, one hidden layer with several active neurons optimized during the training phase, and one output layer with one unit that generated the estimated value of rejection of anti-inflammatory drugs. The number of hidden neurons varied from 3 to 25 neurons. The tangent sigmoid (tansig), the log sigmoid (logsig), sin, and the exponential transfer functions were used in the hidden layer. The choice of the optimal number of hidden neuron of hidden functions, and a division of subsets (optimal architecture) for ANNs was performed by trial and error. The pure-linear (purelin) transfer function was used in the output layer. In order to develop four SVM models for the rejection of anti-inflammatory drugs by NF/RO, the SVM learning technique is employed. As mentioned previously in this article, the choice of the kernel functions is crucial for model performance. STATISTICA SVM supports a number of kernel functions for use in SVM models, these include linear, polynomial, radial basis function (RBF), and sigmoid. The function that gave the best results in terms of the absolute error mean (AEM) and correlation coefficient (R) is the kernel used in our SVM modeling. The creation of ANNs and SVM models of the rejection of anti-inflammatory drugs by NF/RO was performed using STATISTICA software by trial and error method.
4. Results and discussion
Figure 3 shows the error values (mean squared error “MSE” and coefficient of correlation “R”) obtained for the rejection of anti-inflammatory drugs under the influence of the division of the database for ANNs model with division 1 (240 points for training (80%), and 60 for testing phase (20%)), division 2 (210 points for training (70%), and 90 for testing (30%)), and division 3 (180 points for training (60%), and 120 for testing (40%)). This figure demonstrates that division 1 has lower MSE than division 2 and 3 (MSE = 0.0001 and MSE = 0.0002 for training and testing phase respectively). The coefficients of correlation of division 1 are generally considered to be more satisfactory than the divisions 2 and 3 (R = 0.9942 and R = 0.9853 for training and testing phase respectively). Therefore, it is clear that the first division represents the best result for modeling the rejection of anti-inflammatory drugs by NF/RO using the ANN model.
Hence, the structure of the ANNs for the modeling of the rejection of anti-inflammatory drugs by NF/RO is mentioned in Figure 4. Its more detailed architecture is illustrated in Table 1.
The weight and bias matrixes of the neural networks model are depicted in Supplementary data B (Table B.3).
wI: the input-hidden layer connection weight matrix (25 rows × 13 columns);
wh: the hidden-output layer connection weight matrix (25 rows × 1 column);
bh: the hidden neurons bias column vector (25 rows);
bo: the output neurons bias column vector (1 row).
From the optimized ANNs models shown in Figure 4, assimilation of the rejection of anti-inflammatory drugs by NF/RO can be depicted by a mathematical model incorporating all inputs Ei, it is given by the following equations:
The instance outputs Zj of the hidden layer:
| (5) |
The output “Rejection”
| (6) |
The combination of (5) and (6) leads to the following mathematical formula which describes the rejection of inflammatory drug by taking into account all inputs.
| (7) |
In order to assess the predictive ability of the ANN model, the training, the testing, and the total phases are analyzed. The plot of the predicted versus experimental rejection of anti-inflammatory drugs and the parameters of the linear regression are directly obtained using the Matlab function “postreg”.
Predicted vs experimental phase agreement plot: (a) for the training phase, (b) for the testing phase, and (c) a for the total phase.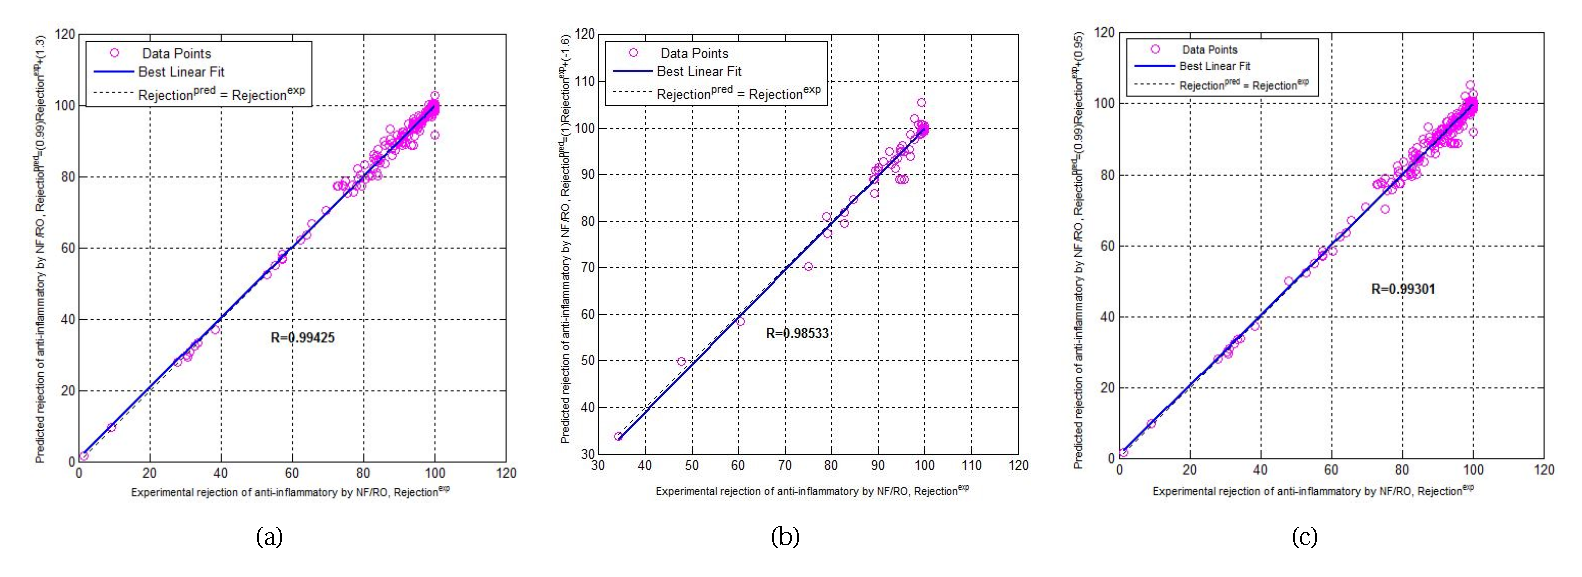
Structures of the optimized ANN model
| Training algorithm | Input layer | Hidden layer | Output layer | ||||
|---|---|---|---|---|---|---|---|
| Neurons number | Neurons number | Activation function | Neurons number | Activation function | |||
| BFGS quasi-Newton (trainbfg) | 13 | 25 | Hyperbolic tangent sigmoid transfer function (tansig) | 1 | Linear transfer function (purelin) | ||
Figure 5 shows the predicted vs experimental data agreement plot: (a) for the training phase, (b) for the testing phase, and (c) for the total phase. Figure 5a points to the training agreement plot which shows the predicted output values following exactly the trend of the experimental data values with an agreement vector approaching the ideal, [a (slope), b (intercept), (correlation coefficient)] = [0.9859, 1.2938, 0.9942], which demonstrates the predictive ability and accuracy of our model. The testing phase agreement scheme is mentioned in Figure 5b which illustrates the ANNs model calculated outputs versus the experimental data with an agreement vector [a (slope), b (intercept), R (correlation coefficient)] = [1.0148, − 1.5758, 0.9853]. It shows good robustness of the established ANN model and the possibility of predicting the different parameters that characterize the removal of anti-inflammatory drugs by NF/RO. The total phase agreement scheme is shown in Figure 5c which illustrates the ANNs model calculated outputs versus the experimental data with an agreement vector, [a (slope), b (intercept), R (correlation coefficient)] = [0.9892, 0.9511, 0.9930]. This reveals the excellent modeling of the whole data by the optimized network.
The errors of the ANNs model for the training phase, testing phase, and total phase are: the correlation coefficient (R), the mean absolute error (MAE), the model predictive error (MPE), the root mean squared error (RMSE), the standard error of prediction (SEP), residual predictive deviation (RPD), and range error ratio (RER). The errors calculated confirm the prediction capacity of the rejection of anti-inflammatory drugs by NF/RO membrane. Equations of those parameters are given below [19]:
| (8) |
| (9) |
| (10) |
| (11) |
| (12) |
| (13) |
Statistical parameters of the ANNs model
| Training phase | Testing phase | Total phase | |
|---|---|---|---|
| Correlation coefficient (R) | 0.9942 | 0.9853 | 0.9930 |
| Mean absolute error (MAE) (%) | 1.0669 | 1.3504 | 1.1236 |
| Model predictive error (MPE) (%) | 1.3905 | 1.5300 | 1.4184 |
| Root mean squared error (RMSE) (%) | 1.7133 | 2.1515 | 1.8094 |
| Standard error of prediction (SEP) (%) | 1.8957 | 2.3254 | 1.9926 |
| Residual predictive deviation (RPD) (%) | 9.3512 | 5.6898 | 8.4808 |
| Range error ratio (RER)(%) | 57.6144 | 30.6188 | 54.5525 |
The statistical parameters of the ANNs model for the phases concerning the training, testing, and total are shown in Table 2. The correlation coefficient (R) for the training phase is 0.9942, which indicates excellent agreement. The testing phase correlation coefficient represents a comparison between the experimental data and predicted results in order to show the interpolating ability of the ANNs model. For the testing phase, the correlation coefficient is 0.9853, which demonstrates the good agreement between the experimental rejections and the predicted rejections.
The contribution of the input variables (dc, logD, length, Eqwidth, MWCO, SR(NaCl), contact angle, Zeta potential, pH, pressure, recovery, and temperature) on the output (rejection) was determined by a sensitivity analysis using the “Weight” method. This method, proposed initially by Garson [39] and repeated by Goh [40] provides a quantification of the relative importance (RI) of the inputs on the output of the ANNs model. It is based on the partitioning of connection weights to:
- Connection weights of input–hidden;
- Connection weights of hidden–output.
The RI of all output weights attributable to the given input variable is then obtained by the two following equations:
| (14) |
| (15) |
The contribution results are shown in Figure 6. The most important variables that may influence the rejection of anti-inflammatory drugs by NF/RO are contact angle, Zeta potential, dc, length, SR(NaCl), pressure, pH, MWCO, dipole moment, recovery, logD, eqwidth, Temperature. All input relevant variables have a significant contribution (RI 2%). This sensitivity analysis by the weight method successfully identified the true importance of all the variables used for the modeling of the rejection of anti-inflammatory drugs by NF/RO, and therefore, proves the correctness of the choice of variables that were used in this study.
In this study, the same database employed to build the ANNs model is used for building the SVM for modeling the rejection of anti-inflammatory drugs by NF/RO. The SVM model generates a nonlinear relationship between the inputs (dc, logD, length molecular, Eqwidth, MWCO, SR(NaCl), contact angle, Zeta potential, pH, pressure, recovery, and temperature) and the output (rejection).
The plot of the relative importance (RI) of the ANN model for modeling the rejection of anti-inflammatory drugs by NF/RO membranes.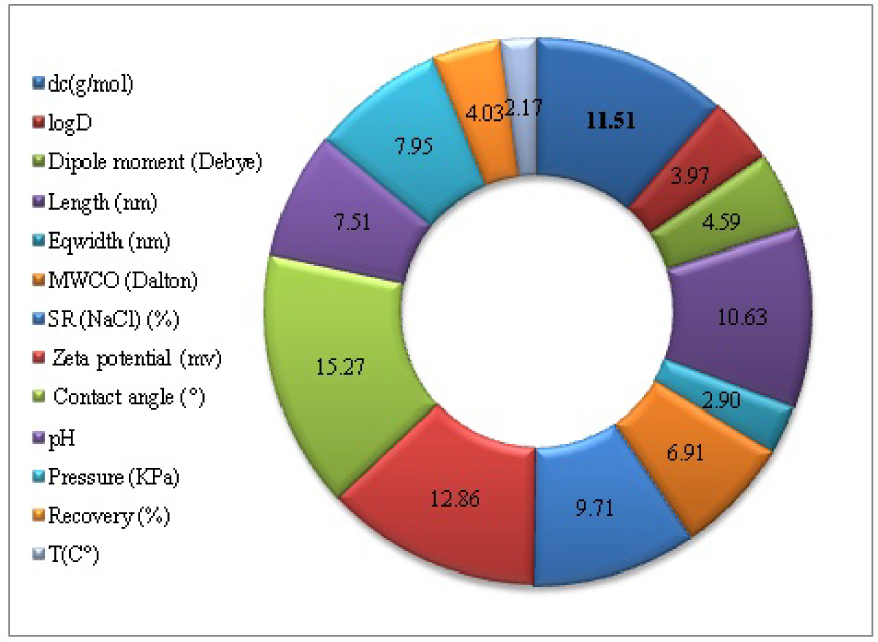
Predicted versus experimental data agreement plot: (a) for the training phase, (b) for the testing phase, and (c) for the total phase.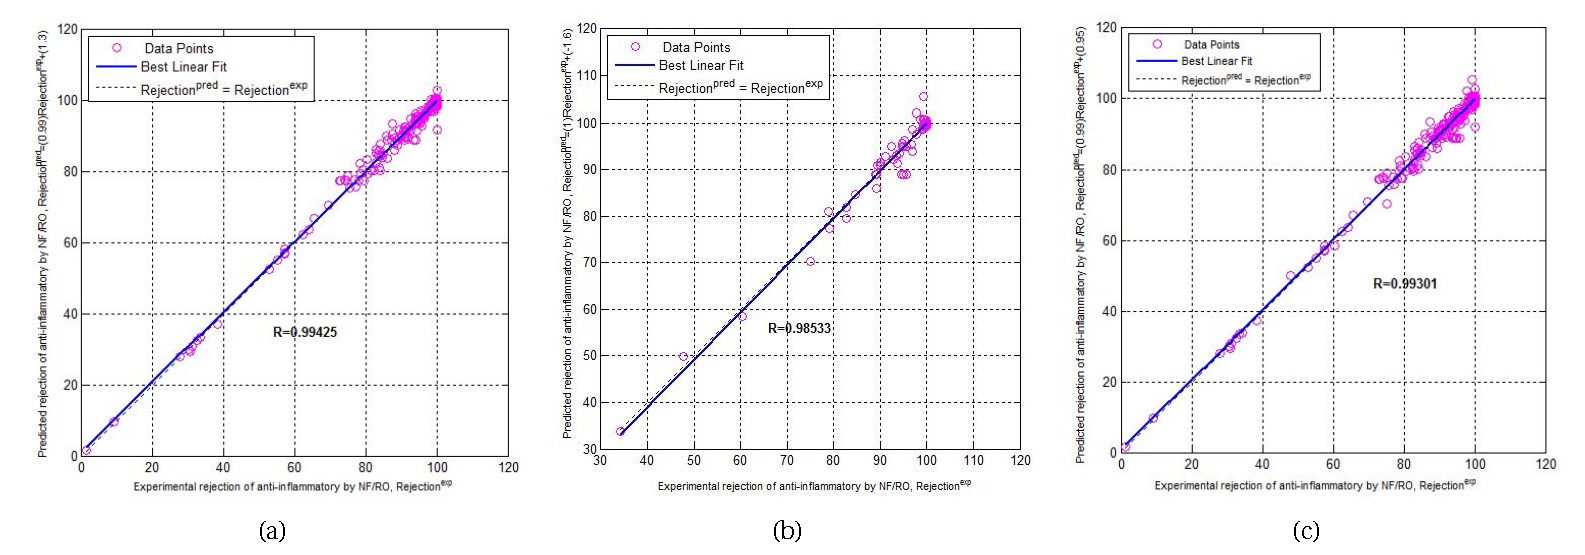
Evaluation of different SVM models using different kernels and optimal values of hyperparameters
| Kernel functions | N° SV | Phase | AEM | R |
|---|---|---|---|---|
| Linear | ||||
| C = 10.0000 | 107 | Training phase | 6.6477% | 0.7130 |
| nu = 0.5000 | Testing phase | 5.9999% | 0.7715 | |
| Overall phase | 6.5180% | 0.7169 | ||
| Polynomial | ||||
| C = 10.0000 | 54 | Training phase | 5.5228% | 0.9137 |
| nu = 0.5000 | Testing phase | 5.9648% | 0.8525 | |
| Degree = 3 | Overall phase | 5.6112% | 0.9036 | |
| Gamma = 0.51 | ||||
| RBF | ||||
| C = 10.0000 | 96 | Training phase | 1.3179% | 0.9934 |
| nu = 0.5000 | Testing phase | 2.0162% | 0.9711 | |
| Gamma = 3.51 | Overall phase | 1.4576% | 0.9899 | |
| Sigmoid | ||||
| C = 13.0000 | 22 | Training phase | 8.8734% | 0.82 |
| nu = 0.3000 | Testing phase | 10.7724% | 0.6839 | |
| Gamma = 0.078 | Overall phase | 9.2532% | 0.7968 | |
N° SV: Number of support vector.
AEM: Absolute error mean.
R: Correlation coefficient.
Table 3 presents the comparison between the different kernel functions (linear, polynomial, radial basis function (RBF), and sigmoid). The mean absolute errors of the SVM model with RBF (MAE = 1.3179% for training phases, MAE = 2.0162% for the testing phase, and MAE = 1.4576% for overall phase) are lower than the mean absolute errors of SVM models with other kernel functions (linear, polynomial, and sigmoid) for all phases (training, testing, and overall). The correlation coefficients for the SVM model with RBF function are: 0.9934 for training phases, 0.9711 for testing phases, and 0.9899 for the total phase. These correlation coefficients are approaching the ideal (R = 1) unlike the correlation coefficients of SVM models with other kernel functions (linear, polynomial, and sigmoid). It can be seen that the SVM model with RBF function is more powerful and effective than the SVM models with (linear, polynomial, and sigmoid). Also, it is clear that the RBF kernel function is more appropriate to describe the rejection of anti-inflammatory drugs by NF/RO using an SVM model. The RBF is by far the most popular choice of kernel functions (linear, polynomial, and sigmoid) used in the SVM model.
Statistical evaluation of the models’ performance
| ANN model | SVM model | ||||||
|---|---|---|---|---|---|---|---|
| Training phase | Testing phase | Total phase | Training phase | Testing phase | Total phase | ||
| R | 0.9942 | 0.9853 | 0.9930 | 0.9934 | 0.9711 | 0.9900 | |
| MAE (%) | 1.0669 | 1.3504 | 1.1236 | 1.3179 | 2.0163 | 1.4576 | |
| MPE (%) | 1.3905 | 1.5300 | 1.4184 | 2.8955 | 2.6508 | 2.8465 | |
| RMSE (%) | 1.7133 | 2.1515 | 1.8094 | 1.8654 | 3.3269 | 2.2355 | |
| SEP (%) | 1.8957 | 2.3254 | 1.9926 | 2.0557 | 3.6533 | 2.4618 | |
| RPD (%) | 9.3512 | 5.6898 | 8.4808 | 8.5353 | 3.8769 | 6.8644 | |
| RER (%) | 57.6144 | 30.6188 | 54.5525 | 52.9154 | 20.0713 | 15.3455 | |
| MSE (%) | 2.9353 | 4.6291 | 3.2741 | 3.4798 | 11.0684 | 4.9975 | |
| MRSE (%) | 6.1443 × 10⁻⁸ | 3.8806 × 10⁻⁶ | 3.6182 × 10⁻⁷ | 7.9024 × 10⁻⁶ | 8.2151 × 10⁻⁵ | 1.6468 × 10⁻⁵ | |
| RAE (%) | 2.4788 × 10⁻⁴ | 0.0020 | 6.0151 × 10⁻⁴ | 0.0028 | 0.0091 | 0.0041 | |
| Af | 1.0002 | 1.0033 | 1.0005 | 1.0056 | 1.0183 | 1.0081 | |
| Bf | 0.9998 | 1.0033 | 1.0005 | 1.0056 | 1.0183 | 1.0081 | |
Figure 7 shows the total agreement plots for the rejections of anti-inflammatory drugs by NF/RO with agreement vectors approaching the ideal [𝛼 = 1 (slope), 𝛽 = 0 (intercept), R = 1 (correlation coefficient)]. The SVM model exhibited acceptable efficiency in correlating the training phase, confirmed by a correlation coefficient value of 0.9934 and a significantly low root mean squared error RMSE of 1.8654%. The testing phase indicates the excellent generalization performance of the SVM model (0.95 < R < 1), inasmuch as the correlation coefficient “R” and root mean squared error “RMSE” are 0.9711 and 3.3269% respectively. Besides, the predictive ability of the SVM model is demonstrated by the total phase, which follows closely the trend of the experimental rejections of anti-inflammatory drugs by NF/RO, except for few points for which the deviations between experimental and model-predicted values are noteworthy. The correlation coefficient “R” and root mean squared error “RMSE” are 0.9900 and 2.2355% respectively.
5. Comparison of models
The ANNs and the SVM models developed in this work for the estimation of the rejection of anti-inflammatory drugs by NF/RO are compared in terms of certain statistical parameters for the determination of model performance. The evaluation criteria listed above are the correlation coefficient (R), the mean absolute error (MAE), the model predictive error (MPE), the root mean squared error (RMSE), the standard error of prediction (SEP), residual predictive deviation (RPD), and Range Error Ratio (RER). These errors are calculated for the evaluation of the accurate predictions of each model. In addition, other evaluation terms are considered, namely, the mean square error (MSE), the mean relative squared error (MRSE), the relative absolute error (RAE), the accuracy factor (Af), and bias factor (Bf) all of which are given by the following equations [24]:
| (16) |
| (17) |
| (18) |
| (19) |
| (20) |
The values of the twelve statistical evaluation indices of the two models discussed in this work for prediction (training, testing, and total phases) are shown in Table 4. Firstly, the ANNs model has small errors compared to the SVM model in the training phase, the testing phase, and the total phase (, MAE = 1.1236%, MPE = 1.4184%, RMSE = 1.8094%, SEP = 1.9926%, MSE = 3.2741%, MRSE = 3.6182 × 10⁻⁷ %, RAE = 6.0151 × 10⁻⁴ %, Af = 1.0005%, and Bf = 1.0005% for the total phase).
On the other hand, we adopted the five-level interpretations of Residual Predictive Deviation “RPD” and Range Error Ratio “RER” provided by Viscarra Rossel: excellent predictions (RPD and RER > 2.5); good (RPD and RER of 2.0 to 2.5); approximate quantitative predictions (RPD and RER of 1.8 to 2.0); possibility to distinguish high and low values (RPD and RER of 1.4 to 1.8); and unsuccessful (RPD and RER < 1.40) [22, 41]. The RPD and RER of the ANNs and SVM models are higher than 2.5 (RPD = 8.4808% and RER = 54.5525% for ANN; RPD = 6.8644% and RER = 15.3455% for SVM) for the total phase. Based on RMSE, it can be seen that the ANN based model surpassed the SVM model. Moreover, the values of R, MAE, MPE, SEP, RPD, RER, MSE, MRSE, RAE, Af, and Bf (for the training phases, for the testing phase, and for the total phase) in addition to the RMSE imply that the ANNs have more predictive power than the SVM model proposed in this work. They allow the representation of the nonlinear relationship between the rejection of the anti-inflammatory drugs and NF/RO.
6. Conclusions
In this study, two models (ANN and SVM) were developed for modeling the 300 rejections by NF/RO of seven anti-inflammatory drugs. The sensitivity analysis by weight method identified that the most important variables that influence the rejection are: dc, molecular length, contact angle, and zeta potential. These input relevant variables have a significant contribution (relative importance RI > 10%). Experimental data was selected from the literature and closely analyzed statistically.
Both the artificial intelligence approaches (ANN and SVM) show good correlative and predictive accuracy to describe the rejections of anti-inflammatory drugs by NF/RO. The statistical comparison between the two different models reveals the good performance of the ANN model for predicting the rejections of anti-inflammatory drugs. Furthermore, the ANN model (correlation coefficient R = 0.9930 and RMSE = 1.8094% for total phase) outperformed the SVM model with a total, correlation coefficient R of 0.9900, and a root means squared error RMSE of 2.2355%. These results demonstrate the superiority of ANN to describe the rejection of anti-inflammatory drugs by NF/RO.