


 CC-BY 4.0
1. Introduction
Azo–hydrazone tautomerism, a phenomenon intrinsic to molecules containing the protic functional group conjugated with the azo linkage, has been studied intensely for over a century. Ever since the coexistence of two isomeric species of 1-(phenyldiazenyl)naphthalene-2-ol in solution has been discovered, a myriad of papers has been reported debating this subject for numerous compounds, by means of both various chemometric and spectroscopic tools [1, 2, 3]. It is a feature of great importance, since the different tautomers of a particular compound bear different characteristics, regarding dyeing abilities and physicochemical properties. Hence, it is of great pertinence to determine the predominance of particular tautomers in solution, which is affected by the manifold factors, such as the nature of a solvent used, the pH level of the medium, temperature, etc. The medium that solvates the substance plays an important role in its electronic behavior. It is a well-known fact that the nature of the solvent affects the solvatochromic characteristics of a particular compound due to the intermolecular interactions with a solute. These changes are manifested via a shift of the absorption peaks as well as the form and the intensity of the absorption bands in the UV–Vis spectrum. Likewise, the solvent may also affect the proton transfer through a certain molecule i.e. the equilibrium of possible constitutional isomers, by favoring one tautomeric form in the solution [4]. It is important to emphasize that the structure of the individual tautomer itself is decisive, which is reflected through its polarity and ability to form hydrogen bonds with the solvent molecules. The strength of these specific and nonspecific interactions is a limiting factor that influences further solvent-tautomeric proton interactions, and therefore, the prototropy. On the other hand, there is a drawback in this field of research regarding the inability of spectroscopic characterization techniques, such as UV–Vis, FT-IR and NMR spectroscopy, to identify individual tautomeric species of certain molecules in solution [1, 5]. In order to overcome the lack of information given by spectroscopic methods for a pure, single tautomer, various mathematical approximations provided by quantum-chemical models are often employed in the research [3].
The previous study encompassed the synthesis and characterization of six azo dye molecules, derived from benzoic- and cinnamic acids (Scheme 1), and the evaluation of their photovoltaic performance in dye-sensitized solar cells (DSSC). The molecular donor–π–acceptor structure of the sensitizer plays a pivotal role in dye-sensitized solar cells, whereas the intramolecular charge transfer from donor to acceptor is critically important to guarantee proper solar cell functionality. Therefore, the determination of the exact structural forms in a different environment (solvents, acidic and basic medium) for the investigated compounds is essential, since they exhibit azo–hydrazone tautomerism and thus different charge distributions. Although four of them exhibit the tautomeric property from a theoretical standpoint, for the purpose of the previous research, only two systems were investigated [6].
The molecular structures of azo–hydrazone tautomers of the investigated azo dyes, where R refers to: –COOH (A1 and B1), –(CH=CH)COOCH3 (A2a and B2a) or –(CH=CH)COOH (A2 and B2).
In this paper, the study was extended and the tautomeric behavior of four compounds based on benzoic- (A1, B1) and cinnamic acids (A2, B2) (Scheme 1) was minutely elucidated through coordinated experimental and computational approaches. Furthermore, the analysis of the corresponding cinnamic esters (A2a and B2a) (Scheme 1) is included in the study. The correlation of the molecular structure and solvatochromic properties of the selected compounds was conducted. The solvatochromism of the mentioned compounds was studied by means of UV–Vis spectroscopy, using 34 solvents of different polarities and hydrogen bond capabilities. Also, the influence of the acidic and the alkaline medium on the tautomeric equilibrium was implemented in the same manner. Linear solvation energy relationships (LSERs) were carried out by using the Catalán solvatochromic equation for the quantitative examination of specific and nonspecific interactions between the solvent and the investigated dyes. Experimental results were supported by the theoretical investigation using DFT B3LYP and M06-2X methods. The geometries of neutral and possible anionic forms are optimized in a vacuum, ethanol, and dimethylsulfoxide (DMSO) and UV–Vis absorption spectra of all possible neutral and anionic forms of the compounds are simulated in ethanol.
2. Experimental section
All the investigated azo dye molecules were synthesized by a diazo-coupling reaction between the appropriate diazonium salt and the corresponding coupling reagent. The detailed synthetic procedures, as well as the thorough characterization of the selected compounds, have been provided in the previous paper, including melting points, FT-IR, 1H and 13C NMR spectroscopic analysis [6]. The UV–Vis 1700 Shimadzu spectrophotometer was used to provide the absorption spectra of dye molecules at room temperature. All dyes were dissolved in spectral grade solvents, purchased from Acros, Macron and Merck, and were used without further purification. The concentration of the compounds was 5 × 10⁻⁵ M, whereby the absorption spectra were taken within the wavelength range of 250–700 nm. UV–Vis spectra are independent of the dye concentrations indicating that aggregation or formation of dimers could be neglected.
2.1. Method of calculation
All density functional theory (DFT) calculations were carried out with the Gaussian 09 program package [7] by B3LYP [8] and M06-2X [9] methods with 6-311++G(d,p) basis set. For the M06-2X method UltraFineGrid, (99,590)p grid, for Euler–Maclaurin integration was used. The stability of the optimized geometries was confirmed by frequency calculations. Frequency calculations were also used to obtain the zero point energy corrections (ZPE) at 298.15 K and standard pressure. The UV–Vis absorption energies and spectra of the dyes were calculated using the TD-DFT method and the solvent effect (ethanol) was introduced by the conductor-like polarizable continuum model (CPCM) [10]. GaussView 5.0 [11] was used for a visual presentation of the UV–Vis spectra.
3. Results and discussion
The FT-IR, 1H and 13C NMR spectroscopic characterization provided data that confirmed the existence of the hydrazone tautomeric forms of A1 and A2 and the azo forms for B1 and B2 in the solid state and DMSO-d6 [6]. As for the ester A2a, the same occurrence as with A1 and A2 could be observed. The stretching vibrations of C =O and C =N functional groups in the 1500–1700 cm−1 region coupled with an intense, wide band at 3445 cm−1, that corresponds to the –NH stretching vibration, clearly indicate the presence of the hydrazone form. However, for the B2a ester, the absence of a stretching vibration of the second carbonyl group originated from the non-carboxylic C =O, as well as vibrations at 3426 and 1505 cm−1 ascribed to the stretching of OH and N =N groups, respectively, undoubtedly support the azo tautomeric form in the solid state.
From the 1H NMR investigation standpoint, a sole peak displayed at 15.85 ppm indicated the existence of the –NH proton of the hydrazone tautomer for A2a. The 13C NMR analysis provided additional evidence which goes in favor of the hydrazone molecule as well, displaying a signal at 167.15 ppm, as it was assigned to the carbonyl C-atom of this compound. The concordant NMR data for B2a, were not observed, while the peak from the OH group was found at 10.51 ppm, from which it can be concluded that this dye molecule only exists as an azo tautomer in DMSO-d6.
3.1. The DFT study
3.1.1. Molecular geometry
Recent experimental results [6] showed that the molecules of the A-series exist in the hydrazone tautomeric form, while the molecules in the B-series exist exclusively in the azo form. In order to verify these observations, a DFT analysis of possible tautomeric forms for these two series was performed. The calculations were done by B3LYP and M06-2X methods and the tautomer ratio was determined by Boltzmann distribution.
Calculations for the molecules of the A-series show that they exist in solution predominantly in the hydrazone tautomeric form, while the presence of azo tautomers is also possible (Table S1, Supporting information). However, different calculation methods do not agree with the ratio of these tautomeric forms, so the B3LYP method in vacuum predicts an azo–hydrazone ratio of about 9:91, while at the same time the same model in ethanol as the solvent gives a ratio of 1.4:98.6 for molecule A2. Simultaneously, calculations of the M06-2X method in vacuum show a predominance of the azo tautomer over hydrazone (78.1:21.9), while in ethanol and DMSO as solvents this ratio changes in favor of the hydrazone form (azo:hydrazone = 40:60). Similar results were obtained for other molecules in the A-series.
The same calculations for molecules from the B-series fully support experimental findings that they exist exclusively in the azo form. Most methods predict the amount of azo tautomer of more than 99.99% except B3LYP method in ethanol which predicts the existence of the hydrazone tautomer of ∼1%. Therefore, in this investigation, the hydrazone and azo tautomers of molecules from the A-series are studied in detail, while from the B-series of molecules only the azo tautomer is studied. Given that the molecules derived from benzoic acid (A1 and B1), with respect to their mutual rotational position of azo (N =N) and carboxylic (C =O) double bonds, can exist in only two conformational forms and the fact that their energies and electronic properties are almost identical, our conformational study is focussed primarily on the molecules based on the cinnamic acid.
Dye molecules containing the cinnamic acid moiety can exist in four conformational forms depending on the mutual rotational position of the three conjugated double bonds (N =N, C =C vinyl, and C =O bonds). These conformers are energetically different enough to reflect this difference in their electronic properties and share in the solution. On the basis of similarity with the butadiene system and the molecule from our previous work [12], the conformers of these molecules are designated using the s-cis and s-trans notation.
Relative ZPE corrected energies (ΔE) of fully optimized geometries of the neutral forms at M06-2X/6 311++G(d,p) and statistical Boltzmann distribution weights (𝜔) are given in Table S1, Supporting information. The geometries of hydrazone tautomer of molecule A2 and reaction coordinates for the transition between them are given in Figure 1, while for B2 is presented in Figure S1, Supporting information.
The geometries of hydrazone tautomer of molecule A2 and relaxed reaction coordinates for transition between them.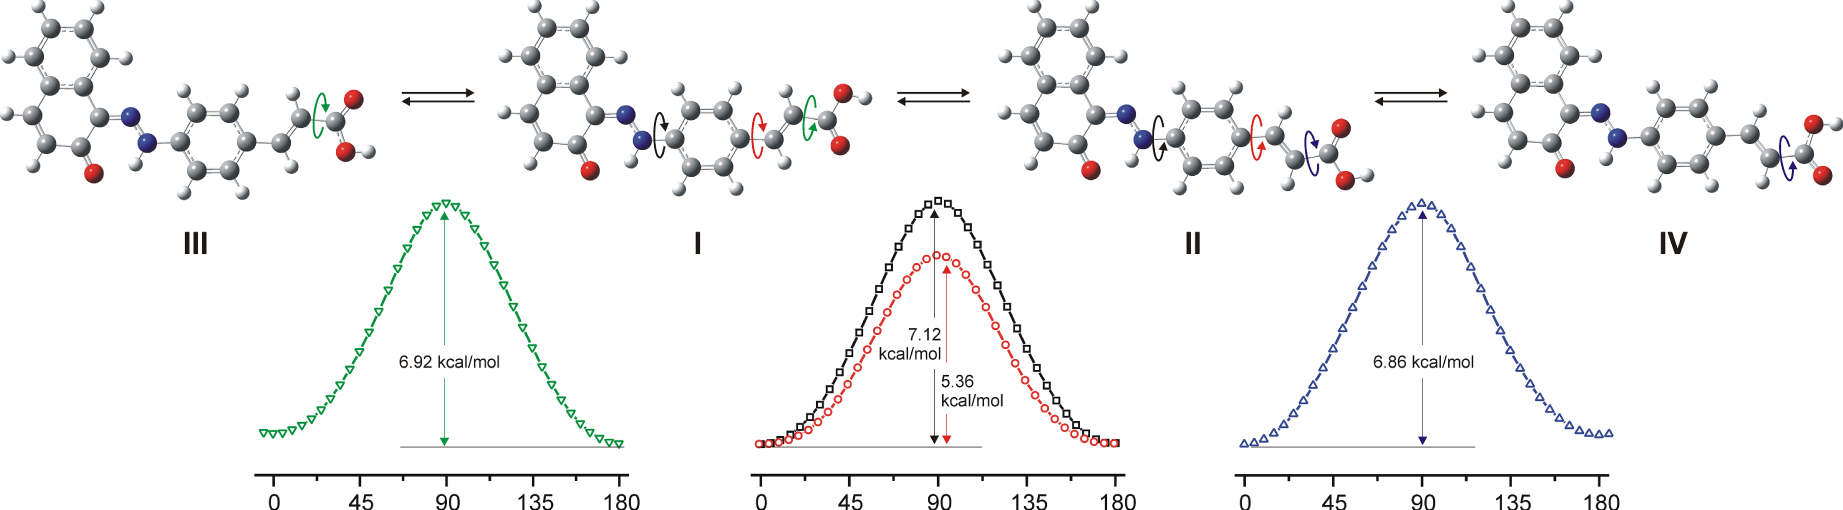
The energy difference between the most stable s-cis, s-cis (I) and the least stable s-trans, s-trans (IV) conformers ranges from 0.3 to 0.5 kcal/mol depending on the calculation model used and the order of stability of the conformers is retained in all calculation models. From the energy relation of conformers, it can be concluded that the mutual rotational position of the C =C and C =O double bonds has the greatest impact on the energy of this part of the conjugated system. The influence of the interposition of the N =N and C =C bonds is energetically very small and generally below 0.1 kcal/mol. It must be noted that the energy relationship of the s-cis and s-trans positions of the N =N and C =C bonds through the phenyl group is completely inverted relative to the previously observed relationship of two N =N bonds in diazo pyridone dye from our previous work [12].
The effect of the position of the double bonds on the shift of the UV maxima is from 2 nm in A-series to 4 nm in B-series. This is not directly related to the total electronic energies but solely to the energy of the LUMO orbital i.e. conformers with the s-trans position of the N =N and C =C bonds have lower LUMO energies and show absorption maxima at higher wavelengths. The positions of C =C and C =O bonds show a very low influence on the position of the absorption maxima. The relax M06-2X/6-311G(d,p) reaction coordinates in ethanol are done for rotation around each single bond and geometries of corresponding transition states are fully optimized. The rotation barrier height for the transformation from the s-trans to s-cis conformers of the hydrazone form of A2 molecule (Figure 1) obtained with M06-2X/6-311G(d,p) calculations is relatively small (∼7.12 kcal/mol), but it is on the same level as in butadiene (6.57 kcal/mol), implying that the resonance is on a similar level. Only the rotation around the Ph–(C =C) bond results in a decrease in barrier height (5.36 kcal/mol), indicating that this link is the bottleneck for ICT transfer between naphthyl and cinnamic acid parts of the molecule.
The same analysis for molecule B2 showed that the rotational barriers for the C =C–C =O bond are slightly lower ( ∼6.4 kcal/mol) than that of molecule A2 but still at a similar level with butadiene (Figure S1, Supporting information). However, the rotations around single bonds, which through the phenyl group linking p-hydroxyphenyl and cinnamic acid parts, results in a significant decrease in the barrier height for Ph–(N =N) (4.74 kcal/mol) and even more for the Ph–(C =C) bond (4.18 kcal/mol). This indicates that there is a significant decrease in the resonance between the two phenyl rings and, in particular, between the phenyl ring and the cinnamic acid parts of the molecule. Consequently, this leads to the splitting of the molecules into three separate chromophores. Also, this is the reason for the large decrease of the maximum absorption wavelength with respect to the A-series compounds.
3.1.2. Analysis in ethanol
In solutions, theoretically, all the investigated molecules can undergo an acid–base equilibrium which can alter the position of the absorption maxima as well as the shape of their UV–Vis spectra. Compounds A1, A2, B1, and B2 possess two acidic protons and, under appropriate alkaline conditions, can be deprotonated giving anionic or even dianionic forms (Schemes 2 and S2, Supporting information). The ester molecules (A2a and B2a) have one acidic proton and can form anionic species as well. As these forms differ significantly in their electronic properties and in order to provide the theoretical background for a conducted research, a supplement analysis is provided by the DFT calculation.
The neutral and the theoretical possible anionic/dianionic molecular forms of the A2 compound. The similar scheme can be depicted for the rest of the investigated compounds, with an exception of the carboxylate anions in ester derivatives (A2a and B2a).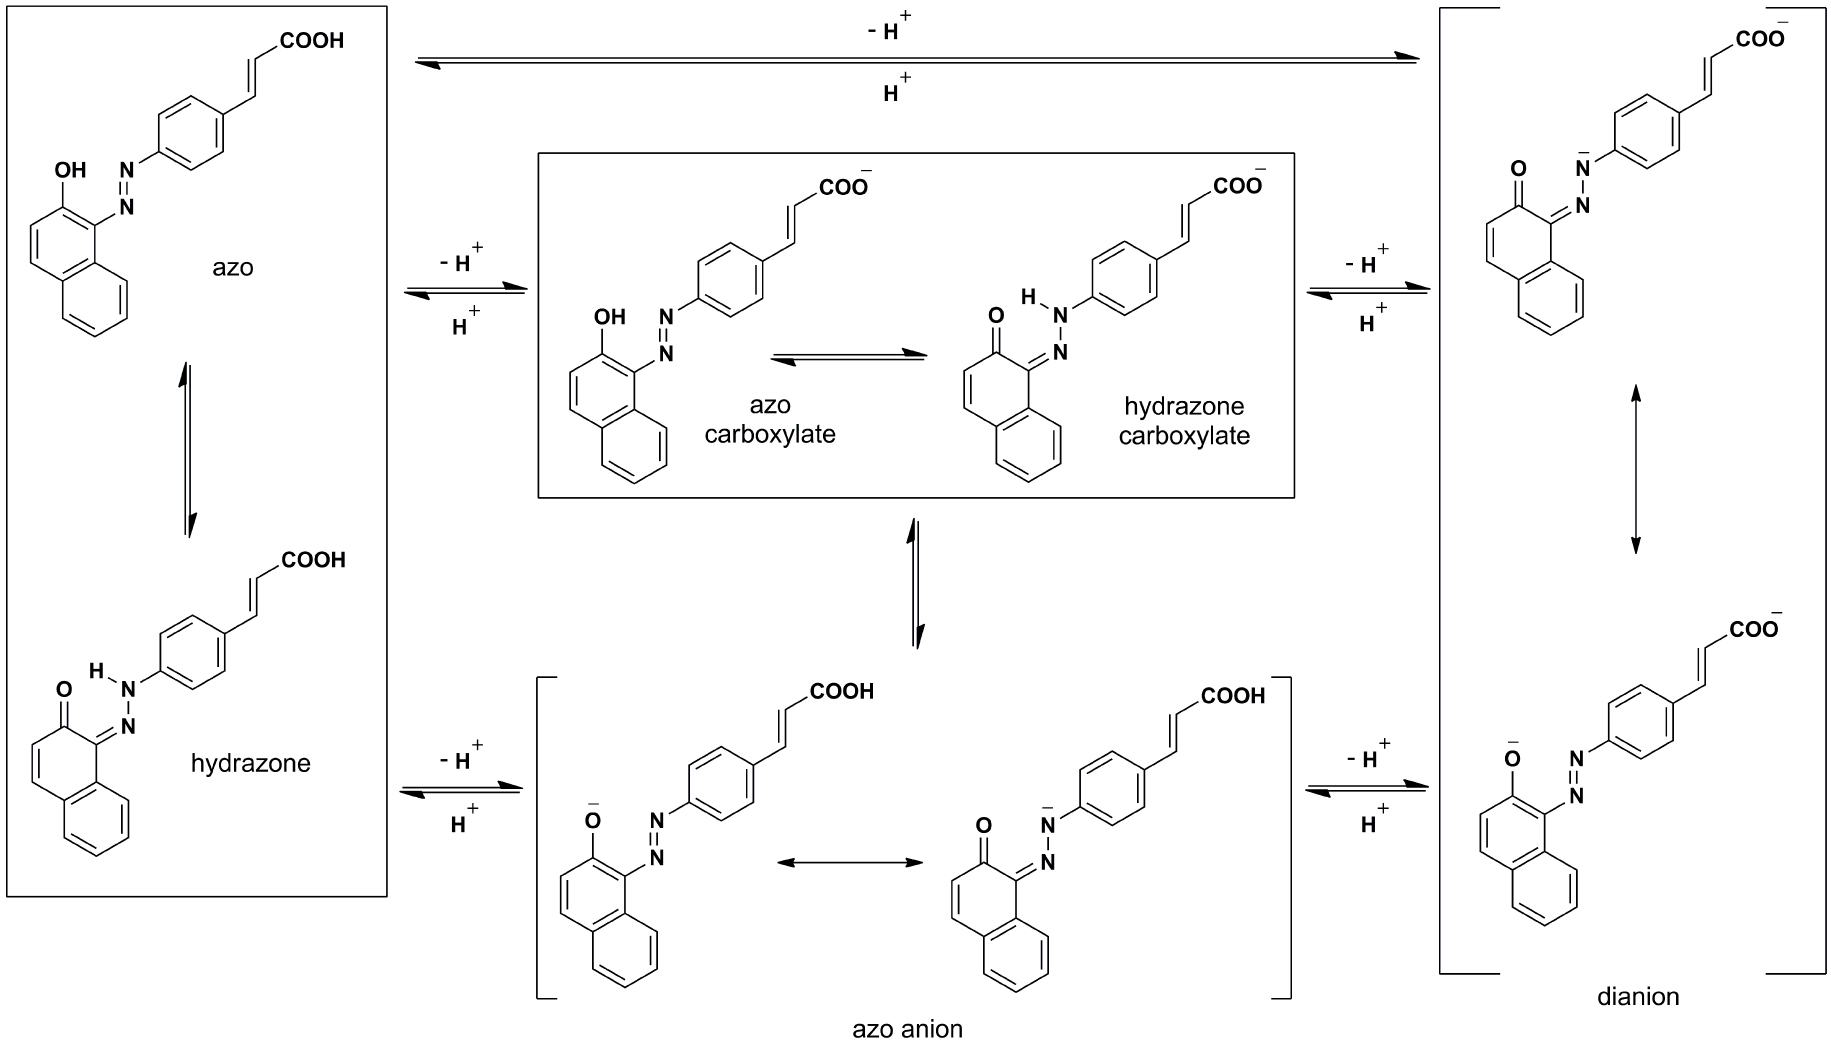
The geometries of neutral and possible anionic forms are optimized at B3LYP and M06-2X levels of theory in vacuum, ethanol and DMSO, and the results are presented in Tables S1 and S2, Supporting information, respectively. The theoretical and experimental UV–Vis spectra of A2 and B2 and corresponding esters obtained from ethanol according to M06-2X are presented in Figure 2. Figures S2–S4 (Supporting information), depict calculated UV–Vis spectra in ethanol of hydrazone, azo, and corresponding carboxylate forms of A2 with the pictorial representation of the most significant molecular orbitals that participate with the largest share in a given excitation, while for B2 these spectra are represented in Figures S5 and S6 (Supporting information). Theoretical calculations provided information that the most important excitation within the investigated molecules is the pure π–π* HOMO–LUMO transition. Furthermore, the computed charge density difference between ground state and first excited states and centroids of charge for dyes A1, A2, B1, and B2 are displayed in Figure S7 (Supporting information).
The comparison of experimentally and theoretically (M06-2X) obtained UV–Vis spectra of (a) A2, (b) A2a, (c) B2 and (d) B2a in plain ethanol.
Since the M06-2X method has been proven to underestimate absorption maxima but shows an excellent correlation with experimental spectra [13], the theoretical spectra are scaled with the factor of 1.15 for a better comparison with experimental ones. Figure 2 depicts the simulated UV–Vis absorption spectra along with experimental ones of the molecules derived from cinnamic acid along with their ester derivatives in ethanol. Similar results for benzoic analogues (A1 and B1) were obtained, therefore are omitted for the sake of clarity. The M06-2X theoretical calculations provided data by which the ratio of azo and hydrazone tautomeric species for A2 in plain ethanolic solution is 40.8:59.2 (Table S1, Supporting information), respectively. The most stable anionic species is obtained by the deprotonation of the carboxylic group rather than hydroxyl, which is energetically less favorable. By deprotonating the carboxylic group of the A2, two new tautomeric forms emerge azo carboxylate and hydrazone carboxylate (Scheme 2), whereby the ratio switches to 71.2:28.8 (Scheme S2, Supporting information) in favor of azo carboxylate. Namely, the experimentally obtained UV–Vis spectrum of the A2 molecule in plain ethanol displayed a wide absorption band in an approx. 350–550 nm domain (Figure 2a). This indicates the coexistence of both neutral and carboxylate azo/hydrazone species in a plain ethanol solution. A fact which favors this statement is the good matching of the experimentally obtained absorption peaks with the theoretically obtained ones in the higher energy domain (250–350 nm) of the spectrum.
However, the spectrum of the compound A2a exhibited the coexistence of only azo and hydrazone tautomer species in plain solution (theoretically calculated ratio 43.5:56.5, Table S1, Supporting information). For compounds of the B-series, the experimentally obtained UV–Vis spectrum of B2 compound markedly indicated the existence of the solely azo tautomer in the solution, which is in correspondence with theoretical calculations (Table S1, Supporting information). The compound B2a, however, exhibited the presence of the sole absorption peak originating from the azo tautomer (Figure 2d). This is consistent with the previously reported characterization analysis [6].
The experimental UV–Vis absorption spectra of the investigated azo dye molecules in: (a) diethyl ether, (b) tetrahydrofuran (c) acetic acid, and (d) methanol.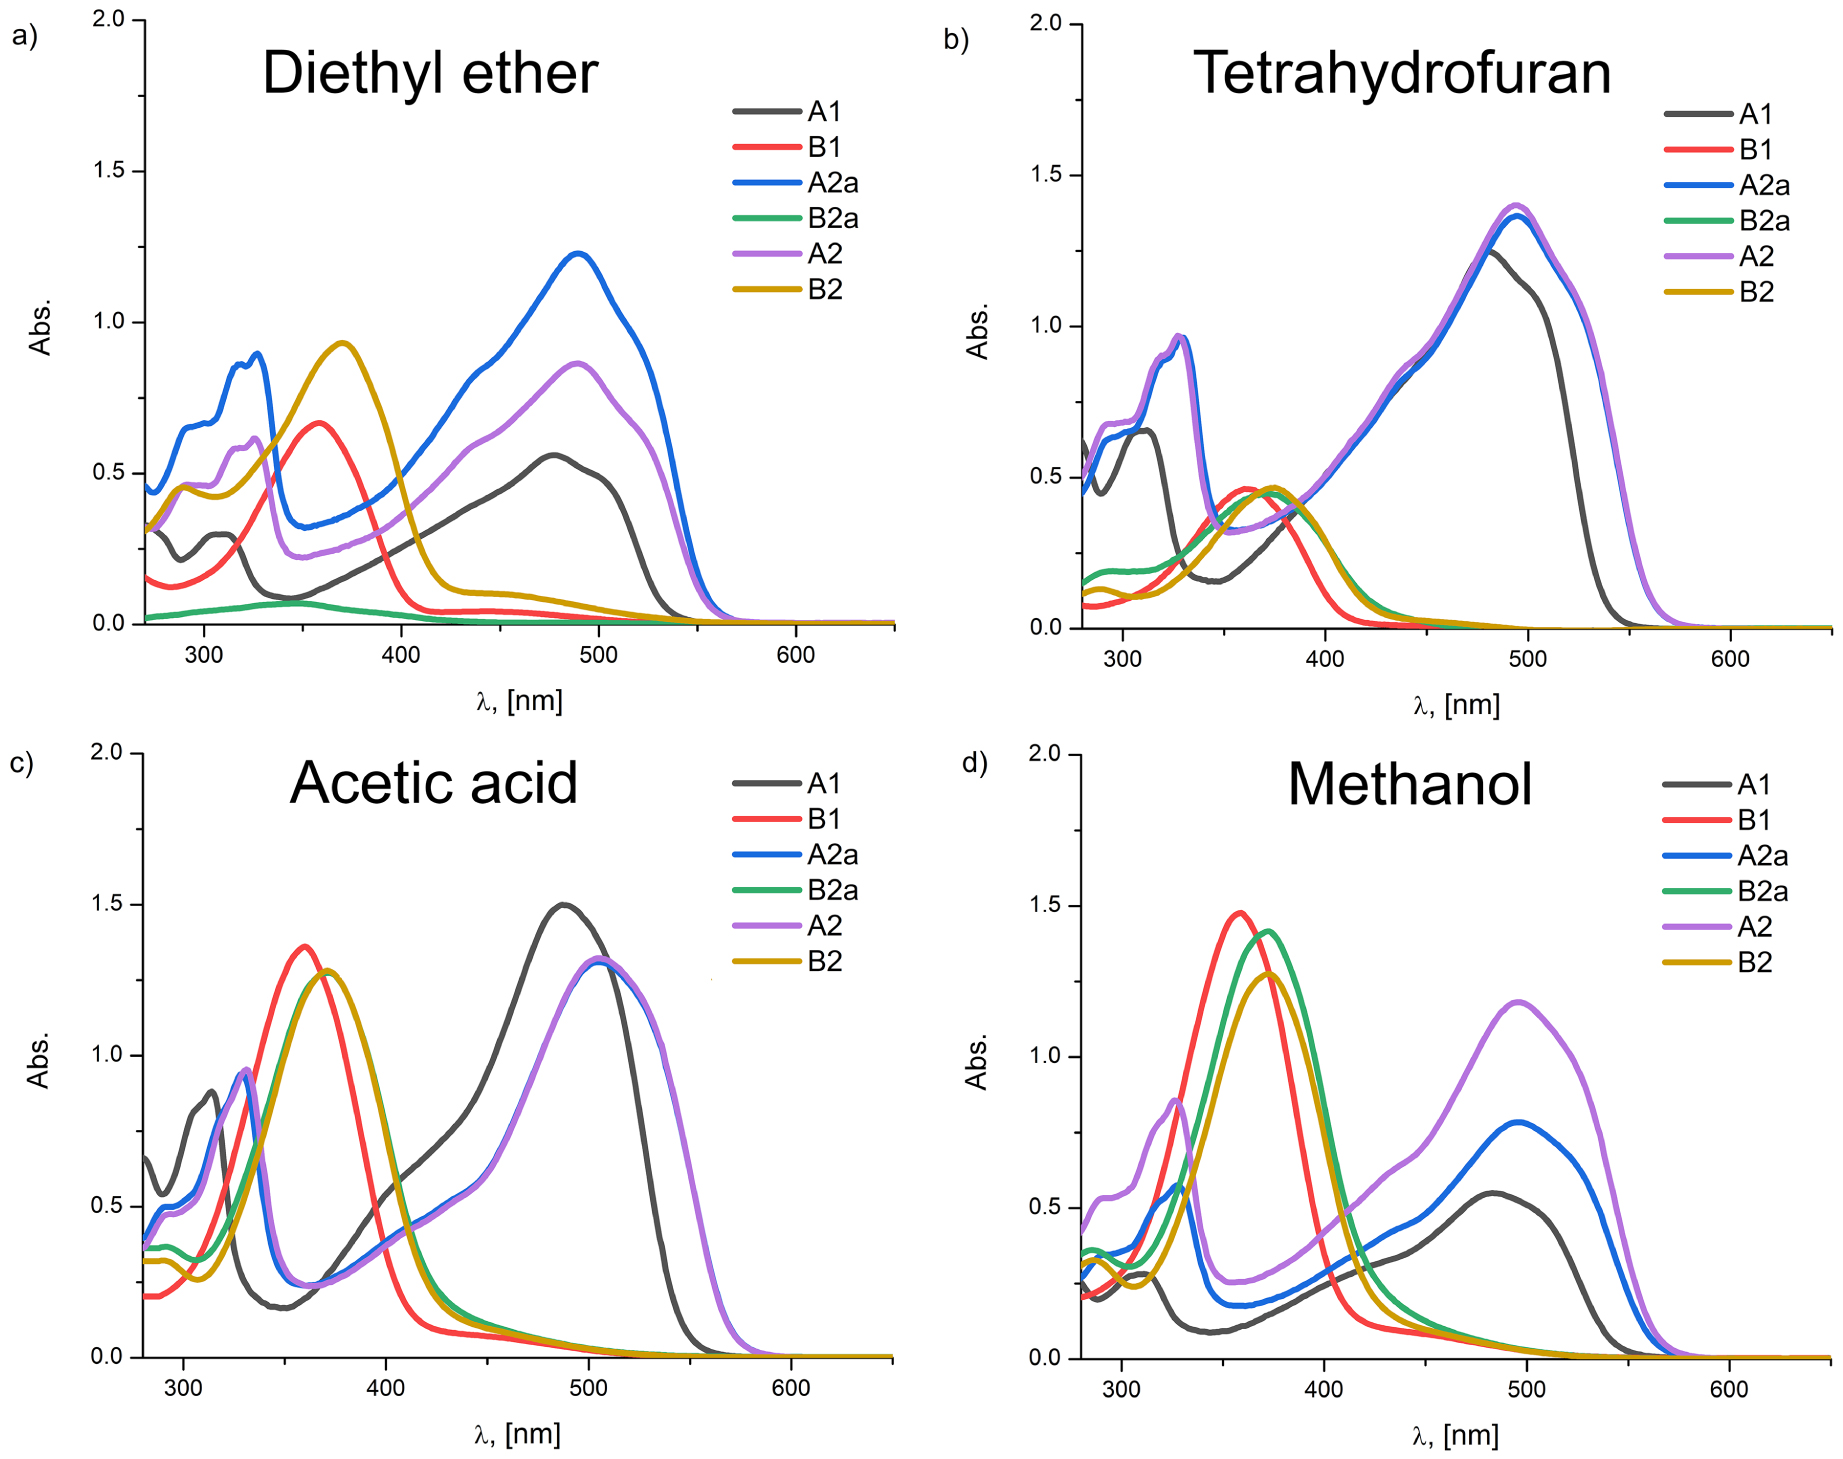
3.2. The solvatochromic properties of the investigated dyes
For the purpose of the previous research regarding the investigated dyes, the azo–hydrazone tautomerism was investigated for only two compounds out of six, A2 and B2 [6]. In order to further elaborate the solvatochromic features of the selected azo dyes, the scope of solvents was expanded in this paper. In such a way, one can get a more detailed insight into the nature of solvent–solute interactions. Figure 3 depicts the UV–Vis absorption spectra of all six compounds in three selected solvents with the most pronounced absorption differences, while Figure S8 (Supporting information) presents the analysis of chosen compounds in six more solvents. The absorption properties of the investigated dye molecules in 34 solvents are given in Table S3 (Supporting information).
The experimental UV–Vis absorption spectra of the individual molecule in a set of chosen solvents (a) A2 and (b) B2.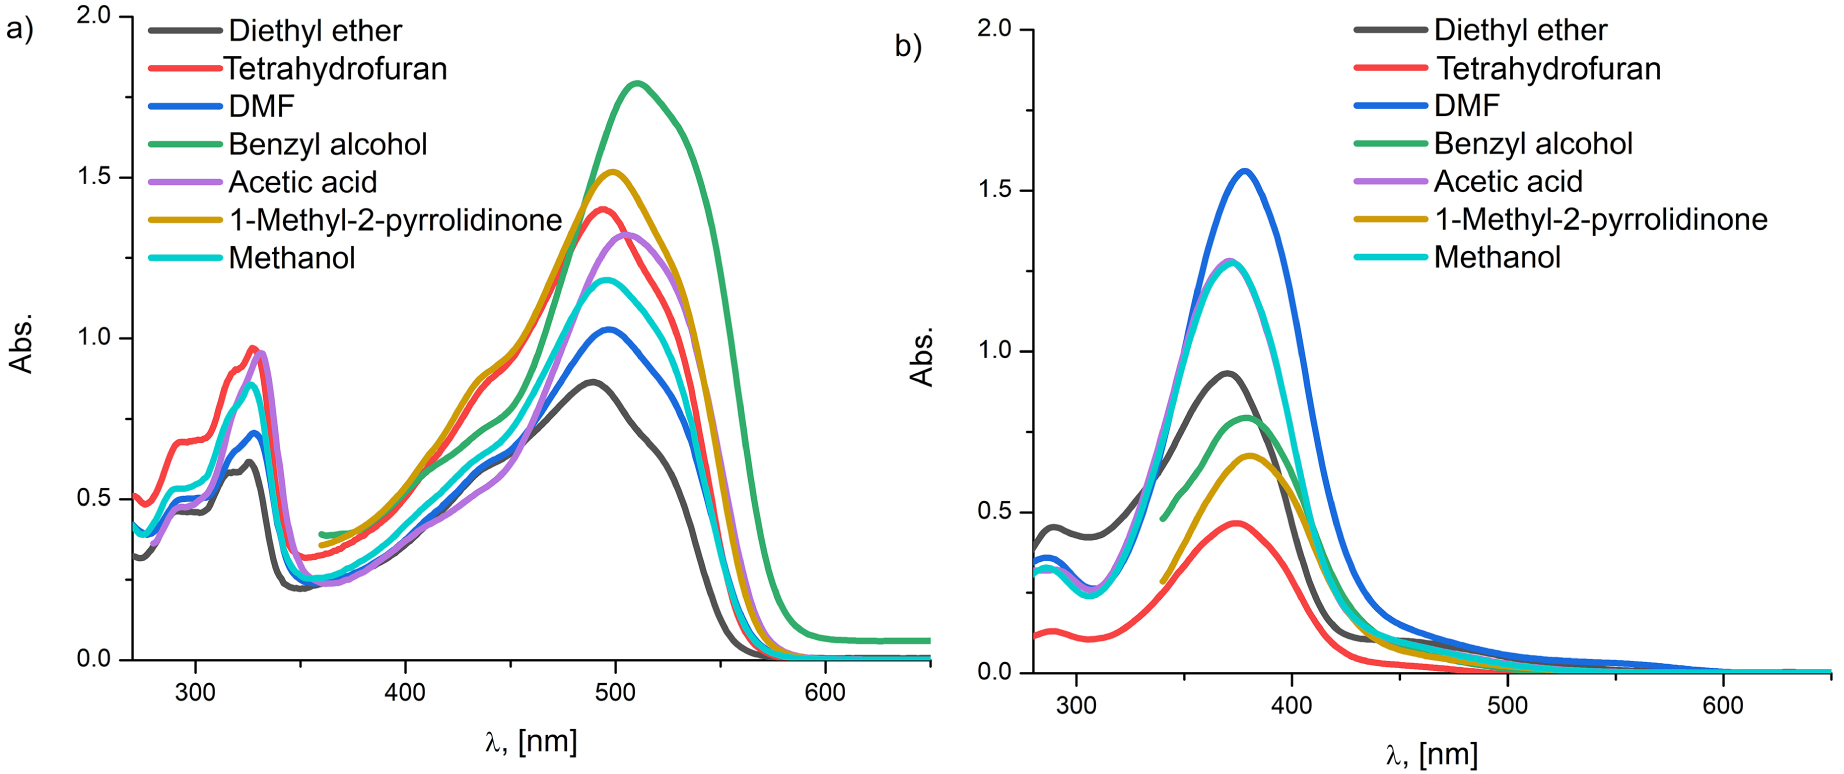
All the investigated compounds consisting of the naphthalene unit (A1, A2a, and A2) manifest large absorption band areas (Figure 3) with the predominance of hydrazone tautomers. From Figure 3 it can also be noticed that the absorption peaks of A2a and A2 compounds are bathochromically shifted relative to A1 as indicated by molecular geometry analysis (Section 3.1.1) [6]. It also can be observed that, regardless of the used solvent, with the exception of hexane and pentane, the absorption maxima of A2a and A2 are at approximately the same wavelength. This is somewhat predictable since the electron-withdrawing capabilities of the –COOCH3 and the –COOH groups are very similar.
As for the B-series analysis, all three mentioned compounds are hypsochromically shifted relative to corresponding compounds of the A-series. The UV–Vis absorption frequencies of phenol-based molecules (B1, B2a, and B2) appear as clean, single peaks in the 300–400 nm spectral area ascribed to azo tautomeric form.
3.3. The LSER analysis
Solvatochromism is denoted as a noticeable change of the UV–Vis maxima positions with the change of solvent polarity [14]. The degree and direction of solvatochromism depend on charge distribution, and consequently dipole moments of the ground and the electronically excited state of the molecule. If the ground state is more dipolar than the excited state, then the increase of solvent polarity stabilizes the former state more, leading to a hypsochromic shift (negative solvatochromism). Conversely, if the ground state is less dipolar than the excited state a bathochromic shift is observed with increasing solvent polarity (positive solvatochromism).
Figure 4 depicts the UV–Vis absorption spectra of both A2 and B2 in a set of chosen solvents of different properties, while the absorption spectra of compounds A1, B1, A2a, and B2a are depicted in the Supporting information (Figures S9 and S10). In general, it can be concluded that all compounds follow the same trends in the selected solvents. In order to quantitatively describe manifold and complex solvent–solute interactions, LSER analysis was performed using the Catalán model [15]. For all compounds, the dominant peaks were correlated. This model is among the first concepts that consider both nonspecific and specific interaction through two independent empirical scales and applied to UV–Vis absorption frequencies, 𝜈max is given as follows:
| (1) |
Regression fits to Catalán solvent parameters
𝜈0 ⋅ 10−3 (cm−1) | c ⋅ 10−3 (cm−1) | d ⋅ 10−3 (cm−1) | b ⋅ 10−3 (cm−1) | a ⋅ 10−3 (cm−1) | Ra | Fb | sdc | nd | Excluded solvents | |
|---|---|---|---|---|---|---|---|---|---|---|
| A1 | 22.075 (±0.118) | −1.789 (±0.149) | 0.086 (±0.040) | −0.136 (±0.056) | −0.600 (±0.052) | 0.954 | 105.942 | 0.051 | 30 | Chloroform |
| A2a | 21.741 (±0.077) | −2.135 (±0.138) | /e | /e | −0.604 (±0.054) | 0.960 | 164.287 | 0.060 | 31 | Ethyl acetate |
| A2 | 21.632 (±0.116) | −2.088 (±0.143) | /e | 0.170 (±0.054) | −0.659 (±0.050) | 0.970 | 136.016 | 0.055 | 30 | tert-Butanol |
| B1 | 30.875 (±0.228) | −3.292 (±0.288) | −0.392 (±0.089) | −1.111 (±0.115) | /e | 0.952 | 73.691 | 0.107 | 27 | tert-Butanol, Dichloromethane Formamide |
| B2a | 30.129 (±0.255) | −3.493 (±0.327) | −0.659 (±0.130) | −0.619 (±0.158) | −0.208 (±0.097) | 0.956 | 41.162 | 0.109 | 23 | Triethylamine, Formamide |
| B2 | 29.804 (±0.194) | −3.196 (±0.243) | −0.242 (±0.075) | −1.042 (±0.094) | /e | 0.955 | 87.036 | 0.092 | 29 | Dichloromethane |
a Correlation coefficient.
b Fisher’s test.
c Standard error of the estimate.
d Number of solvents included in correlation.
e Negligible value with high standard error.
The negative sign of the independent coefficient c (Table 1) for all compounds suggests a bathochromic shift of the UV–Vis absorption maxima with an increase of the polarizability of the solvent. The dye molecules have a higher dipole moment in the excited state and, thus, are better solvated by the polar solvent molecules relative to the ground state. Such behavior is expected since these molecules represent typical donor–π–acceptor systems. The dipolarity term (d) is negative for B1, B2a, and B2 indicating a bathochromic shift with the increase of solvent dipolarity. For A1, this coefficient is positive and directs a hypsochromic shift with higher dipolarity of the solvent, while for A2a and A2, this term is negligible. According to Table S5, it can be concluded that the percentage contribution of the solvent’s polarizability is more significant than the dipolarity and that the most of the solvatochromism of these dyes is influenced by nonspecific solvent–solute interactions.
UV–Vis absorption spectra of A1, A2a and A2 are more affected by the solvent’s acidity, while UV–Vis maxima of B1, B2a and B2 show a markedly stronger dependence on the solvent’s basicity.
The UV–Vis maxima of the A-series dyes undergo a bathochromic shift with the increase of the solvent’s acidity as indicated by negative a coefficients (Table 1), while UV–Vis spectra of B-series dyes are unaffected by the solvent’s acidity.
The independent coefficient b refers to the specific solvation of proton donor sites of the dye molecules. It should be emphasized that the solvent’s basicity contributes to only 5% in the overall solvatochromism of A1 and A2 (Table S5, Supporting information), while for A2a is negligible. The increase of the solvent’s basicity induces bathochromic shift of UV–Vis maxima of A1, while for A2 hypsochromic shift is observed. For B1, B2a, and B2, i.e. compounds with the p-hydroxyphenyl donor moiety, the interaction of the –OH group with the proton of the solvent increases the donating ability of the –OH group, which causes the reinforcement of the push–pull system and bathochromic shift of the UV–Vis absorption maxima. Relatively large values of the coefficient indicate that HBA solvents preferentially interact with the –OH group of the p-hydroxyphenyl donor moiety.
3.4. The behavior in acidic and alkaline medium
The DFT analysis (Figure 2) showed that a wide integral area absorption band in the experimental spectrum of A2 consisted of both neutral and deprotonated tautomeric species. It is shown that the addition of acetic acid in the methanolic solution of the compound A2 had a negligible impact on the tautomeric equilibrium since this organic acid is relatively weak (Figure 5). However, by applying a few drops of a more potent, mineral acid such as HCl, a slight bathochromic shift of the absorption maximum of this compound was observed. The fading of the left shoulder of the absorption band indicated that the protonation of the anionic species presented in the parent solution occurred (Figure 5), but also the waging of the tautomeric equilibrium toward the more stable, hydrazone form. A similar situation could be observed for A1 (Figure S11a, Supporting information). However, the addition of any of the two selected acids to the methanolic solutions of the B-series compounds had no impact on the absorption spectra, which additionally confirmed the early established fact that these compounds exist as azo tautomers in the methanolic solution (Figure S12, Supporting information).
The normalized experimental UV–Vis absorption spectra of A2 in methanol after addition of the HCl and the acetic acid.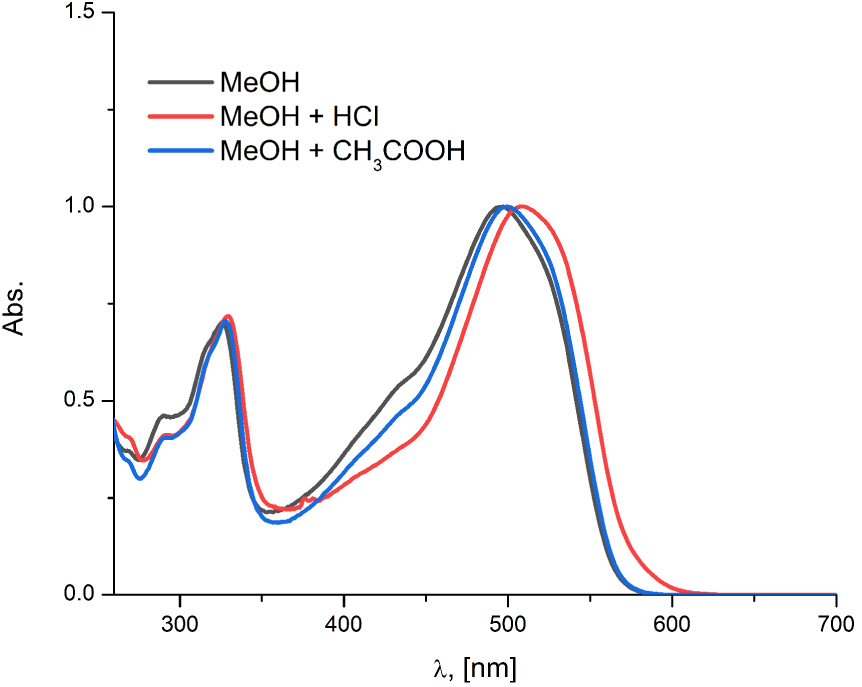
Firstly, the investigation of the alkaline medium upon the addition of NaOH on the tautomeric equilibrium in ethanol was conducted. Bearing in mind the alkaline potency of NaOH, it is assumed that the deprotonation of the neutral species took place. The experimental spectrum of A2 in ethanol upon the addition of NaOH showed a wide integral band consisting of not only the azo/hydrazone carboxylate species, but dianionic molecular forms as well (Figure 6). The absence of the azo anion form and the dominance of azo carboxylate over hydrazone carboxylate is in accordance with their calculated relative energies (Table S2, Supporting information). This observation is also supported by the good agreement of the absorption bands in the 250–400 nm region with the calculated spectra of the corresponding carboxylate and dianionic forms.
The experimental UV–Vis spectrum of A2 in ethanol upon the addition of NaOH vs. theoretical spectra of anionic forms.
In order to comprehend to what extent the deprotonation took place in A2, the existence of possible anionic forms in various alkaline media were investigated (Figure 7), namely, in two organic bases (trimethylamine and pyridine) and in two solvents (methanol and dimethylformamide (DMF)) upon the addition of NaOH. Dissolving A2 in pyridine did not have a significant impact on the deprotonation of the neutral forms. This can be ascribed to the insufficient alkaline potency of pyridine to fully deprotonate all acidic sites in the particular molecule. On the other hand, the intensities of the absorption peaks became readily distinguishable in triethylamine, which points to the deprotonation of the neutral forms, giving rise to the existence of only carboxylates. Hence, the intensification of the absorption band at approx. 490 nm indicates the elevated proportion of the hydrazone carboxylate ions with regard to the azo carboxylates. Likewise in ethanol, the solute exhibited the existence of azo/hydrazone neutral species along with corresponding carboxylate forms in both plain methanol and DMF. Furthermore, in the spectrum of A2 in methanol, upon the addition of NaOH, the dianionic form appeared along with the carboxylate species, which could be observed by the stretching of the absorption band at higher wavelengths. Also, it could be noticed that the azo–hydrazone carboxylate ratio was altered in favor of azo carboxylates. On the other hand, A2 in DMF exhibited the presence of the solely dianionic form. The concurrence of spectra in methanol and DMF at the lower wavelength region i.e. two absorption peaks around 295 and 350 nm provides additional experimental evidence of the dianionic form in methanol. The shifting progress from the neutral species in the methanolic and DMF plain solutions toward final anionic forms is depicted in Figure S13, Supporting information.
The experimental UV–Vis spectra of A2 in different alkaline media.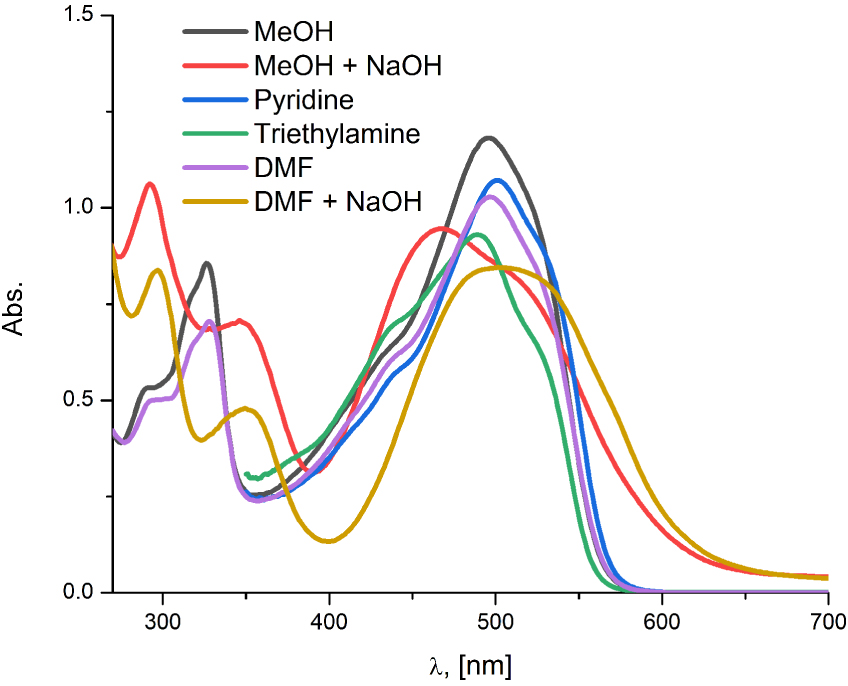
The investigation of the alkaline medium on the tautomeric equilibrium was conducted in five more solvents in order to investigate the influence of the solvent’s nature on the position and a relative ratio of anionic species. Namely, the addition of NaOH in A2 solutions of acetone, acetonitrile, and formamide, resulted in the dominance of azo carboxylate over the hydrazone carboxylate and dianion (Figure S14a, Supporting information), as evidenced in both ethanol and methanol. On the contrary, the alkali influence analysis showed that the addition of NaOH to both DMSO and dimethylacetamide (DMA) solutions of the A2 gave rise to one stretched absorption band, which is bathochromically shifted in comparison to the absorption band obtained from plain solutions, similar to the one obtained from DMF upon the addition of NaOH (Figure S14b, Supporting information). These solvents are rather aprotic, dipolar, and protophilic, and display a propensity to form hydrogen bonds with O–H and N–H bonds [16] of azo and hydrazone carboxylates, respectively. These intermolecular hydrogen bonds cause an elongation of O–H and N–H bonds and thus increase their acidity, which makes them more prone to deprotonation caused by NaOH, resulting in the dianionic form. In the other above-mentioned solvents, the deprotonation of carboxylate species is deteriorated, resulting in a decreased quantity of the dianionic form with respect to DMF, DMSO, and DMA.
The analogous trend could be observed for A1 (Figure S15, Supporting information) and similar conclusions in all investigated solvents could be made for A1 except in DMF and DMSO, where hydrazone carboxylate appears along with the dianionic form, while the absence of azo carboxylate occurs.
The compound A2a exhibited the existence of azo–hydrazone tautomerism in all plain solvents, whereby the deprotonation of both tautomers gave rise to only the azo anion form. Analogous to the azo/hydrazone carboxylates of A2, azo/hydrazone neutral species of A2a exhibited similar behavior. Namely, A2a in ethanol showed the equilibrium between neutral tautomeric forms and azo anion as theoretical simulation indicated (Figure S16, Supporting information), while in DMF the solely wide absorption band indicated that total deprotonation of neutral forms occurred (Figure 8). In general, as for the A-series, the structural factor responsible for defining the absorption spectra in the alkaline medium is the deprotonation of azo and hydrazone species (carboxylates of A2 and A1, neutral of A2a).
The experimental UV–Vis spectra of A2a after gradual addition of NaOH in DMF.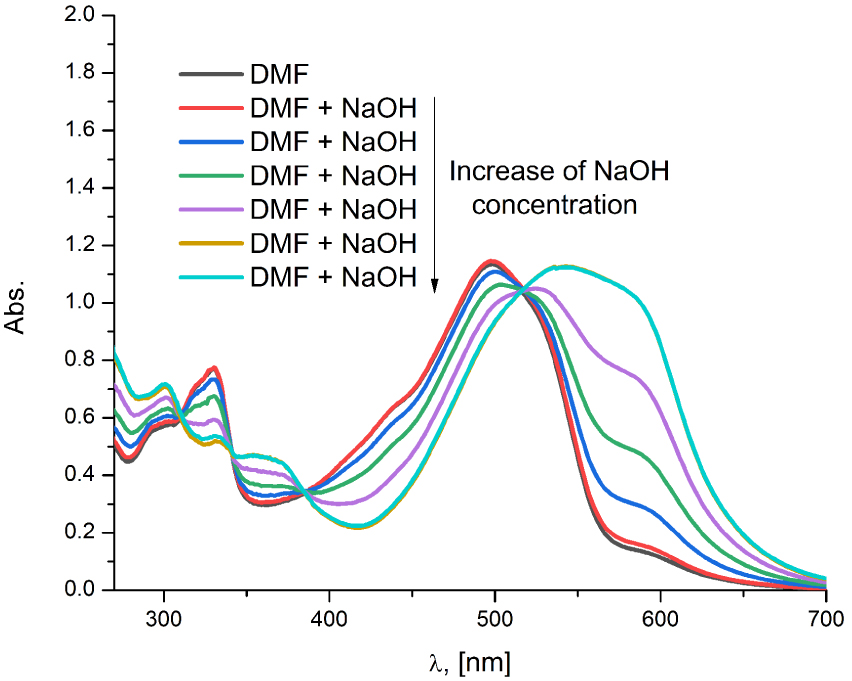
As for the B-series compounds, alkali analysis in organic bases (pyridine and trimethylamine) showed that no deprotonation occurred, with respect to the other solvents, indicating the presence of solely, neutral azo form (Figure S17, Supporting information). The addition of NaOH in plain ethanolic solution, however, gave rise to the coexistence of azo-phenolate and dianionic form of B2 (Figure S18, Supporting information). One should bear in mind that B3LYP and M06-2X methods are not in mutual conformity regarding the stability of the anionic species (Table S2, Supporting information). Namely, the theoretical calculation provided by B3LYP method showed greater stability of phenolate- over the carboxylate anion, while the calculations provided by the M06-2X method showed contradicting results. On the other hand, due to various interactions with the solvent, the stabilization i.e. destabilization of specified anionic species could occur, which may counterbalance the less stable anionic species in solution. This is merely an assumption, due to the complexity of the DFT simulation method. However, the equilibrium between azo-phenolate and dianionic species upon the addition of NaOH is slightly shifted toward the dianionic form in the methanolic solution while in ethanol the opposite effect occurs (Figure 9a). Upon the addition of NaOH in DMF, DMSO and DMA (not presented), total deprotonation took place leading to only the dianionic form (Figure 9b). Likewise, B1 exhibited similar behavior to B2 upon the addition of NaOH in the mentioned solutions. For this reason, results are omitted.
The experimental UV–Vis spectra displaying the influence of the alkaline medium (NaOH) on the compound B2 (a) in the selected solvents and (b) DMF.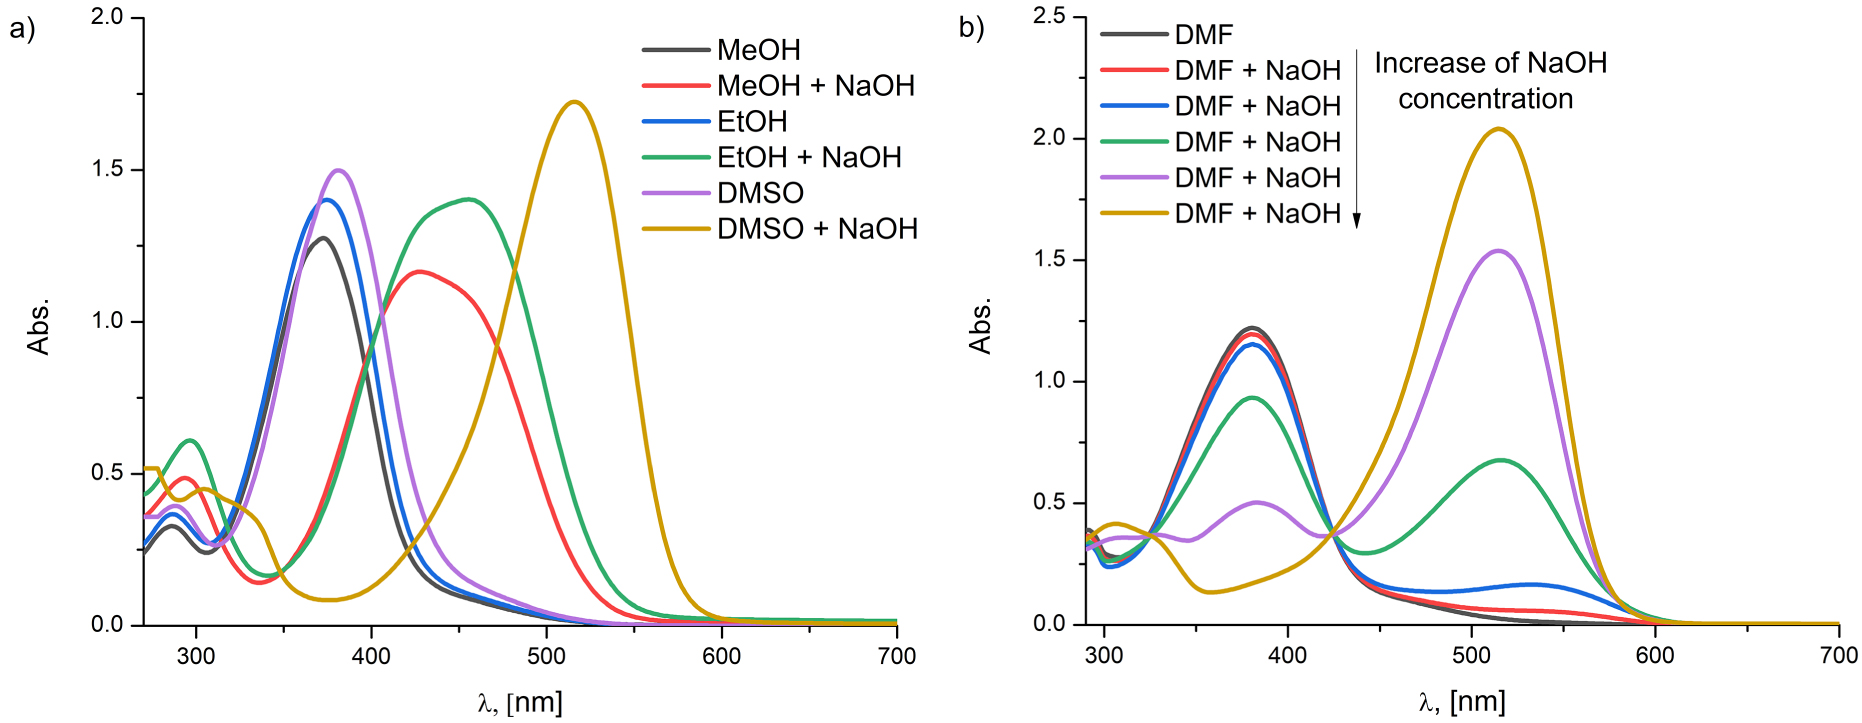
The resemblance in the appearance of the B2a and B2 absorption bands in selected solvents, upon the addition of NaOH, might indicate that hydrolysis took place in the solutions of the B2a compound since the sodium hydroxide is potent enough to catalyze the ester hydrolysis. Therefore, the analysis of the possible anionic forms is not conducted.
Based on the statements above, it can be observed that the extent of the deprotonation of the investigated compounds is highly affected by the nature of the solvent and its capability to solvate the neutral and anionic forms of dye molecules through specific and nonspecific interactions. In general, it can be concluded that the total deprotonation is facilitated by the aprotic dipolar protophilic solvents (DMSO, DMF and DMA), leading to only one anionic form.
4. Conclusion
In this paper, a comprehensive solvatochromic inquest was conducted upon six azo dye molecules derived from benzoic- and cinnamic acid. The experimental results supported by theoretical calculations showed that naphthalene-2-ol based compounds (A series) exhibit azo–hydrazone tautomerism in all solvents, whereas for benzoic- and cinnamic acid-based compounds (A1 and A2), deprotonation of the carboxylic group occurs leading to a complex system of neutral forms along with corresponding carboxylates. As for the B-series, all compounds adopt the azo tautomeric form in ethanol. The same behavior was observed in other investigated solvents.
The LSER analysis revealed that the strongest influence on the solvatochromic behavior of all dyes is exerted through nonspecific interactions, mainly by the solvent’s polarizability. Specific interactions play a minor role in the overall solvatochromism of these dyes.
The addition of hydrochloric acid in the methanolic solution of the A-series azo dyes confirmed the coexistence of the azo/hydrazone carboxylate species with the neutral molecules in the plain solution, while in the case of the B-series compounds no change occurred, verifying the fact that these compounds exist only as azo tautomers. The alkaline analysis in different media for A2 showed the existence of carboxylate species in triethylamine i.e. that the deprotonation of neutral azo/hydrazone tautomers took place. While the probes in methanol, ethanol, acetone, acetonitrile and formamide upon the addition of NaOH yielded the coexistence of carboxylates and dianionic forms with the predominance of azo carboxylate, spectra in aprotic dipolar DMF, DMSO, and DMA displayed the existence of solely dianionic forms. The analogous behavior is observed for A2a, whereby neutral- and dianonic forms of A2a correspond to carboxylates and azo anion species of A2, respectively, leading to a conclusion that the azo/hydrazone backbone of these molecules plays a major role in defining the anionic species in alkaline solutions. On the other hand, the addition of NaOH to the methanolic and ethanolic solutions of B2 lead to the presence of both dianionic and azo-phenolate species, while in DMSO, DMF and DMA only dianionic form appears. Both A1 and B1 exhibited the same behavior as their cinnamic analogues. It can be noted that the quantity and existence of deprotonated forms depended on the interplay of interactions of the individual solute with solvent molecules. In general, it can be concluded that the total deprotonation is facilitated by the aprotic dipolar protophilic solvents (DMSO, DMF and DMA), leading to only one anionic form.