

 CC-BY 4.0
1. Introduction
The aerobic part of the metabolism of living organisms involves the essential process known as oxidation, which consists of the transfer of electrons in the presence of oxygen. As a result, energy is produced in the form of adenosine triphosphate [1]. In this process, free radicals, known as reactive oxygen species, are generated. Such species are involved in the so-called oxidative stress, initiating oxidative modification of lipids, carbohydrates, proteins, DNA, and so on. Oxidative stress has been implicated in the development of many diseases [2, 3]. It forms part of a redox imbalance depending on the amount of antioxidants present in an organism. Therefore, it is very important to evaluate the antioxidant capacity (AOC) of chemicals, especially those that are components of food. Several AOC measurement methods have been designed based on two fundamental types of reactions: hydrogen atom transfer (HAT) and single electron transfer (SET). The SET methods involve the redox reactions of an antioxidant, while most HAT methods consist in monitoring the competitive kinetics between an easily oxidizing synthetic radical generator and an antioxidant. In most cases, the results obtained by the different methods are difficult to compare with each other, which prevents the determination of the “real” AOC. In addition, most of these methods are not performed under physiological conditions such as aqueous media, high ionic strength, and neutral pH values.
The cupric reducing antioxidant capacity (CUPRAC) assay [4] is conceptually similar to the ferric reducing antioxidant power test. This assay is based on the reduction of Cu(II) to Cu(I) in the presence of the Cu(I)-stabilizing ligand neocuproine (2,9-dimethyl-1,10-phenanthroline). The kinetics of this assay are relatively fast [4, 5] (the incubation time is typically 1 h). Moreover, the AOC is related to the absorbance measured at 450 nm, which is proportional to the amount of complex formed between Cu(I) and neocuproine at incubation time. The results are expressed in Trolox equivalents, based on a calibration curve constructed using this compound. This has also been applied to matrices that contain hydrophilic and lipophilic antioxidants [6]. Several modified spectroscopic CUPRAC methods have been described [7, 8].
In general, antioxidants act as reducing agents in solution; they are easily oxidized on the surface of an electrode. Based on this, electrochemical methods have been proposed such as those based on the oxidation of hydrogen peroxide on mercury electrodes [9, 10, 11]. These measurements are carried out under non-physiological conditions. Carbon electrodes modified with conducting phenazine polymers and metal nanoparticles were also proposed [12, 13, 14].
The main limitation of most non-electrochemical assays arises when the samples or the reaction product (or both) is coloured or when the reaction product tends to precipitate, thereby increasing sample turbidity. These situations result in errors by excess or defect depending on the samples. Moreover, the relatively high incubation time prevents the determination of AOC for unstable compounds. Another limitation is due to the non-physiological conditions used. For CUPRAC, the working pH is approximately 5.5 and a large amount of non-aqueous solvent (ethanol) is needed to dissolve neocuproine.
Recently, electrochemical alternatives have been proposed to measure the concentration of Cu(I)–neocuproine complex formed after the incubation time: differential pulse voltammetry (DPV) [15] and cyclic voltammetry combined with chronoamperometry [16, 17]. In both cases, glassy carbon electrodes were used. The sensitivity of electrochemical detection in the CUPRAC method was shown to be comparable to that in the classical spectrophotometric method, but all experimental conditions (pH = 5.5, non-aqueous solvent, low ionic strength of approximately 0.06 for CUPRAC, and typically 1 h of incubation time) remained the same.
Using an electrode to replace neocuproine as an indicator can overcome all these limitations. In this case, the colour of the samples is irrelevant, the pH can be fixed at virtually any desired value (provided that there is no precipitation of Cu+ or Cu2+ salts), and an aqueous medium of high ionic strength can be used. The ionic strength of blood plasma is approximately 0.3 M or five times greater than that used in CUPRAC and much greater than that corresponding to activity versus 2,2 diphenyl 1 picrylhydrazyl radical (DPPH). Very slight turbidity, which can cause scattering and, consequently, errors in spectrophotometric measurements, does not affect electrochemical measurements or the error obtained is much lower. In addition, antioxidant–probe reactions occur in the diffusion layer near the electrode surface. These reactions are much faster than the same reactions in the bulk solution.
The aim of this paper is first to establish whether known antioxidants react with the intermediates produced in the reduction of Cu(II) and second to establish the optimal conditions to relate such an interaction with AOC.
2. Experimental section
2.1. Materials
CuCl2, gallic acid, ascorbic acid, neocuproine, and Trolox were procured from Sigma-Aldrich and the rest of the reactants were purchased from Merck. All chemicals were used without further purification, and all of them were at least of analytical quality.
2.2. Electrochemical measurements
A CHI650A electrochemical workstation from IJ Cambria was used for electrochemical measurements. A 15 mL thermostated glass cell was used. The electrodes were one glassy carbon electrode from IJ Cambria (area = 7.5 mm2); one reference electrode from Metrohm, 6.0733.100 Ag|AgCl|KCl (3 m); and a platinum rod used as an auxiliary electrode. All the solutions were purged using purified nitrogen for at least 10 min to remove the oxygen that could produce undesired redox reactions on the electrode.
For electrode conditioning, before each experiment, the glassy carbon electrode was polished with alumina (0.3 and 0.05 mm) slurries. Polishing residues were removed from the electrode surface by sonicating it in a water bath for 15 min.
A buffer solution of 0.1 M CH3COONH4 with pH 5.5 was used as the supporting electrolyte. It was prepared using ultrapure water type I (resistivity 18.2 MV⋅cm at 298 K) obtained from a Millipore Milli-Q system. The ionic strength was fixed at 0.5 M using solid KNO3.
2.3. Spectrophotometric antioxidant capacity assays
2.3.1. DPPH radical scavenging assay
The action of an antioxidant causes a decreases the intensity of the UV–visible absorption band of DPPH∙, whose maximum wavelength is 515–518 nm. The AOC measures the inverse of the “efficient concentration” EC50, that is the amount of antioxidant that decreases the concentration of the radical to 50% of the initial concentration.
Different concentrations of antioxidants were added to 5 × 10⁻⁵ M DPPH∙ methanolic solutions and were incubated at 25 °C for 90 min. The remaining DPPH∙ concentration was calculated from the absorbance measured at 517 nm.
2.3.2. CUPRAC assay
To 1.0 mL of a 1 M ammonium acetate buffer solution with pH 5.5 were added 1 mL of 0.01 M CuCl2 water solution, 1.0 mL of 7.5 × 10⁻³ M neocuproine ethanolic solution, and variable volumes of extracts; the volume was completed to 4.1 mL with water. Calibration curves were constructed by using variable volumes of 2.5 × 10⁻⁴ M stock solutions of Trolox in ethanol. The samples were incubated in darkness for 60 min at 25 °C, and the absorbance was measured at 450 nm. The zero-concentration absorbance was subtracted. The AOCs were expressed in Trolox equivalents.
Ultraviolet measurements were carried out at room temperature on a double-beam PerkinElmer Lambda 750S spectrophotometer with Hanna quartz cuvettes of 1 cm path length.
3. Results and discussion
First, electrochemical cleaning was performed after mechanical cleaning of the working electrode, which is described in Section 2. For this, cyclic voltammetry was performed from +1.1 to −1.1 V for three cycles at 0.1 V⋅s−1, verifying that the electrode surface was completely clean. Subsequently, a cyclic voltammogram was recorded from +1.0 to −1.0 V at the same scan rate to monitor the signals from the reduction and oxidation peaks of the Cu(II)–Cu(I)–Cu(0) system.
As can be seen in Figure 1, the direct scan shows two peaks, A and B, corresponding to the reduction processes Cu(II) → Cu(I) and Cu(I) → Cu(0), respectively. The peak C appearing in the reverse scan corresponds to the oxidation of the Cu(0) deposited on the electrode surface.
Cyclic voltammogram of 2.26 mM CuCl2 solution in buffer NH4Ac at pH = 5.5, V = 0.1 V⋅s−1. The arrow indicates the initial potential and direction of scan.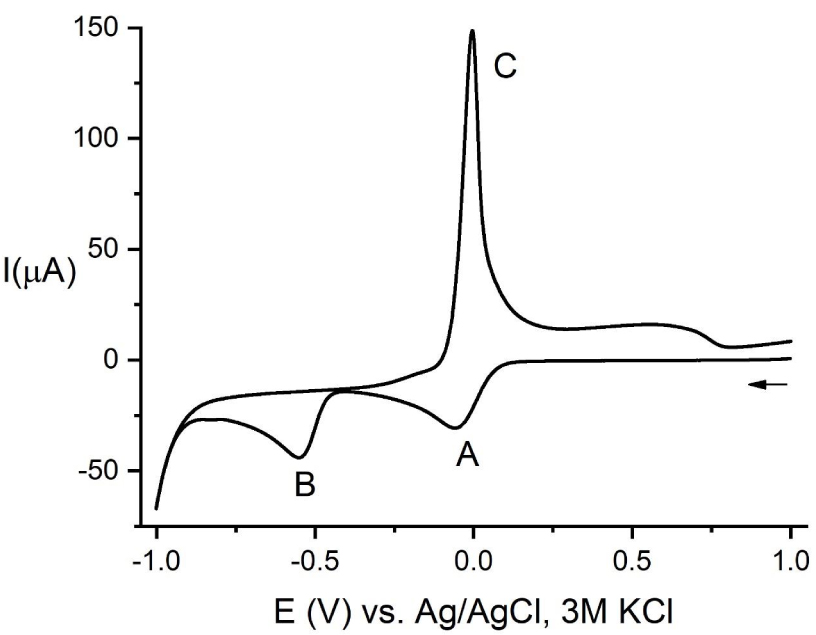
At potentials corresponding to the A peak, the process is the same as that used in the CUPRAC methodology; for this reason, this signal was chosen for testing the modified electrochemical method. The first assays prepared by adding antioxidants do not give conclusive results because the effect of the antioxidants on the reduction signals was poor. This was attributed to the high Cu(II) concentration used.
The characteristics of the process occurring at the potentials of the A peak were studied by linear-sweep voltammetry (LSV) and DPV at a concentration of 0.1 mM (see Figures S1–S4 in the Supplementary Information). The results correspond to a typical one-electron process complicated by adsorption processes taking place on the electrode surface at high values of scan rates (LSV) and pulse amplitude (DPV). The values 0.1 V⋅s−1 and 0.025 V were set as the optimal scan rate and the pulse amplitude for LSV and DPV, respectively.
The linear-sweep voltammograms obtained were not completely reproducible. It was observed that when the electrode surface was not cleaned after each measurement, the intensity of the voltammogram decreases as the different measurements were conducted (Figure S5). When mechanical cleaning was carried out between the measurements by using alumina B, better reproducibility was achieved although the reduction peaks were not completely reproducible (Figure S6). To evaluate the reproducibility, it was found convenient to use the technique of DPV, which is more sensitive. Some results are shown in Figure S7.
To obtain good reproducibility, the electrode was polished by diamond paste and the two types of alumina. Then it was electrochemically cleaned by using a range of potentials from +1.5 V to −1.2 V. This cleaning was carried out before each measurement. The results so obtained were more reproducible than those observed for LSV, but a variation of 5%–7% was found in the recordings.
Square-wave voltammograms: pulse step 2 mV, amplitude 20 mV, and frequency 25 Hz. Numbers correspond to the successive cleaning of the electrode. Six to fourteen experiments were reproducible and were carried out under conditions given in the text. The arrow indicates the initial potential and the scan direction.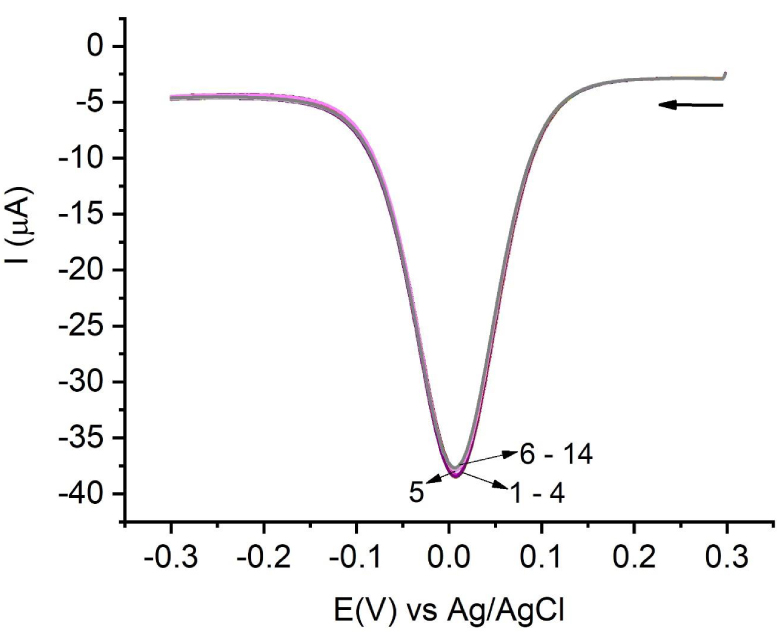
Square-wave voltammograms at different ethanol contents. The arrow indicates the initial potential and the scan direction.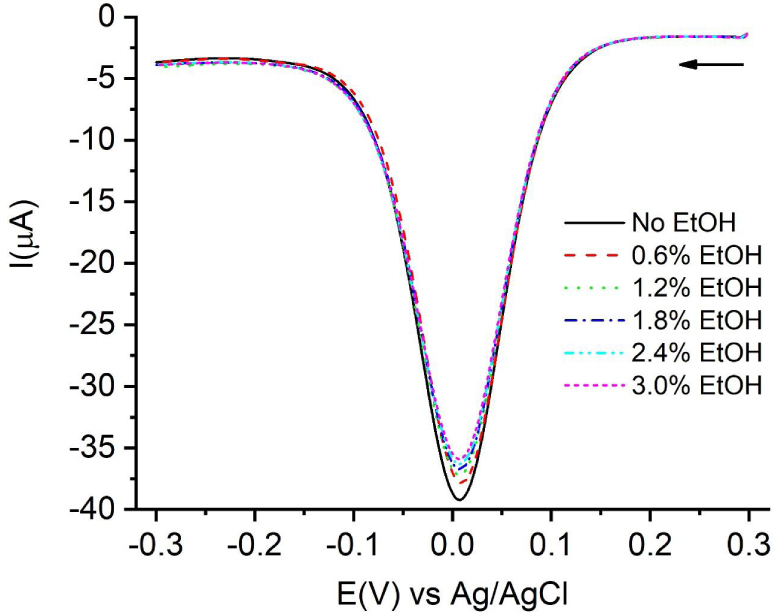
Square-wave voltammograms of 0.01 M gallic acid solutions after incubation for 1 h. The quantities are the volumes of gallic acid in 8 mL of sample incubation solution. The final volume in the cell is 50 mL. (A) Direct-scan SWV and (B) reverse-scan SWV. Arrows indicate the initial potentials and the scan directions.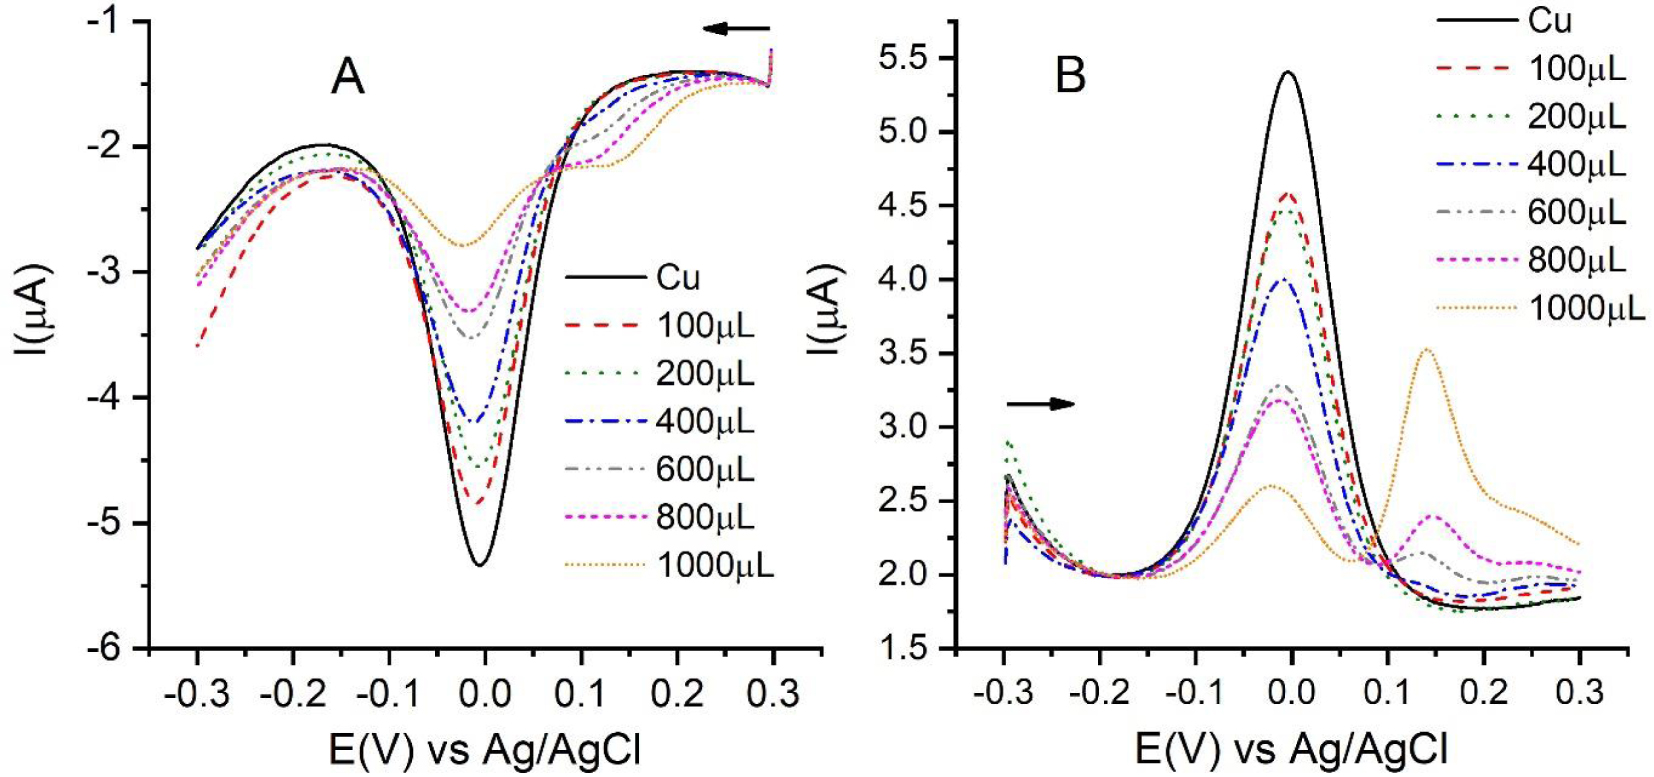
Once this level of reproducibility was reached, it was decided to use the square-wave voltammetry (SWV) technique, which provides peaks of greater intensity and hence is more sensitive to any change. The aim of using this method was to establish a procedure to ensure that the signal was as reproducible as possible. Several parameters of the technique, such as the potential window from +0.3 to −0.3 V, the step potential 2 mV, the pulse amplitude 20 mV, and the pulse frequency 25 Hz, were optimized. It was possible to eliminate the electrochemical cleaning phase, and it was decided to carry out mechanical cleaning using alumina B before each measurement. Under these conditions, it was verified that the obtained signal was reproducible and constant as can be seen in Figures 2 and S8. From the studies on the optimal CuCl2 concentration, a value of 1 × 10⁻³ M was set for this parameter.
A variety of antioxidants, including Trolox, must be solubilized in ethanol. For this reason, the effect of the presence of this solvent in the medium must be considered as in other electrochemical methods for the determination of AOC [18]. As can be seen in Figure 3, the reduction signal of Cu(II) decreases approximately 3% for each 1% extra EtOH added to the medium. This effect must be considered and corrected when ethanol contents higher than 0.2% are used.
The above conditions were used to study the effect of the addition of an antioxidant. Figure 4A shows the decrease in the peak current of the square-wave voltammogram of Cu(II) caused by the addition of increasing concentrations of gallic acid. The experiment was conducted under the same conditions as those of CUPRAC. That is, the samples were prepared using 5.5 mL of 1 M NH4Ac with pH 5.5, 0.5 mL of 10 mM CuCl2, and variable volumes of 10 mM gallic acid (ranging from 100 to 1000 μL) and completing the volume to 8 mL with water. These samples were incubated for 1 h and then diluted to 50 mL with a buffer solution of NH4Ac with pH 5.5.
As can be seen, at the initial potentials of the scan, the voltammograms show a signal that increases in intensity as the gallic acid concentration is increased. This peak is due to the reduction in gallic acid, whose voltammogram has a peak potential of approximately 0.2 V at the measured pH [18]. This has been confirmed experimentally and is shown in Figure S9. The reduction potential of Trolox is even lower; its differential pulse voltammogram has a peak potential close to 0.15 V. For this reason, the interference in the case of Trolox is expected to be more significant. This additional peak interferes with the measurement because the interaction with Cu(I) ions, which is the subject of the determination, is complicated by the gallic acid reduction that takes place at the more positive potentials. To prevent this situation, the scan was run from −0.3 V to +0.3 V, that is reverse SWV was used. In this case, as the applied potential changes, the reduction signal of gallic acid is significant only at potentials clearly higher than the peak potential of the Cu(II) signal as can be seen in Figure 4B. Therefore, the measured peak intensities are not modified by the oxidation process of the antioxidant, and more reliable values are obtained.
The same interference was observed on the direct-scan square-wave voltammograms when ascorbic acid was investigated. Figure 5 shows the reverse square-wave voltammograms corresponding to the addition of increasing quantities of ascorbic acid. As can be seen, when the ascorbic acid concentration increases, the signal decreases in the same manner as in the case of gallic acid.
Reverse-scan square-wave voltammograms of 0.01 M ascorbic acid solutions after incubation for 1 h. The quantities are the volumes of ascorbic acid in 8 mL of sample incubation solution. The final volume in the cell is 50 mL. The arrow indicates the initial potential and the scan direction.
From the above data, the relative AOCs of gallic and ascorbic acids can be obtained by plotting the percentage of decrease in the peak current versus the added concentration of the antioxidant. This is shown in Figure 6.
Percentage of decrease in peak currents vs. concentration of the antioxidant added.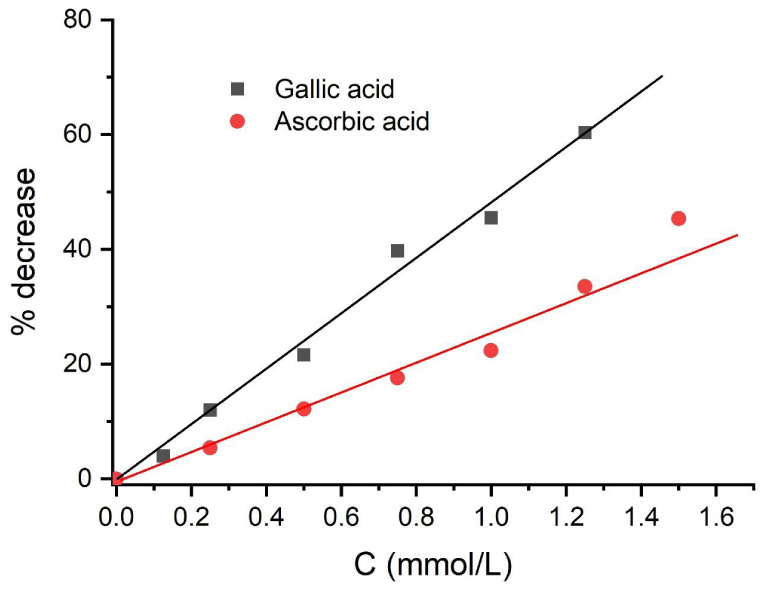
The ratio between the concentrations of antioxidants that lead to a given percentage of decrease (usually, 10%) is equal to the ratio of the AOCs [10, 12, 18, 19, 20]. The ratio between the AOCs of gallic acid and ascorbic acid obtained from the variations shown in Figure 6 is 1.9. The AOCs obtained from CUPRAC measurements, as described in Section 2, are 3.0 for gallic acid and 1.6 for ascorbic acid, both in Trolox equivalents. Moreover, the respective AOCs obtained from DPPH measurements are 2.0 and 1.1, respectively. Therefore, the relative AOCs of gallic and ascorbic acids obtained by these measurements are 1.9 (CUPRAC) and 1.8 (DPPH), respectively. The values obtained by reverse SWV are in good agreement with these values.
4. Conclusions
The method presented in this paper is able to measure AOCs in the same way as “classical” spectrophotometric methods do. The main advantages of the electrochemical measurements are as follows: (i) the measurements are not affected by excess or defect due to the colour of the samples or the product of the reaction (or both); (ii) measurements are carried out under near-physiological conditions (high ionic strength and absence of non-aqueous solvent).