

1 Introduction
Understanding plastic deformation and mechanical properties of oxides and metals under extreme pressures is essential for modelling the dynamics of convection that generate plate tectonics, volcanism, and magnetic fields on Earth and telluric bodies in solar and extrasolar systems. The formation and the mobility of point and linear defects at the origin of plastic deformation in those solids at high pressure are currently studied with state-of-the-art first-principles and atomistic simulations (Cordier et al., 2012; Kraych et al., 2016) that require validation or anchoring on experimental data (Merkel et al., 2002, 2003, 2007), in comparison with mesoscale models (Amodeo et al., 2016; Lin et al., 2017). Static pressures in the Earth reach more than 300 GPa, and can only be reproduced experimentally using diamond anvil cells (DAC) with very small samples. Plastic deformation under high stresses also occur in mechanical devices with parts moving at high speeds (e.g., boundary condition lubrication) or for materials submitted to impacts. Thus far, most information on high-pressure plastic deformation mechanisms and yield strengths of oxides, silicates and metals have been obtained from X-ray diffraction techniques on synchrotrons owing to the small sample volumes in the diamond cell (Dorfman et al., 2015; Gleason and Mao, 2013; Merkel et al., 2002, 2003; Miyagi et al., 2006; Shieh et al., 2002; Singh et al., 2008). Some of these X-ray based determinations of strength are in contradiction with estimates based on simple analysis of stress field and pressure gradient in the DAC (Meade and Jeanloz, 1988a, 1988b).
We investigate here the application of Raman spectroscopy for in-situ piezometry in the DAC on simple ionic compounds. The Raman spectra of crystalline materials are sensitive to applied stress and vibrational mode frequency variations can be calibrated to estimate hydrostatic pressure (Goncharov et al., 1985; Hanfland et al., 1985). For determining yield strength of materials at high pressure, it is necessary to measure both hydrostatic pressure and deviatoric stress. Deviatoric stresses are known to lift the degeneracy of Raman peaks belonging to specific symmetry species in high-symmetry crystals (Cerdeira et al., 1972; Grimsditch et al., 1978). This is especially true in piezoeletric non-centrosymmetric crystals such as quartz where splitting occurs both due to symmetry breaking and to coupling of longitudinal modes of vibrations with the electrical field imposed by the deviatoric stress (Grimsditch et al., 1977; Tekippe et al., 1973). We therefore chose quartz to test the method on a series of simple ionic solids with either the B1 rock salt structure (NaCl, MgO) or its high-pressure modification, the B2 (α-CsCl) structure (KCl, KBr). For that purpose, we combined experimental measurements and first-principles calculations of Raman spectra. We discuss the reliability of stress analysis using different methods, Raman piezospectroscopy, radial X-ray diffraction, and measurements of pressure gradients.
2 Methods
2.1 DFT calculations of Raman spectra
We obtained the stress effect on the vibrational frequencies of quartz from first-principles calculations with the density functional theory (DFT) in the ABINIT implementation (Gonze et al., 2002, 2005), which is based on plane waves and pseudopotentials. We employed regular high-symmetry 6 × 6 × 6 grids of special k-points (Monkhorst and Pack, 1976) and a 34 Ha (1 Ha = 27.2116 eV) cutoff for the kinetic energy of the plane waves. Previous simulations (Caracas and Bobocioiu, 2011) showed that these parameters ensure accuracy in energy on the order of 1 mHa per unit cell and a pressure error bar on the order of a few hundred MPa. In the pseudo-potential approach, the core electrons are replaced by pseudopotentials while the outer electrons are treated explicitly. The considered valence electrons are 2s22p2 and 2s22p4, respectively, for Si and O (Fuchs and Scheffler, 1999).
First, we relax the quartz structure at in the 0–20 GPa pressure range in 2.5 GPa steps, i.e. we allow the atoms to move under the action of the interatomic forces until they disappear, and the values of both a and c lattice parameters to change to yield purely hydrostatic pressures of the desired values. Then on each of these relaxed structures, we apply both positive and negative uniaxial and shear stresses of 1%, 2%, and 5%. In these simulations, we allow only the atoms to relax, while keeping the strained cell shape fixed. Eventually on the resulting strained structures, we compute the frequencies, the atomic displacement pattern, and the Raman tensors of the normal modes in the center of the Brillouin Zone. For this task, we use the density functional perturbation theory in the ABINIT implementation (Baroni et al., 2001; Gonze, 1997; Gonze and Lee, 1997; Gonze et al., 2005). As the computation of the Raman tensors is limited to the Local Density Approximation (LDA) for the exchange correlation term, we chose to keep LDA for all the simulations.
2.2 High-pressure Raman experiments
Raman spectra were collected with LabRam HR confocal systems described elsewhere (Auzende et al., 2004; Zhang et al., 2013). Of specific relevance to this study, the spot size was less than 2 microns and optical depths less than 10 microns, which allowed us to check for vertical gradients in the less compressed samples, but not at the highest pressures, for which thickness is around 20 microns.
All samples were reagent-grade commercial powders. Quartz powder with small grain size (0.5–2 μm) was prepared by annealing a reagent-grade powder at 870 °C for 24 h in the β-quartz stability field, then at 550 °C for 72 h to ensure full conversion to the piezoeletric α-quartz structure. Full conversion and absence of measurable stress on the crystals was checked by Raman spectroscopy. Anatase (TiO2) is a minor impurity in the powder with a strong Raman band at 144 cm−1 in the region of interest, but a negligible proportion (< 2%) of Raman spectra display contamination by anatase.
High-pressure experiments were carried out in Mao–Bell- and Almax–Boehler-type DAC equipped with 500–600-μm culet low-fluorescence diamonds. The samples consisted of fine-grained powders of salts (0.5–10 μm) or MgO (0.5–2 μm) mixed with about 10% of quartz. Mixtures were dried overnight at 120 °C before loading the cells. With this mixing ratio, salts and MgO served as pressure medium to quartz, and were loaded either as loose powder that was compressed directly by the diamonds or as pellets of precompressed material. The samples were loaded in a stainless-steel gasket in which a 250-μm hole was drilled. Experiments with smaller (150 μm) and larger gasket holes were performed on NaCl. Experiments with pre-pressed pellets (1 to 4 GPa precompression) were performed on MgO. Deviatoric stresses obtained from the runs with different gasket hole diameters differ at low pressure (< 5–7 GPa) and converge at higher pressure. An additional experiment was performed up to 20 GPa to calibrate the pressure dependence of the quartz Raman spectrum in a methanol–ethanol–water 16:4:1 mixture (MEW) that remains liquid up to 11 GPa.
Because of the cylindrical symmetry of the experiment, the stress on the sample is described as:
| (1) |
To map the pressure and deviatoric stress fields, the sample was mapped at intervals ranging from 10 to 20 μm, yielding a few tens to a few hundred usable data points, depending on pressure. Note that the pressure medium becomes more transparent at higher pressures, thus increasing spectral quality. Also, note that, because of the small grain size, the transparency of the pressure medium, the spot size of about 2 μm, and the depth of field of a few microns, it is possible that a few grains of quartz contribute to the Raman signal on each measurement spot.
3 Results
3.1 Raman piezospectroscopy of quartz at high pressure
Non-hydrostatic stresses affect Raman mode frequencies by causing distortions and decreasing the symmetry of the unit cell depending on both the magnitude and the orientation of stresses with respect to the crystallographic axes. In piezoelectric crystals such as quartz, Raman modes belonging to E symmetry species have transverse optic (TO) and longitudinal optic (LO) component whose splitting is affected by non-hydrostatic stresses both because of symmetry reduction and because of the electric field caused by the permanent elastic deformation (Tekippe et al., 1973). Among the E modes of quartz, the lowest frequency one (128 cm−1 at ambient conditions) has negligible splitting when the crystal is unstressed and is split under the application of a stress or electric field. Splitting of the 128 cm−1 mode components occurs due to deviatoric stresses (σ) applied normal to the c-axis and shear stresses along it according to:
| (2) |
The values of c’ and d’ were experimentally determined at uniaxial stresses up to 0.8 GPa, 77 K, and 295 K (Briggs and Ramdas, 1977; Tekippe et al., 1973). For applications at higher pressures, the vibrational frequencies of the strained crystals were calculated using DFT up to 20 GPa. The value of c’ is obtained by straining the unit cell along a in the basal plane and d’ by applying a shear strain ɛxz. At ambient pressure, the values of c’ and d’ obtained from DFT of 2.5 and–0.6 cm−1/GPa are in good agreement with the experimental values of 2.2 and–0.6 cm−1/GPa, respectively, when only linear variations of 1–2% in strain or about 1–2 GPa in stress are considered. At high pressure, c’ varies in a complex manner and d’ is constant within error bars (Fig. 1). Since values of d’ are low, the overall contribution of this term to the actual value of the splitting can be neglected, and calculations of d’ where not extended to the full pressure/strain range. On the opposite, c’ varies with pressure, and additional calculations with 5% of strain along a show that it varies with stress. Thus uniaxial ɛxx strains along a of 1, 2 and 5% yield TO–LO splitting and stresses in the range 1–1.5, 2–3, and 5–8 GPa, respectively, which were fitted with the expression:
| (3) |
| (4) |
| (5) |
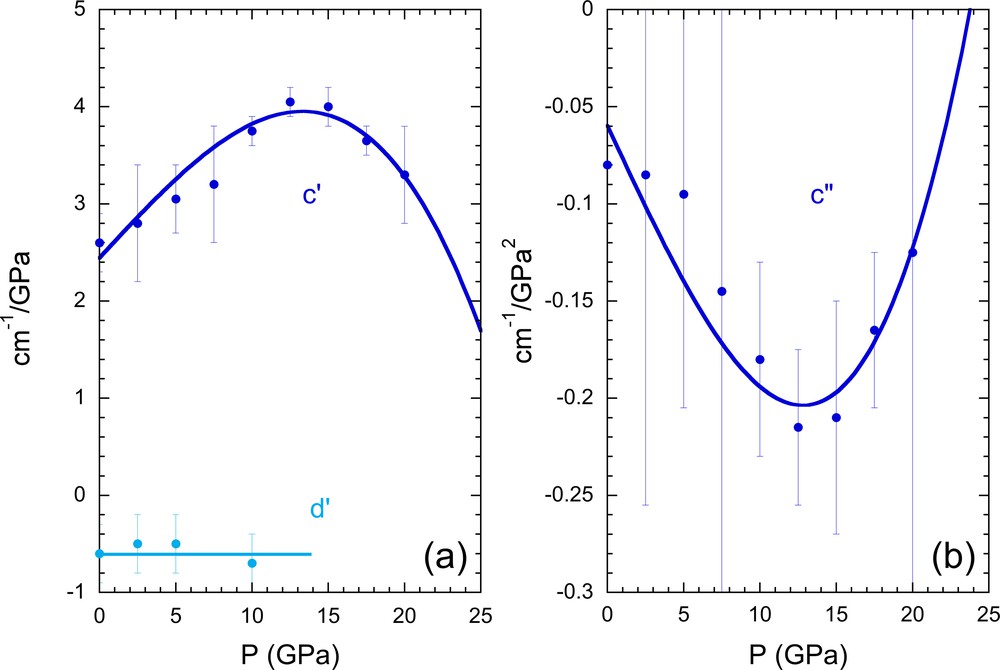
Pressure dependence of the constants relating the TO–LO splitting of the lowest frequency E mode of the quartz to the applied stress. Ambient-pressure measurements of c’ gave a value of 2.2 cm−1/GPa, and of d’ of 0.6 cm−1/GPa (Grimsditch et al., 1977; Tekippe et al., 1973). (a) Absolute values of the constants increase up to 15 GPa before rapidly dropping, possibly in relation to instabilities and phase transformations preceding amorphization in the 21–26 GPa range (Kingma et al., 1993a). (b) The second derivative c” obtained from DFT shows a non-linear dependence on stress and strain that was not explored experimentally due to the limited pressure range (< 0.8 GPa).
The uncertainty on individual deviatoric stress measurements is estimated as 20%, mostly due to peak broadening at high stresses. Measurements on several hundreds of spots at high pressure show a standard deviation of less than 10%, a proxy to the global uncertainty (Fig. 2). Uncertainties in pressure increase with pressure and deviatoric stress because of peak broadening, and are estimated as 10%. Peak broadening is attributed to stress gradients in the individual quartz crystals that cannot be further accounted for, and are not dealt with in the present piezospectroscopic analysis.
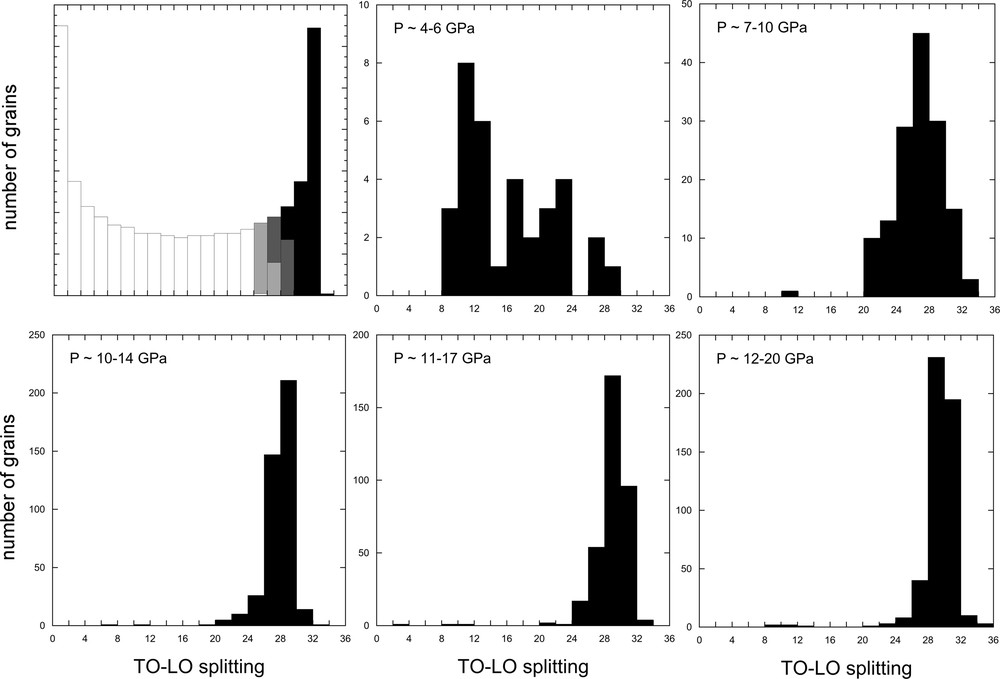
Theoretical TO–LO splitting distribution in randomly oriented quartz grains (upper left) and experimentally measured distributions on quartz grains in MgO at several values of the pressure. Top left: normalized theoretical distribution of TO–LO splitting or stresses for a randomly oriented grain population. Grains with c-axis at angles higher than 60, 65 and 70° of the compression axis are shown with light gray, dark gray, and black bars, respectively. Bottom: TO–LO splitting distributions at pressures above 10 GPa are very narrow, indicating mostly grains with c-axis at a high angle of the compression axis, contribute to the signal, and the applied differential stress field is homogeneous. At lower pressure and compression (upper panel), the TO–LO splitting distribution and stress field are heterogeneous, but the maximum stresses are already close to those at the highest pressure and compression values.
Pressure was estimated from the position of the strong A1 mode at 464 cm−1 at ambient conditions, because DFT calculations show that its position depends mostly on hydrostatic pressure (σP), and is negligibly affected by the deviatoric stress. A least-square fit to experimental values in MEW pressure medium up to about 20 GPa gives:
| (6) |
Maps of the strong A1 mode position, i.e. pressure distribution, as well as typical Raman spectra at the center and rim of the diamond culet illustrate the distribution of pressure and stress in an experiment with a MgO pressure medium (Fig. 3). At low pressure (at ≈ 5 GPa), pressure is homogenous. At higher pressures, pressure is maximum at the center of the gasket hole and decreases strongly but smoothly towards the edges of the hole. The deviatoric stress shows the opposite behavior, it is very heterogeneous at low central pressure, i.e. low compaction near P ≈ 5 GPa, and becomes very homogeneous at high pressure or higher compaction, above 10–15 GPa (Fig. 2).
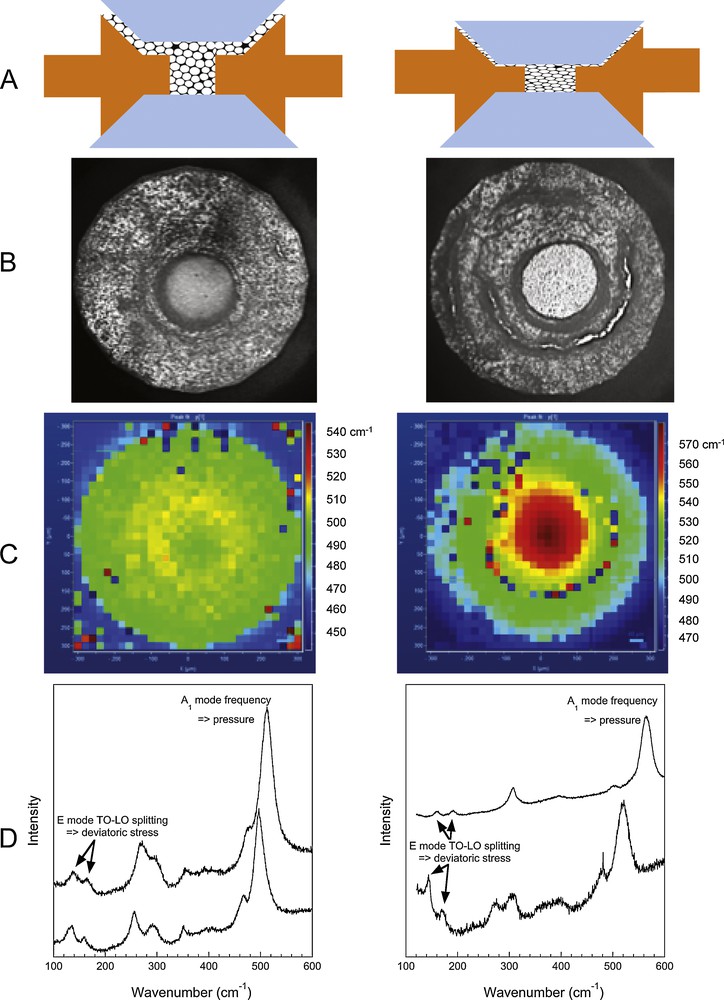
Left, low-pressure low-compaction stage of the DAC experiment (∼ 4–6 GPa). Right, high-pressure high-compaction stage (∼ 8–17 GPa). A. Cross section scheme of the DAC with diamonds in blue, gasket in orange, and sample powder. B. Top view micrograph, diamond culet size is 600 microns. Compaction of the sample is illustrated by its higher transparency in the gasket hole near the center on the right than on the left-hand-side micrograph. C. Pressure distribution image (600 × 600 microns, step 20 microns) obtained from the A1 peak position; the pressure is fairly homogeneous on the right and shows a strong gradient on the left. D. Typical Raman spectra illustrating pressure and deviatoric stress measurement.
Because we use a population of quartz grains, a random orientation with respect to the applied stress field in the DAC results in stresses along the a-axis ranging from a maximum value of σxx–σyy = t when the c-axis is perpendicular to the compression axis to zero when it is parallel to it. At the same time, the relative intensity of the LO mode varies from the maximum to zero in the vertical polarization geometry used here, resulting in higher signal from grains with orientations such that both the TO–LO splitting and LO intensity are maximum. This is confirmed by statistics of TO–LO measurements (Fig. 2). At high pressures, the measured stress distribution is very peaked when compared with the theoretical distribution with randomly oriented quartz grains. This suggest that only grains with an angle between the c-axis and the compression axis higher than 60 or even 70° contribute to the stress measurements. For that population of quartz grains, the stress measurement given by TO–LO splitting is close to the macroscopic stress field imposed by the pressure medium. Hence, the maximum values of stresses deduced from TO–LO splittings are a good estimate of the sample macroscopic stress t. Similar distributions are observed in the studied salts, even though the absolute stresses are lower, as described below.
3.2 Non-hydrostatic stresses in salts and MgO
Frequencies of the TO and LO components of the 128 cm−1 E mode recorded in methanol–ethanol–water (MEW), NaCl, and MgO (Fig. 4) show the expected splitting according to their nature and state (liquid or solid). In MEW, the splitting is null when compression is hydrostatic in the liquid state (< 11 GPa) and becomes measurable as soon as the transition to a glass is crossed. Splittings are large and non-null at all pressures in solid-state media. In NaCl, they progressively increase with increasing pressure to reach values similar to those of the DFT for 2% strain along the a-axis, corresponding to stresses in the range 2–3 GPa. In MgO, they span a broad range at low pressures to finally reach a narrow range of values similar to those of the DFT for 5% strain along the a-axis, corresponding to stresses in the range 5–8 GPa. Larger stresses in MgO than in NaCl are consistent with stronger ionic interaction in the oxide than in the halide. The excellent agreement between DFT and experimental frequencies validates the use of TO–LO splitting to interpolate stresses from Eqs. (3–5).
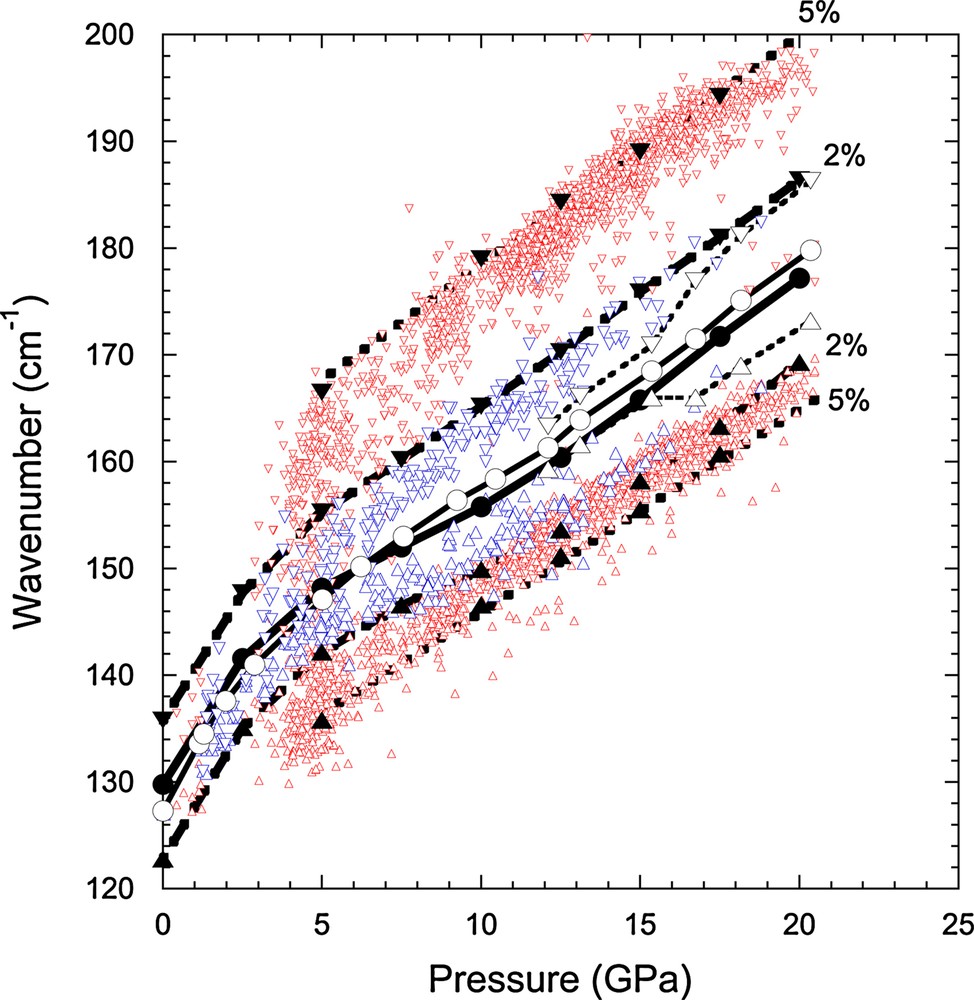
Observed TO–LO frequencies, upward and downward pointing triangles, respectively, in various pressure media compared with theoretical predictions. The solid black symbols are DFT frequencies for hydrostatic compression (solid circles, negligible TO–LO splitting) and deformations of 2 and 5% along the a-axis (solid triangles). The empty black symbols are hydrostatic compression in MEW to 11 GPa. A non-hydrostatic stress in MEW above 11 GPa is observed as moderate TO–LO splitting. The peak position is estimated from the mean of the TO–LO frequencies above 11 GPa in MEW for the sake of comparison with DFT. The solid lines for hydrostatic compression and the dashed lines for non-hydrostatic compression are guides to the eye. Blue and red symbols are for compression in NaCl and MgO, respectively. TO–LO splitting is symmetrical with respect to the hydrostatic frequency up to 2% deformation and the LO component is more affected than the TO component at higher strain or stress, both in DFT and experiments.
The broad distribution of stress values at low pressures, especially in MgO (Figs. 2–4), is likely related to a heterogeneous stress distribution in the sample. At low compression, the initial powder still has a significant porosity, as indicated by a low light transmission under the microscope. At this stage, dense connected bridges of particles form between the two diamond anvils and will sustain high stresses while “protecting” imperfectly compacted volumes of powder that undergo lower differential stresses, a well-known effect in the compaction of disordered granular media (Guyon et al., 1990). With increasing pressure and compaction, the whole sample becomes well-compacted, more transparent to visible light, and the stress distribution is homogeneous (Fig. 2). This observation argues for stress built-up due to local strain in the compacting powder rather than application of a macroscopic homogeneous deviatoric stress field in the pressure medium.
4 Discussion
Stresses measured by quartz piezometry in the different pressure media increase with pressure and reach a limit at pressures above 5–10 GPa in MgO and NaCl (Fig. 5). In KCl and KBr, stresses increase with increasing pressure after the B1–B2 transition around 0.3 GPa, and it is difficult to conclude whether or not it reaches a plateau because of the amorphization of quartz above 20 GPa. From the analysis of stress distribution, the highest measured stresses are inferred to represent the actual deviatoric stress t whose maximum value gives an estimate of the yield strength of the material composing the pressure medium.
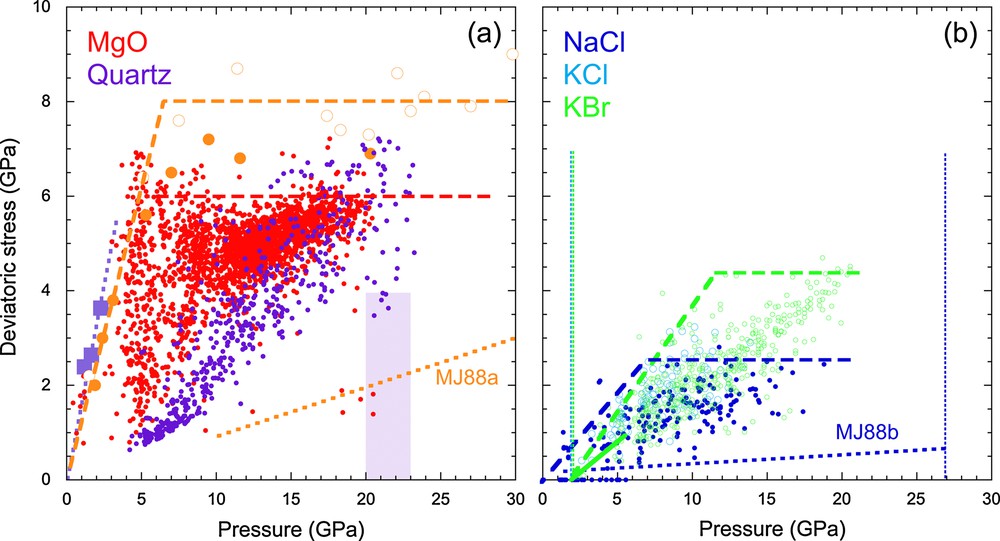
Measured stresses in (a) MgO, quartz, and (b) salts. The thick long-dashed lines indicate estimates of the maximum yield strength of the material. MgO, present measurements in red, radial X-ray diffraction data (Merkel et al., 2002) in orange (a). Mechanical data for quartz aggregates are shown as light purple squares (Hirth and Tullis, 1994); present measurements on pure quartz powder as small purple circles. The amorphization region is shown as a light purple shaded area. The measurements on quartz powder alone (purple points) suggest that the yield strength limit of the quartz is reached at ∼ 6 ± 1 GPa. Stress measurements in MgO with quartz piezometry are thus likely a lower limit for MgO yield strength. Salts, the vertical dashed lines indicate B1–B2 transition pressures (Flórez et al., 2002) (b). The measurements on NaCl were performed in the B1 structure stability field, while they are mostly in the B2 structure for K salts. Yield strength estimates from pressure gradient measurements in MgO and NaCl (Meade and Jeanloz, 1988a, 1988b) are shown as thick short-dashed lines. The deviatoric stress from X-ray diffraction in KBr up to 5.6 GPa (Zhao and Ross, 2015) is shown as a solid green line.
The present results are consistent with yield strength estimates from radial X-ray diffraction, and they show that the pressure gradient method cannot be simply used to estimate stress in the DAC. For MgO, we infer a yield strength of 6 ± 1 GPa, slightly lower than the values of 8 ± 1 GPa determined by radial and standard X-ray diffraction (Merkel et al., 2002; Singh et al., 2004), in line with t ∼ 5.5 GPa measured at ∼ 5 GPa in large-volume press experiments (Lin et al., 2017), and much higher than estimated from pressure gradient measurements (Meade and Jeanloz, 1988a). The present measurements allow testing some of the assumptions underlying the interpretation of previous methods. Quartz piezometry permits to map radially (i.e. in the plane perpendicular to the compression axis) both the pressure and the deviatoric stress distribution in the sample chamber. The vertical distribution is more difficult to obtain since it relies on the depth of field of the confocal system, which is about 10 microns and only slightly lower than sample thickness of 20–30 microns at the highest pressures. Within our resolution, no measurable vertical gradients were observed.
The radial pressure gradients in MgO measured here are consistent with those measured by Meade and Jeanloz (Meade and Jeanloz, 1988a), but in spite of these significant pressure gradients (e.g., from 14 GPa at the rim of the sample chamber to 20 GPa at the center in MgO, Fig. 2), we find that the deviatoric stresses from quartz piezometry are remarkably constant across the whole chamber, except in the first steps of compression. With values of t up to 6 ± 1 GPa at pressures as low as 5 GPa, t is not small with respect to σP. This is one fundamental assumption of Meade and Jeanloz (Meade and Jeanloz, 1988a) in their use of the pressure gradient method that is not verified. At this pressure, the radial stress heterogeneity is also very high, but it decreases rapidly at higher compression values to reach homogeneous values through the pressure gradient (Figs. 2 and 4).
Raman piezometry shows that the stress distribution becomes rapidly uniform after initial compression. Stresses are highly variable (2 to 7 GPa) at P ≈ 6 GPa, whereas they are homogeneous (5–6 GPa) at P > 10 GPa. Radial X-ray diffraction experiments are thus performed throughout a homogeneous deviatoric stress field within a pressure gradient. This accounts for the agreement between the present measurement of deviatoric stress and those obtained by several studies (Lin et al., 2017; Merkel et al., 2002; Singh et al., 2004). Minor discrepancies of 20% between studies are marginally within uncertainties, and may arise from the overestimation of t by Merkel et al. (2002) because their measurement is made through the radial pressure gradient, or because the quartz yield strength is reached before that of MgO in the present experiments. To check the latter possibility, an experiment was performed with quartz only (Fig. 4) and it was verified that the maximum deviatoric stress is similar to that measured on quartz in MgO. Thus, the present measurement is likely that of the yield strength of quartz and a minimum estimate for the yield strength of MgO. This is also confirmed by the axial diffraction measurements of Singh et al. (2004), in which only the central part of the sample, where little pressure gradients are present, was studied. Other Raman probes will have to be calibrated in order to estimate stresses of high yield strength materials like oxides, whose strengths are larger than that of quartz.
Taking maximum Raman measurements of stress as the best estimate of yield strength gives values of up to 7 GPa in MgO, 3 GPa in NaCl, and 4.5 GPa in the high-pressure forms of KCl and KBr. The larger value of yield strength in the oxide than in the halogenides is qualitatively consistent with systematic ab initio estimates of yield stress for easy glide systems (Ogata et al., 2004) giving 17 GPa for MgO and 3.7 GPa in NaCl, and larger than experimental values around 1 GPa for NaCl (Xiong et al., 2014). The yield strength inferred for KBr in the B2 structure is higher than both the theoretical (Ogata et al., 2004) and experimental (Filleter et al., 2006) determinations of 2.5–2.6 GPa in the B1 structure. This suggests that yield strength increases with increasing coordination, as already seen by shock measurements on KCl around the B1–B2 transition (Millett et al., 2002), an idea that requires further experimental and theoretical verification. This is consistent with the general trend of increasing the mechanical strength of silicates with depth in the Earth's mantle, especially at the transitions from olivine–spinel structures of the upper mantle to perovskite-based structures in the lower mantle (Kraych et al., 2016; Merkel et al., 2007; Ricard et al., 1993).
One major assumption of this study, though, is the fact that the stresses in the embedded quartz grains are similar to those of the containing matrix. This assumption is valid under purely hydrostatic conditions or with elastically anisotropic materials. When solid samples are loaded, however, stress heterogeneities develop at the local scale, even if the overall sample is under hydrostatic conditions. Locally, the stresses actually applied on the stress probe grains may differ from the macroscopic differential stress, an effect that may also depend on the grain size. In the present study, the stresses measured in the quartz grains show a broad distribution at each pressure. We find that the maximum stress values in quartz tend to agree with the overall strength of the sample. In the future, these assumptions should be modelled, using mesoscale models such as crystal-plasticity based finite element simulations (Amodeo et al., 2016). This project, however, goes beyond the goals of the present study. This issue is critical for the calibration of pressure and stress in extreme conditions experiments as it is always assumed that the sample stress state can be evaluated with a stress marker embedded in (or close to) the sample.
Acknowledgements
This work was supported by INSU through the national Raman facility in Lyon, by grants from the “Programme national de planétologie” and from the “ENS de Lyon” (to BR). It is a contribution of the LABEX Lyon Institute of Origins (ANR-10-LABX-0066), within the program “Investissements d’avenir” (ANR-11-IDEX-0007) at “Université de Lyon”.