


 CC-BY 4.0
1. Introduction
Breccias are rocks produced through a large variety of processes: they can have a sedimentary, tectonic, karstic, hydrothermal or magmatic origin, or they may be produced by the impact of a meteorite [e.g. Shukla and Sharma 2018]. As a result, breccias may be found in a wide range of geodynamic environments.
This study focuses on the sedimentary organization of two different depositional contexts of slope breccias: with and without extensional tectonic coupling. During extension, these breccias are either related to the creation of substantial topography in the footwall and its collapse on the hanging wall of the normal fault [Kernif et al. 2022], or they form during rock cliff erosion. These colluvial fan breccias correspond either to a “talus fan” [Salomon 2007] or to the “Precursor Stage” and “Stage 1” in the evolution of an alluvial fan system [e.g. Blair and McPherson 1994]. Sedimentary breccias are described in many places: (i) associated with a normal fault [e.g. Alonso-Chaves and Rodriguez-Vidal 1998; Sanders et al. 2018; Bourli et al. 2019; Cipriani and Bottini 2019; Ribes et al. 2019] or (ii) associated with rock cliffs on a talus slope without bedrock deformation [Blair and McPherson 1994; Salomon 2007; Sanders 2010; Ruiz-Carulla et al. 2015]. Very few analogue models address the problems associated with the creation and organization of slope deposits. Some experiments have studied the collapse of volcano flanks [Vidal and Merle 2000] or the collapse of granular slopes along weak horizons [Liu and Koyi 2014].
The various types of organization between talus slopes resulting from exhumation during extension or from rock cliffs without deformation are not presented. For example, the following questions still need to be answered: what are the various lithologic evolutions of the clasts in time and space and how is the size of the clast organized during the preservation of these sedimentary breccias? This is what we are attempting to understand via an analogical modelling approach.
With this objective in mind, we ran several analogue models, either with or without extension, to analyse the external geometry and internal organization of sedimentary breccias and their evolution in time and space.
The results of these experiments are compared to natural examples, with and without extensional tectonic coupling, to specify the key discriminant parameters.
2. Experimental procedure
The aim of the experiment is to use sand to reproduce the geometric organization of sediments in the talus slope based on the evolution of the destabilization zone. The sandfall observed in the experiments is comparable to the rock fall associated with a talus slope in nature.
The modelling techniques used here are similar to those commonly used for experiments dealing with brittle systems in the Laboratory of Experimental Tectonics of Géosciences Rennes (Rennes University, FRANCE) and that have been described in numerous studies [e.g. Vendeville 1987; Krantz 1991]. Brittle layers were represented by sand, with an angle of internal friction close to 30° [Krantz 1991] and a density (𝜌) of about 1400 kg∕m3. In our experiment, one centimetre of sand represents about 250–300 m in nature. Dry sand has no cohesion, and therefore we mixed the sand with water to obtain a cohesion in the sand close to 50 to 100 Pa, allowing the creation of cliffs measuring 0.5 to 1 cm high in the experiment that represent 150 to 300 m in nature. After several tests, a water weight of 0.03% of the sand weight was added and mixed in a cement mixer to obtain moistened sand.
For the first set of experiments, Bre 1 to Bre 4 (with extension), the experimental apparatus was set up as follows: the base was a fixed rigid plate. On top of this base, one side of the model was a fixed wall and the opposite side was a thin mobile plate, which was fixed on a mobile wall (allowing it to be displaced at a constant rate). The two remaining perpendicular sides are limited only by the sand (Figure 1A). The shape of the mobile plate induces a velocity discontinuity (VD) at the base of the model that localizes the deformation [see Malavieille 1984; Balé 1986; McClay and Ellis 1987; Nalpas et al. 1999]. The model was set in a 70 × 60 cm sandbox, wide enough to achieve a relatively large amount of stretching without lateral edge effects. The prekinematic pile of the models was made of four layers of sand (dry and/or wet, see Table 1), composed of, from bottom to top: 12 cm of white sand, 1.5 cm of yellow sand, 1.5 cm of blue sand and 1.5 cm of white sand (Figure 1A). To represent an active normal fault, an extension perpendicular to the VD is applied to the wall and moving plate by means of a piston driven by a computerized motor. The amount of extension is 10 cm and the extension velocity is 15 cm per hour.
Experimental device. (A) with extension (10 cm at 15 cm/h), (B) without extension (the coloured sand layers are cut with a slope of about 60° to 70°).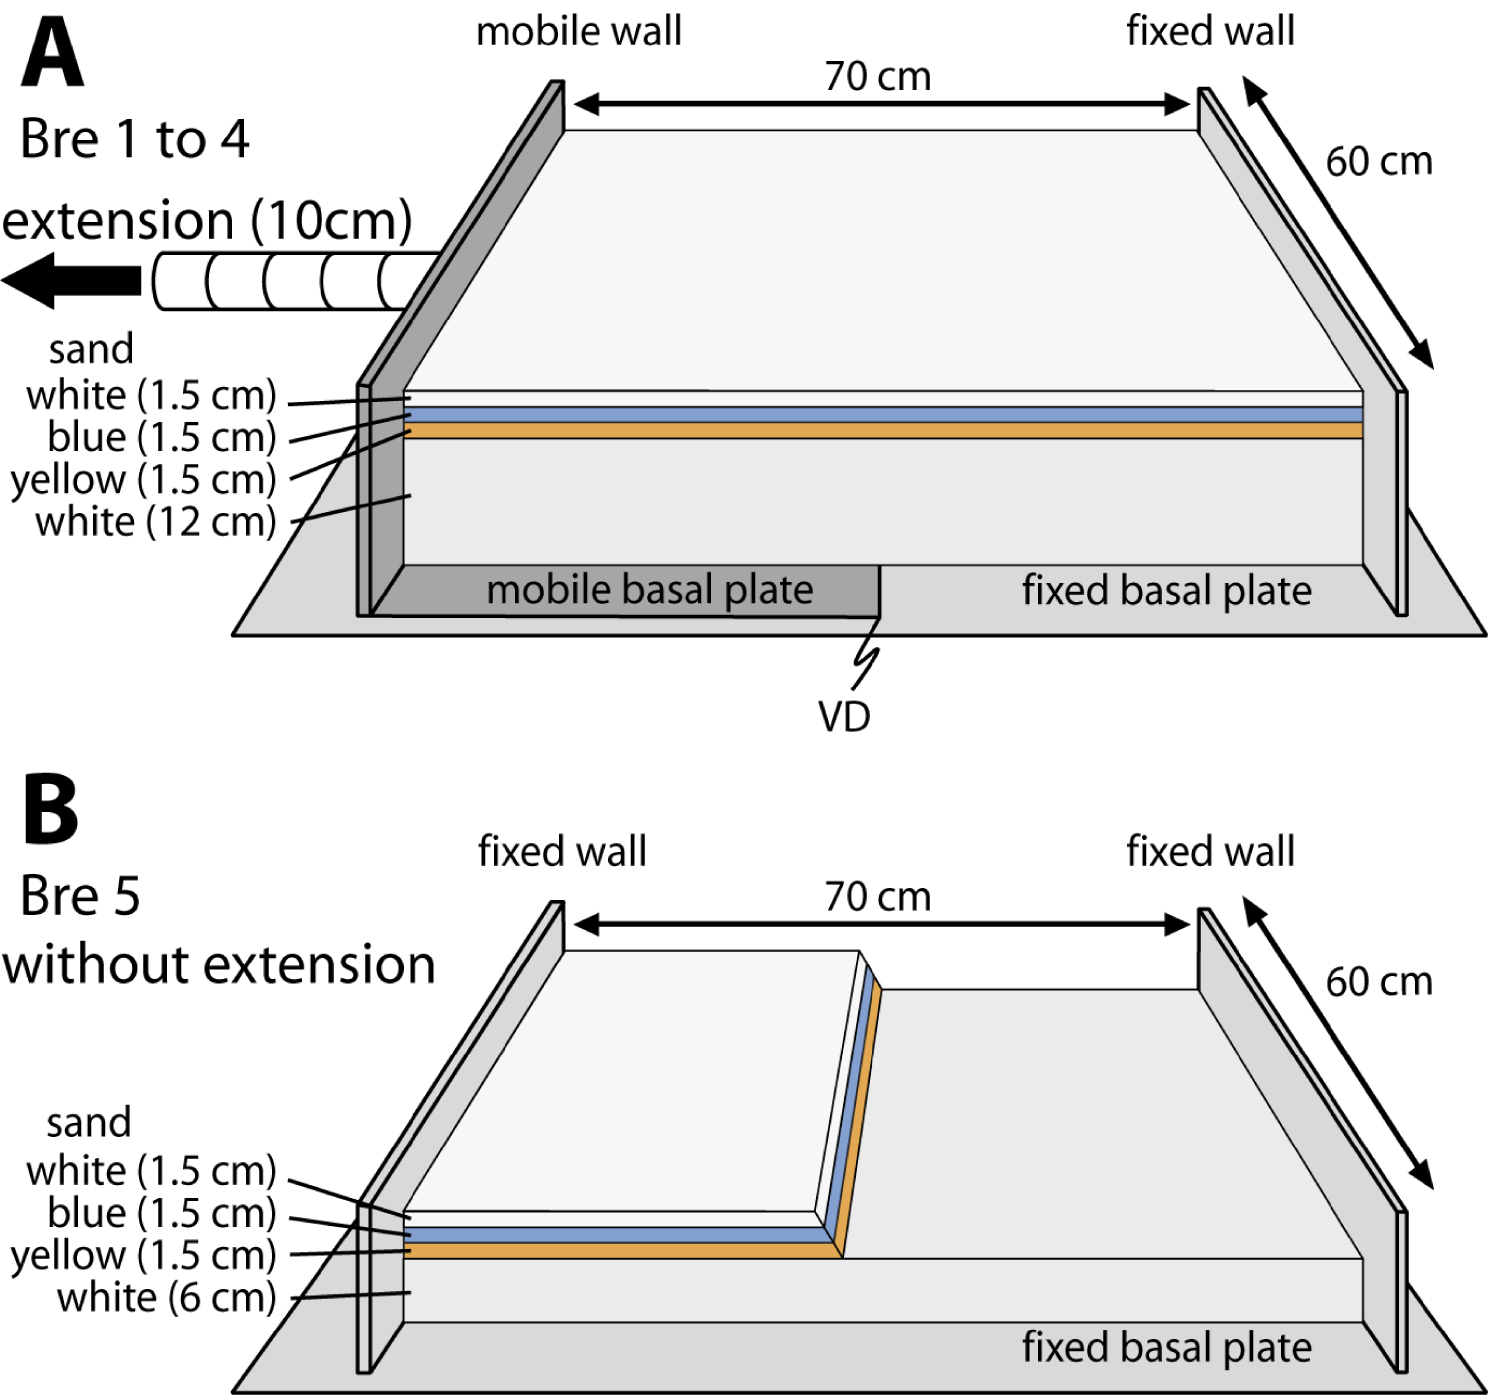
Architecture of the sand layers in the experiments, NC = non-cohesive sand, C = cohesive sand
| Experiment | White sand base | Yellow sand | Blue sand | White sand | Tectonic extension |
|---|---|---|---|---|---|
| Bre 1 | NC | C | C | C | Yes |
| Bre 2 | NC | C | NC | C | Yes |
| Bre 3 | NC | NC | C | NC | Yes |
| Bre 4 | NC | NC | NC | NC | Yes |
| Bre 5 | NC | C | C | C | No |
For the second set of experiments, Bre 5, the experimental apparatus was similar to the apparatus used in the previous experiments with the sole difference being that there were two fixed walls on top of the fixed rigid basal plate instead of only one (i.e. the mobile wall used in the first set of experiments was replaced by a fixed wall here) (Figure 1B). As in the previous set of experiments, the two remaining perpendicular sides are limited only by the sand. The model was set in a 70 × 60 cm sandbox. The prekinematic pile of the models was made of four layers composed of, from bottom to top: 6 cm of dry white sand, 1.5 cm of wet yellow sand, 1.5 cm of wet blue sand 1.5 cm of wet white sand (Figure 1B and Table 1). To represent an active talus slope without extension, a topography was created in the experiment in the colour layers by cutting them with a slope of about 60° to 70° just after they were deposited.
Photographs of the model surface were taken at regular time intervals to observe the structural development. After deformation, the internal structure was observed on a series of cross-sections cut parallel to the extension direction (perpendicular to the VD) for the first set of experiments, or perpendicular to the slope for the second set of experiments. Brittle sand layers were comprised of various colours of sand to reveal the: (i) tectonic structures and (ii) the provenance of clasts inside the deposits, as well as to be observed on photographs. It should be noted that the colour of the sand does not modify its behaviour in any way.
The experiments were designed to test several different sand layer architectures, between dry sand and moistened sand (Table 1). When the sand is dry, i.e. without cohesion, the slope of a talus corresponds to the internal friction angle of the sand, close to 30°, and when the sand is moistened, it is possible to obtain a slope with a high angle (between 60° and 90°). In the first set of experiments, an active sandfall is produced by the increase in relief during extension and the decrease in humidity through time in the sand, whereas in the second set of experiments only the decrease in humidity through time in the sand produces an active sandfall. The experiments with extension last 40 min at an extension of 15 cm/h, leading to an extension of 10 cm. The sand avalanches start, once a cliff is created by the emergence of the normal fault at the surface and occur both alternately in different parts of the created relief and continuously, for as long as the extension lasts. The avalanches stop almost immediately at the end of the extension when the slope stability of about 30° is reached. The experiment without extension lasts about 30 min, when the sand becomes dry and the avalanches stop. The sand avalanches start as soon as the cliff is artificially created and occur both alternately in different parts of the created relief, and continuously, until the slope stability of about 30° is reached.
3. Analogue results
3.1. Experiments with extension
Four experiments were performed to investigate the role of cohesion in the organization of sand in an active colluvial system during extension. The experiments are presented by a cross-section and final surface view that focus on the slope created by the normal fault (Figure 2). In experiments Bre 1 and Bre 4, all the coloured sand layers are either dry or wet, therefore there is no rheological variation in the layers of coloured sand and extension produces only a major normal fault. In experiments Bre 2 and Bre 3, few layers of coloured sand are dry, while others are wet; this leads to rheological variations in the coloured sand layers and extension produces a major normal fault associated with minor faults.
Experiment with extension; cross-section on the left side, surface view on the right side (oblique surface view for Bre 1). The amount of extension is 10 cm and the extension velocity is 15 cm per hour for all experiments.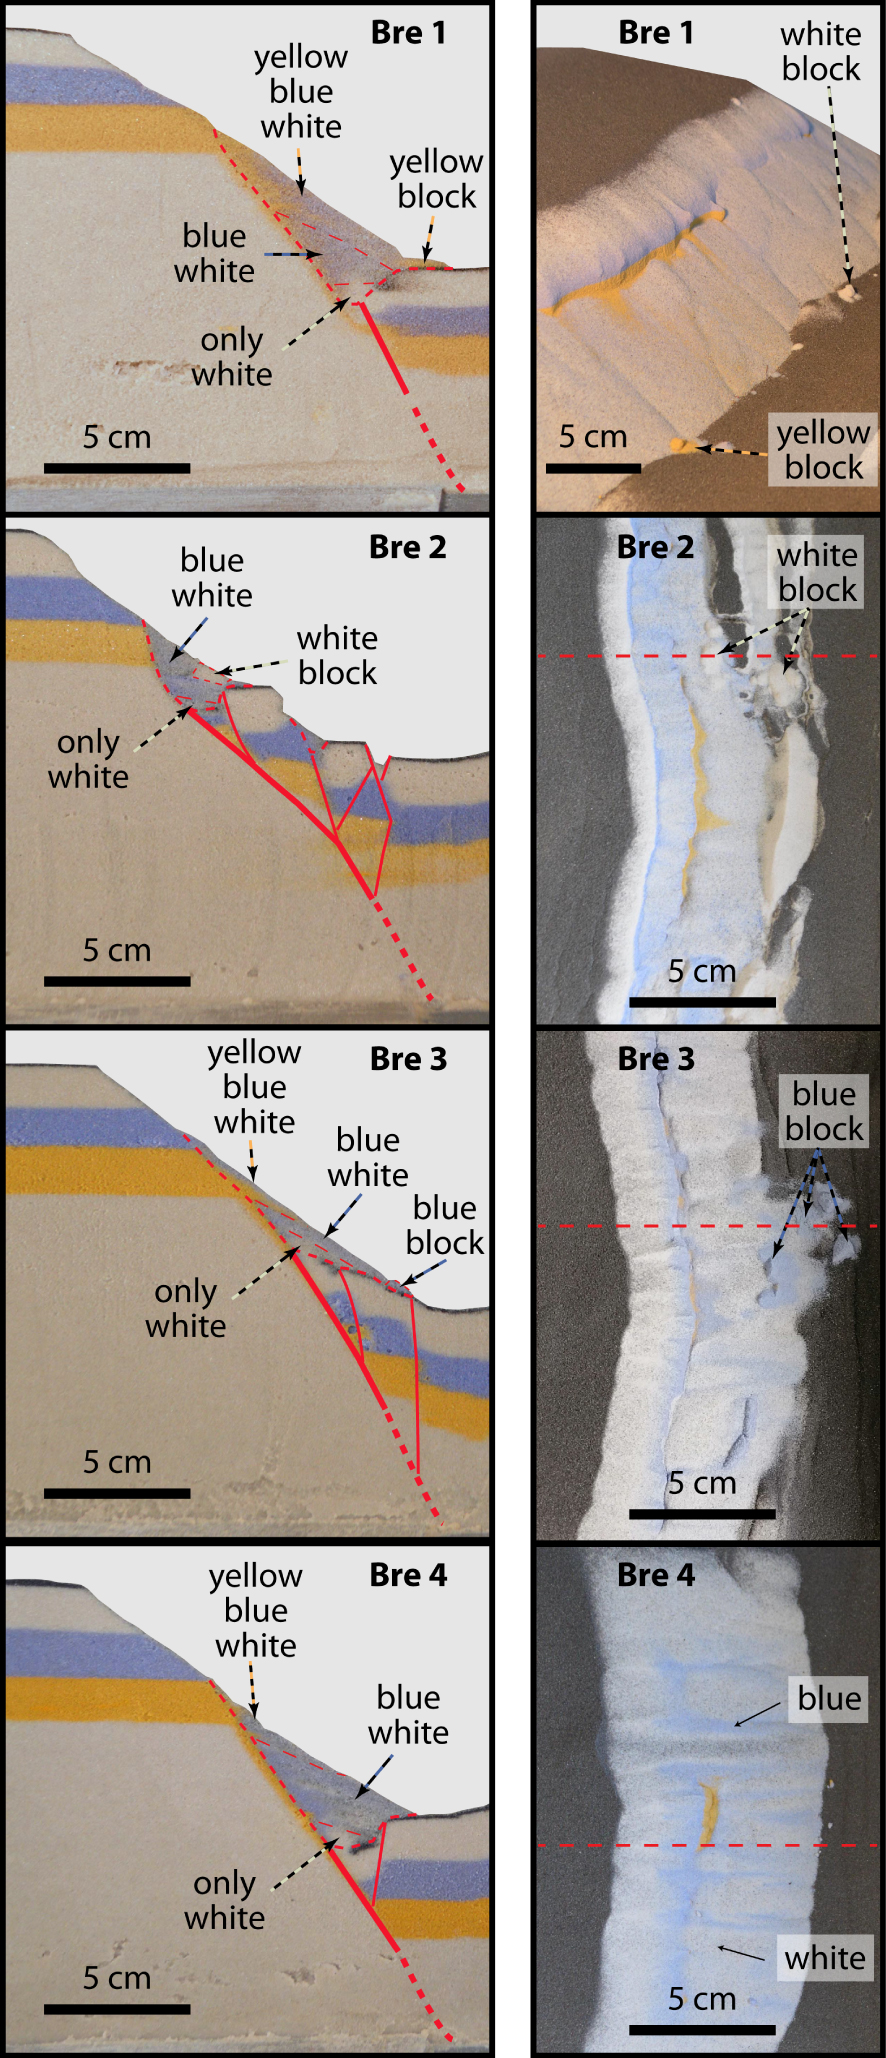
The topography created by the movement of the normal fault produces a steep slope, the fault escarpment, that is systematically destabilized in a sandfall towards the base of the slope. The sand is then deposited in a medium slope sand layer. The oblique surface view of the experiment is shown in order to visualize the slope created by the normal fault, which is a minimum of 60° for the yellow layer and the base of the blue layer, compared with the slope close to 35° of the sand layer deposited over the base of the slope (Figure 2, Bre 1).
The first sand layer exhumed by the normal fault is the white layer, and therefore the first deposit at the base of the fault scarp corresponds to white sand. The second sand layer exhumed by the normal fault is the blue layer, and therefore the second deposit at the base of the slope corresponds to a mixture of white and blue sand. The third sand layer exhumed by the normal fault is the yellow layer, and therefore the third deposit at the base of the slope corresponds to a mixture of white, blue and yellow sand (Figure 2, cross-section).
Depending on the destabilization zone, it can be observed that the deposit does not correspond to only a simple mix of white, blue and yellow sand colours. Instead, we see a zone with more white sand or more blue sand or more yellow sand in the surface view (Figure 3). This is related to the non-cylindrical destabilization of the sand, and therefore it is impossible to have a good correlation of the deposition along the fault escarpment. The deposits at the base of the fault scarp are not homogeneous. This lack of homogeneity is visible regardless of how the layers (wet and dry) are organized. The heterogeneity of the deposits is only visible if the destabilized layers are of different colours.
Experiment without extension, cross-section on the left side. The thick red dashed line corresponds to the base of the deposits whereas the thin red dashed line separates the various colours of the deposits. Surface views on the right side, at the beginning, middle and end of the experiment. The thin red dashed line delimits the deposits.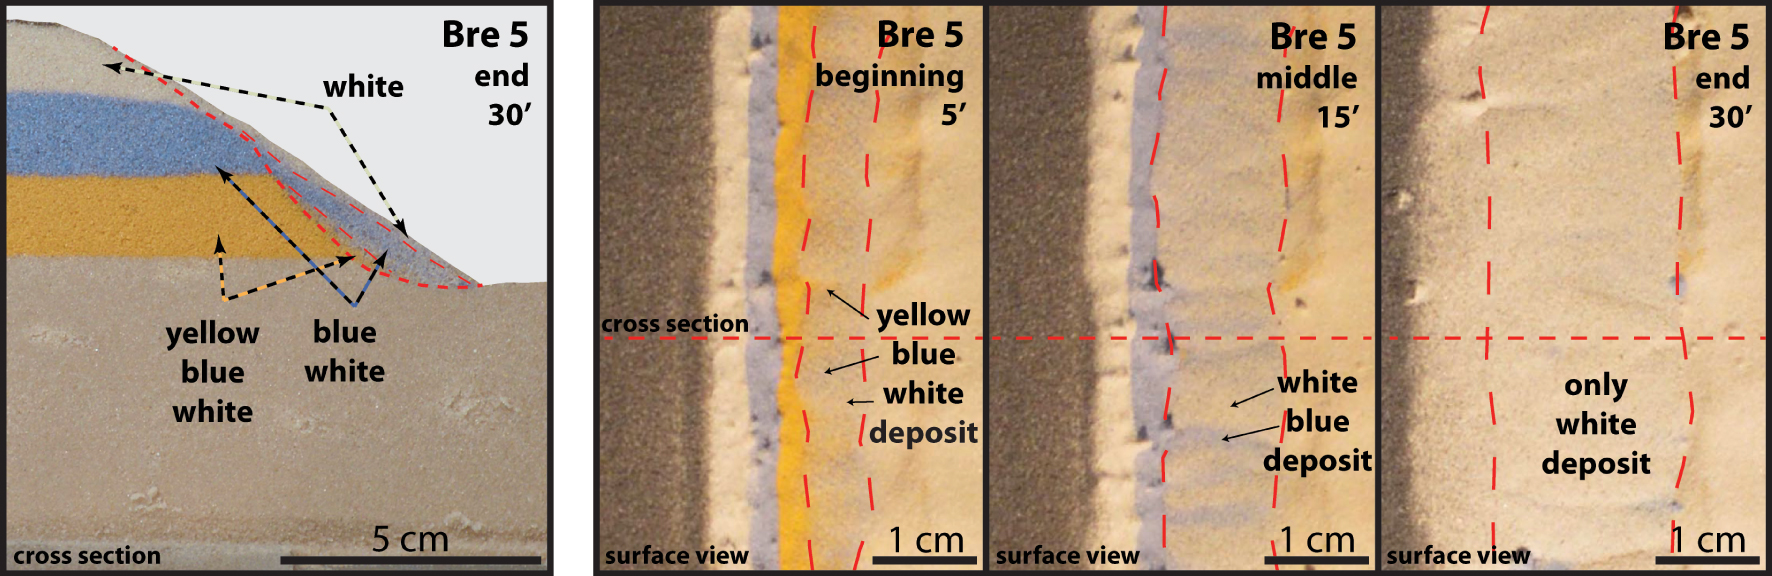
When the sand is moistened, it is possible to obtain aggregates of sand grains in the sand layers when they are destabilized (Table 1, Bre 1, 2, 3, 5). Therefore, in all experiments with at least one wet sand layer, it is possible to observe aggregates of white, blue or yellow sand grains that are detached from the upper slope layers and combined together within the sand deposited at the base of the slope. It should be noted that these aggregates of sand grains (like blocks of sand grains) may move further than a single sand grain (Figure 2, Bre 1 to 3).
3.2. Experiment without extension
One experiment was performed to investigate the organization of destabilized deposits on a slope without extension. In order to create a slope of about 60° in the sand at the beginning of the experiment, the yellow, blue and white layers are constructed with moistened sand to increase cohesion. The experiments are presented by a cross-section and final surface views that focus on the evolution of the slope over time (Figure 3).
The progressive destabilization of the topography created by scraping is related to the gradual sand moisture loss by surface dehydration, thereby decreasing the cohesion of the sand layers. At the beginning of the experiment, all the colours of the sand layers crop out; the first deposit at the base of the slope corresponds to a mixture of white, blue and yellow sand. This first sand layer deposited at the base of the slope progressively covers the previously exposed lower yellow sand layer. During the middle phase of the experiment, when only the white and blue layers crop out, the second deposit at the base of the slope corresponds to a mix of white and blue sand. This second sand layer deposited above the first sand layers progressively covers the previously exposed middle blue sand layer. At the end of the experiment, when only the white layer crops out, the third deposit above the previous ones is made of white sand only (Figure 3). This colour organization of the sand layers deposited at the base of the slope is opposite of what we observe with extension. Progressively, the layers forming the destabilized slope are covered by the collapsed sand and the sand collapse stops when the dip of the entire slope reaches about 30–35°.
4. Discussion—comparison with a natural case
4.1. Rockfall with or without extension
In all experiments, sand that has glided to the base of the slope is organized in steeply dipping layers, about 30°, as observed in natural examples [e.g. Salomon 2007; Sanders 2010]; this is comparable to the destabilized zone which corresponds to a steep slope [e.g. Ruiz-Carulla et al. 2015; Cipriani and Bottini 2019; Kernif et al. 2022].
In all the experiments performed with cohesive sand (Figure 2, Bre 1, 2 and 3), the creation of aggregates of sand grains during the destabilization of the sand layers can be observed. These aggregates of sand grains correspond, in nature, to blocks spanning several metres that are usually observed during extension, associated with synkinematic sedimentary breccias [e.g. Cipriani and Bottini 2019; Ribes et al. 2019; Kernif et al. 2022], or that are deposited at the base of a slope without extension [Copons et al. 2009; Ruiz-Carulla et al. 2015; Melzner et al. 2020].
4.2. Rockfall organization in time with extension
The layers of sand deposited at the base of the slope in the experiments during extension are similar to layers of breccias deposited in front of a normal fault during extension in a continental, marine or transitional domain [e.g. Alonso-Chaves and Rodriguez-Vidal 1998; Sanders et al. 2018; Bourli et al. 2019; Cipriani and Bottini 2019; Ribes et al. 2019; Kernif et al. 2022]. These layers are syntectonic deposits.
The sand that comes from the exhumed layers is progressively deposited at the base of the fault scarp during extension. A direct positive relationship is observed: the larger the amount of extension, the thicker and more laterally extended the layer deposited at the base of the fault. The first sand layers deposited at the base of the fault scarp are composed of white sand only, then white and blue sand only and lastly white, blue and yellow sand (Figure 2). The first sand layer (white only, Figure 2) deposited at the base of the fault scarp is very homogeneous whereas the second (white and blue, Figure 2) and third layers (white, blue and yellow, Figure 2) are heterogeneous and composed of a mixture of different sand colours. In nature, this corresponds to a classic normal unroofing sequence during exhumation [Decelles et al. 1991; Colombo 1994]. This architecture of the sand layers in the experiments is comparable to what is observed in natural cases in front of an active normal fault such as in southern Crete [Kernif et al. 2022; Figure 4]. The progressive exhumation of rocks during extension is recorded in the lithological evolution of the clast deposited at the base of the slope and representative of its provenance. The first clasts deposited at the base of the slope come from the first formation exhumed and new clasts are progressively deposited in function of the exhumed material (Figure 4). This normal unroofing sequence during extension is characteristic of a progressive exhumation and continuous deformation without movement quiescence (Figure 5). This important point is used to discern between, in terms of clast organization in the deposited layers, what is related to tectonic exhumation (normal unroofing) and what is related to the natural destruction of cliffs without associated deformation [reverse unroofing, Colombo 1994].
Provenance of the clasts during breccia formation in front of a normal fault, with PK: Plattenkalk, TR: Trypali, PQ: Phyllite-Quartzite, and TP: Tripolitza [Agios Nektarios valley, in southwestern Crete, modified fron Kernif et al. 2022].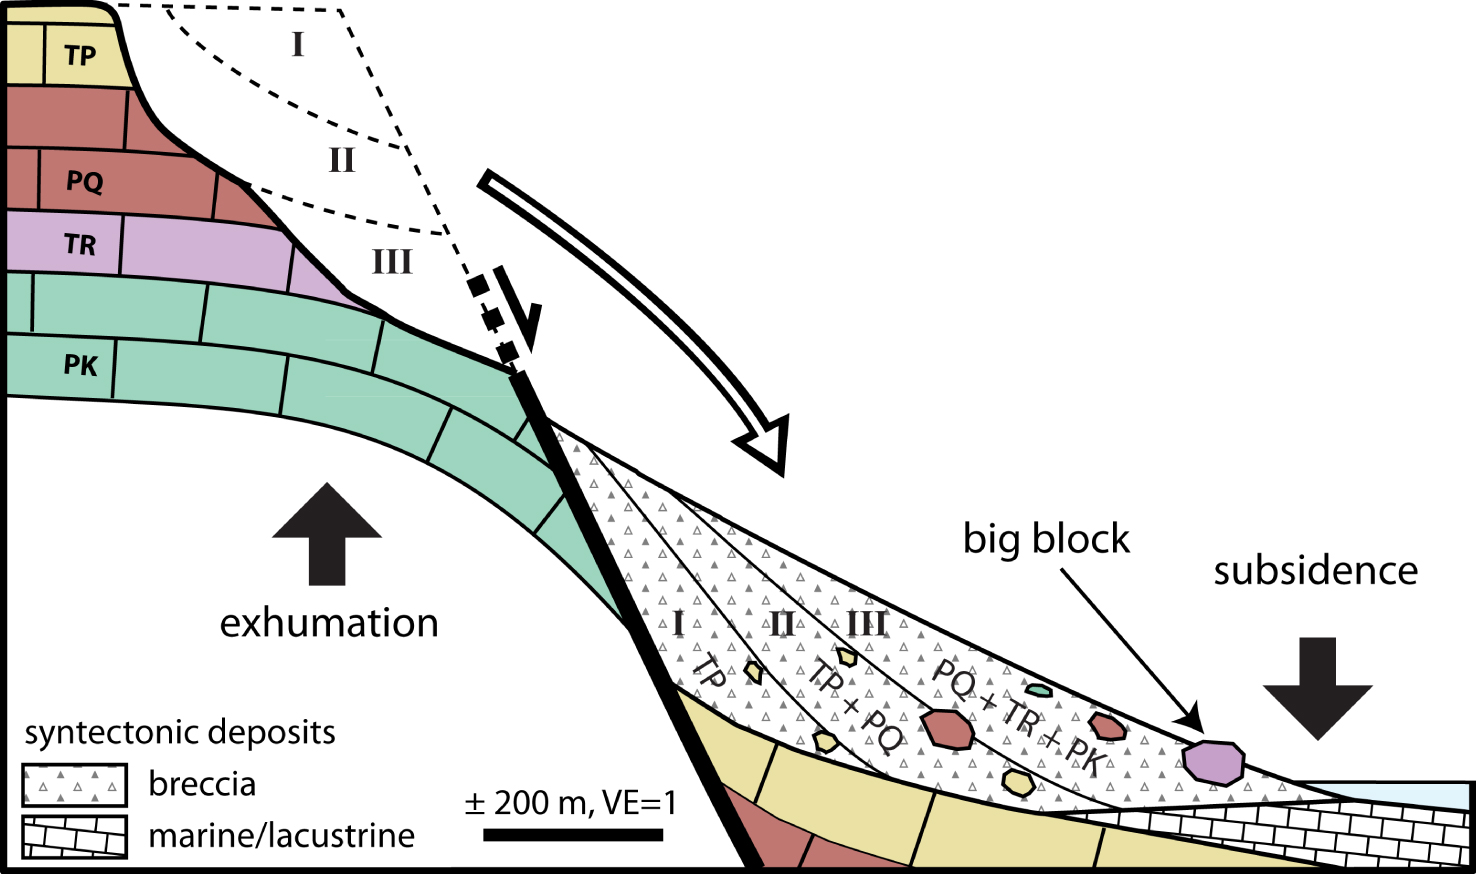
(A) Normal unroofing sequence with extension corresponding to an inverted vertical clast distribution in breccias. (B) Reverse unroofing sequence without deformation corresponding to a stratigraphic clast distribution in breccias.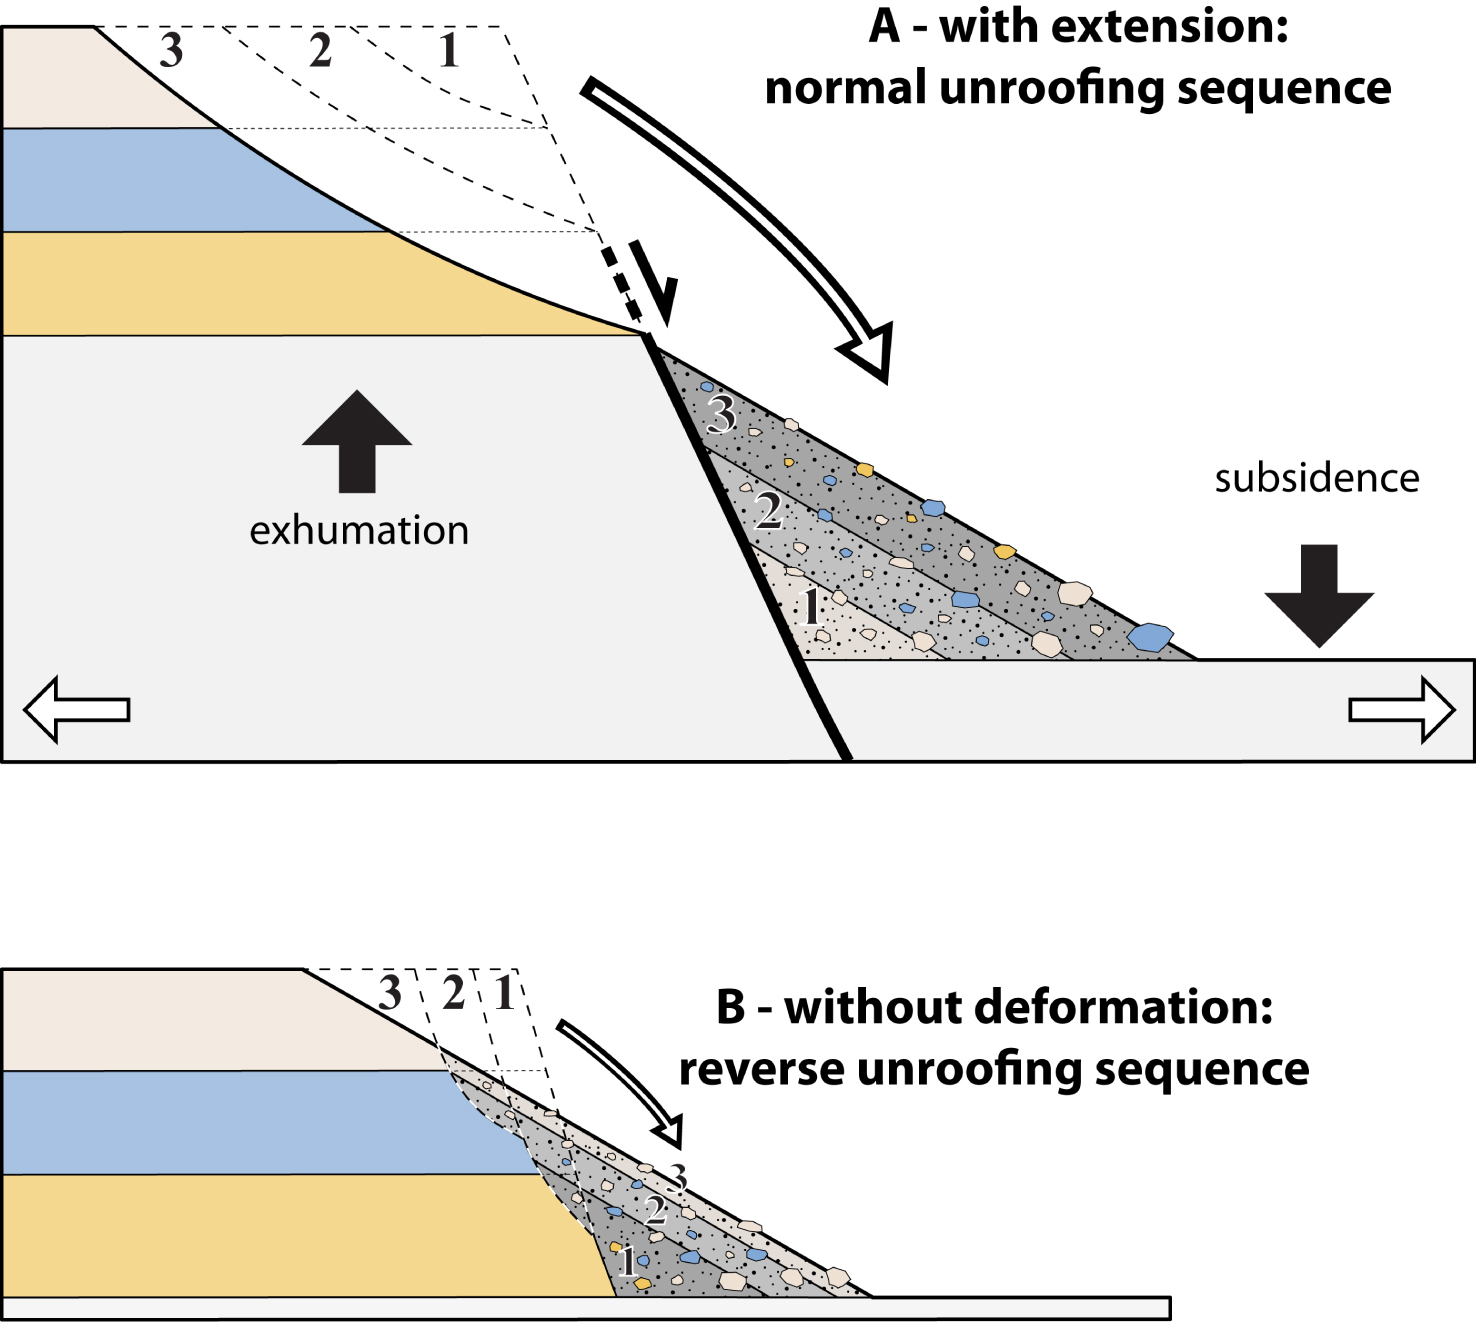
4.3. Rockfall organization in time without extension
Without extension, the topography is created at the beginning of the experiment and all layers outcrop (yellow, blue and white); therefore, the first sandfall at the base of the slope is composed of sand grains of all three colours (Figure 3). At the beginning of the destabilization, like in the experiment with extension, the first layer deposited at the base of the slope is thin and then, during the destabilization of the sand, new layers are progressively deposited above the older layers. However, the progressive increase in the thickness and lateral extent of the entire slope deposits (Figure 3) is not as much as for the experiments with extension. This thinner thickness of the slope deposits, at the end of the experiment, is related to the amount of sand to be destabilized because, without extension, the topography is progressively covered by the slope deposits and the amount of sand that can slide is limited. The evolution of the various sliding masses, first from a mixture of white, blue and yellow sand, then a mixture of white and blue sand and then the last sliding mass with only white sand corresponds to a reverse unroofing sequence [Colombo 1994], that is characteristic of a progressive destruction of a cliff without exhumation (Figure 5).
4.4. Rockfall architecture with or without extension
In the experiments with white sliding sand only, it is impossible to see lateral variations, as is the case in the first layer deposited with extension, or the last one without extension (Figures 2 and 3). For the other layers deposited either with white and blue sand only or with white, blue and yellow sand, there is no homogeneity in the surface view (Figures 2 and 3). The zone of deposits is either more white, more blue or more yellow in relation to the destabilized zone and therefore there is no lateral continuity overall (Figures 2, 3 and 6).
(A) Lateral organization of the colluvial fan during extension [modified after Kernif et al. 2022]. (B) Architecture of the sand colluvial fan in the experiment. (C) Organization of the colluvial fan at the base of a cliff (photo by Mark A. Wilson, Ifjorden, Svalbard, Norway, with his permission for use here). (D) Organization of the colluvial fan in an active normal fault (Google Earth version 7.3.4.8642. (March 9, 2013) 20 km west of Yoboki, Djibouti. 11° 32′ 37.18′′ N, 41° 54′ 54.76′′ E, eye altitude of 7.45 km).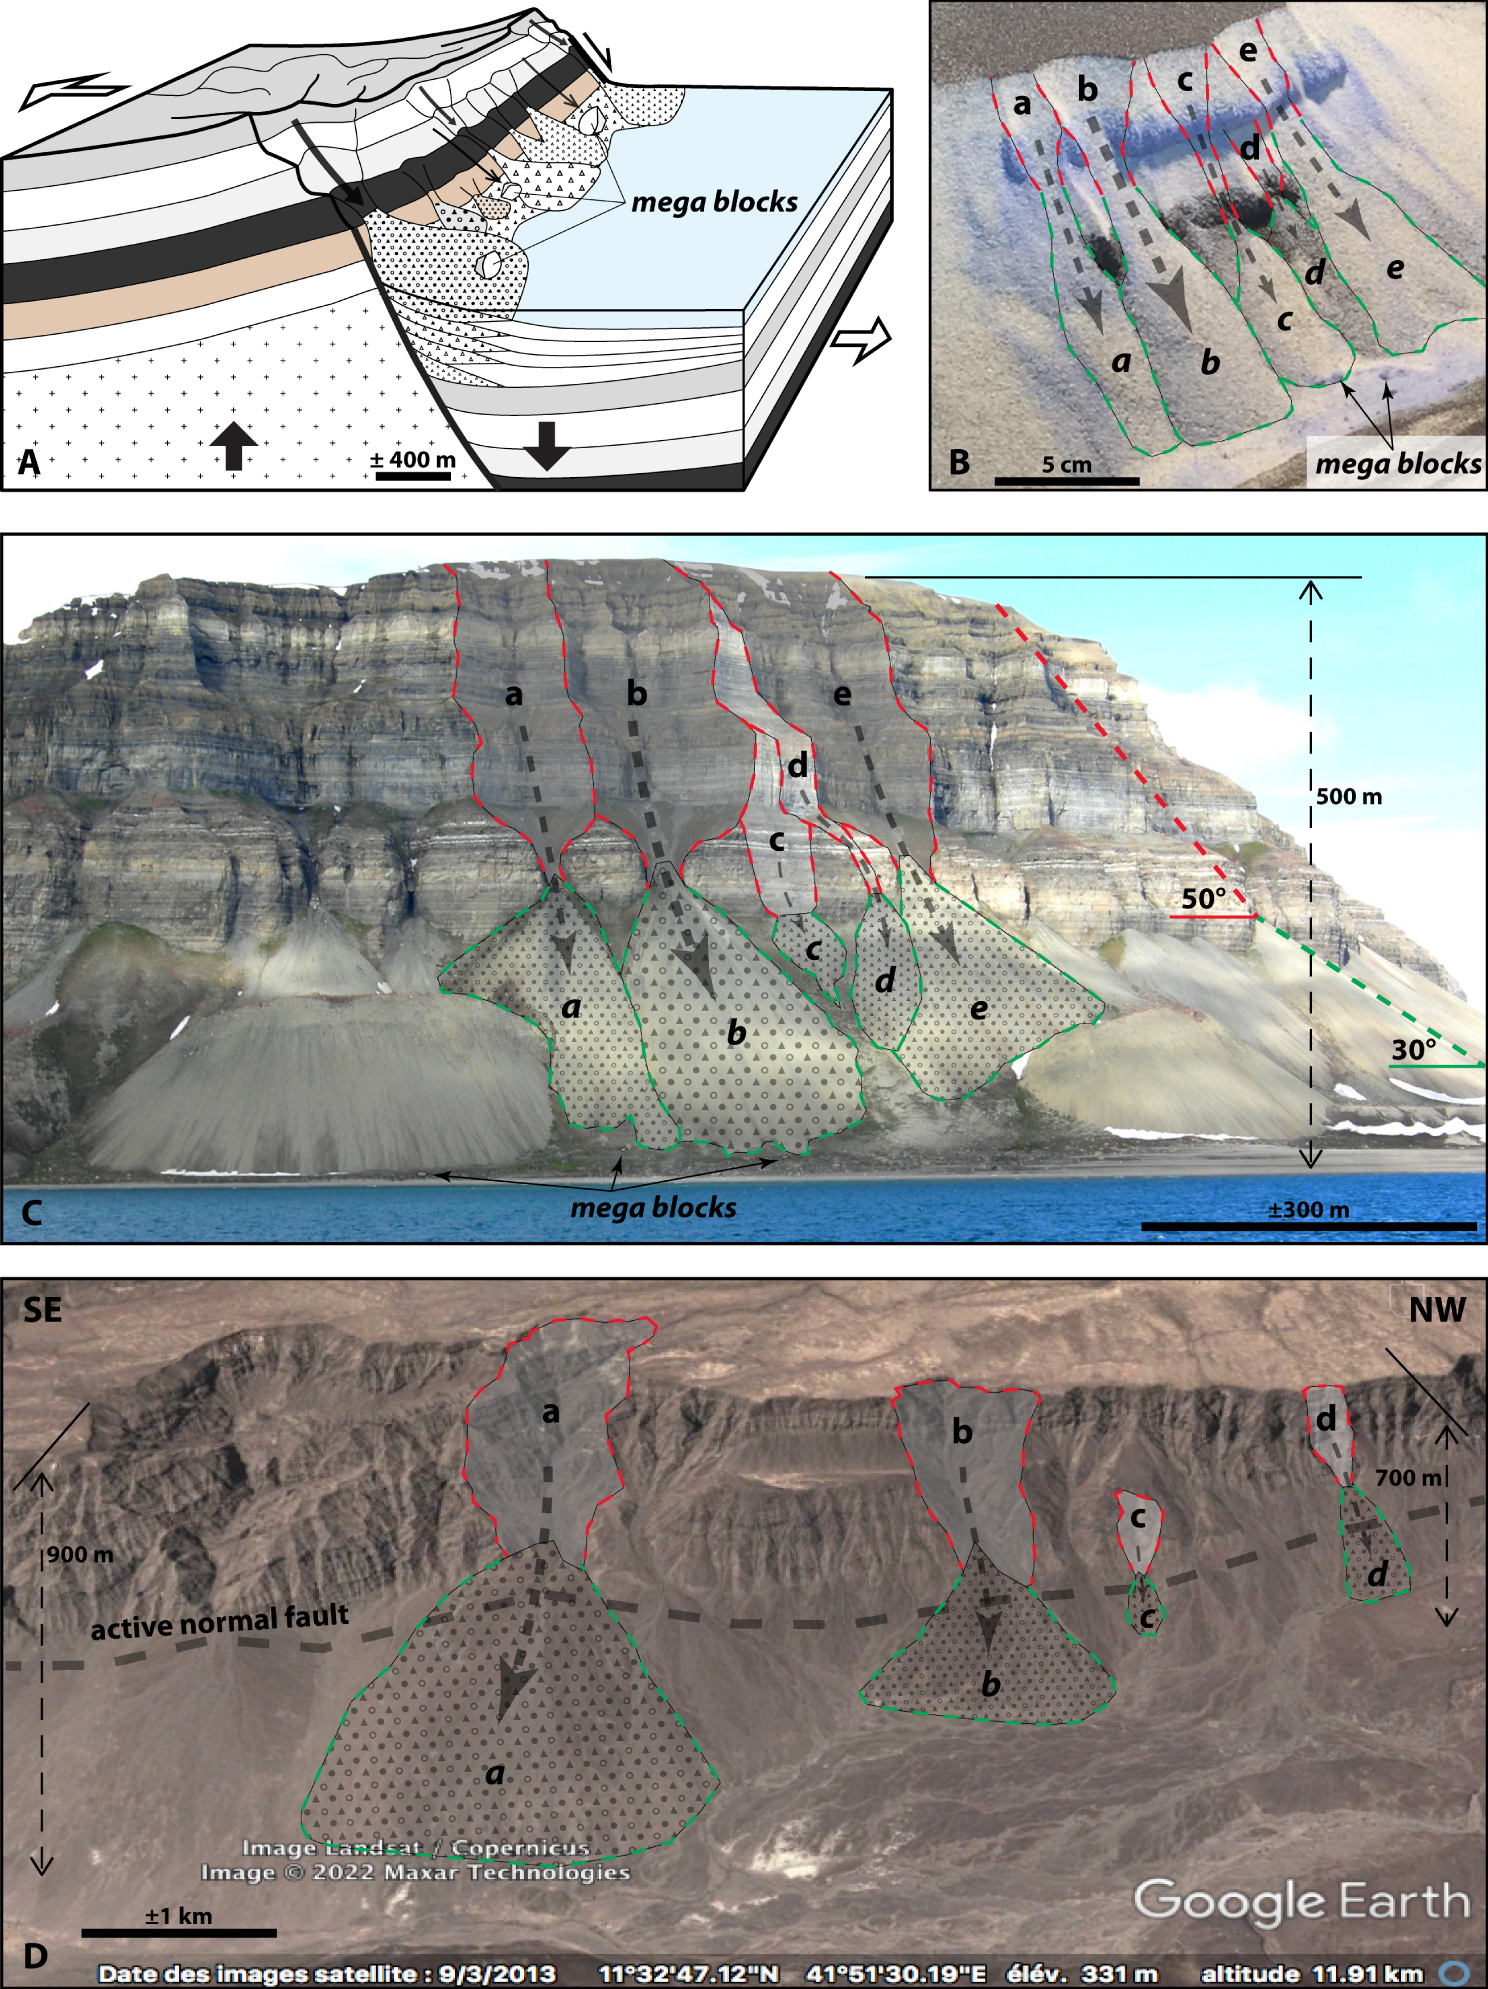
The same architecture is observed in natural examples at the base of a natural cliff (Figure 6C) or in front of a normal fault (Figure 6D). This is why it may be difficult to correlate slope breccia along a talus slope.
In natural cases of erosion of a cliff without extension (Figure 6C) and of exhumation and erosion with extension (Figure 6D), it is possible to observe the same architecture where each colluvial fan (shown in green in Figure 6), is linked to an upstream destabilization zone (shown in red in Figure 6). Again, we observe a direct positive relationship: the larger the destabilization zone, the larger the colluvial fan. In natural cases of exhumation and erosion with extension (Figure 6D), the bigger the fault displacement, the larger the colluvial fan. Thus, laterally, the deposits are composed of several single fans for which the material does not necessarily come from the same set of layers and therefore each fan presents clast types that might be specific to each fan and that may be different from adjacent fans. Note that regardless of the size of the colluvial fan, the slope of the deposits is the same, close to 30°, corresponding to the stability angle of the deposits. The cliff angle gradually decreases to a value that depends on the cohesion of the cliff material.
In the experiment with wet layers of sand, the blocks that resulted from the aggregates of sand grains may be deposited on the slope, but they are usually deposited farther than single sand grains and are located at the base of the slope (Figure 2, Bre 1, 2 and 3). This is also the case in natural examples (Figure 6) and this phenomenon is related to the amount of energy acquired during falling and the ability of large boulders to roll downhill [e.g. Copons et al. 2009; Ruiz-Carulla et al. 2015, 2016; Melzner et al. 2020].
5. Conclusions
- The progressive exhumation during extension is visible in the lithology of the clasts found in the talus deposits. The clasts coming from the first formation that was exhumed are encountered in the first deposit at the base of the slope, and then the clasts coming from the first and second formation in the second deposits, and so on. Therefore, during extension, a normal unroofing sequence is characteristic of a progressive exhumation, continuous deformation and synchronous sedimentation of the talus deposits.
- The first slope deposits from a cliff that is being destroyed show clasts coming from the material of the whole cliff. Then, as the deposits cap part of the cliff, we only find the clasts coming from the material of the high parts of the cliff. This evolution corresponds to a reverse unroofing sequence characteristic of a progressive destruction of a cliff without exhumation.
- During extension, depending on the destabilized exhumation zone, the material sliding at the base of the fault scarp is different from one sliding to another. It is therefore impossible to have a good correlation of the deposition along a normal fault.
- With regard to the cohesion of the destabilized material, it is possible to find large blocks in the talus deposits. They are generally deposited further away than fine-grained material and are found at the base of the slope. This is related to the amount of energy acquired during the falling of the blocks and their ability to roll downhill.
Conflicts of interest
Authors have no conflict of interest to declare.
Acknowledgements
The authors appreciate the constructive comments from Bruno Vendeville and anonymous reviewer.
We would like to thank Mark A. Wilson for the photo in Figure 6C of a cliff in Ifjorden, Svalbard, Norway.
We would also like to thank S. Mullin for proofreading the English content.