


 CC-BY 4.0
1. Introduction
Despite the fact that climate change has increased the severity and frequency of floods and that floods have killed more people than all other natural disasters combined [De Groeve and Riva 2009a], more studies are required to provide cost-effective early warning systems for timely evacuation plans in operational context [Zaji et al. 2018]. Recent studies have successfully employed artificial intelligence models for solving nonlinear water resources problems [Akhbari et al. 2017, Bonakdari et al. 2020, Ebtehaj et al. 2018, 2019, Espinoza-Villar et al. 2018, Gholami et al. 2019, Sattar et al. 2019, Zaji and Bonakdari 2019].
He et al. [2014] compared the performance of three of the most popular data-driven techniques, i.e., Artificial Neural Networks (ANN), Adaptive Neuro-Fuzzy Inference Systems (ANFIS), and Support Vector Machines (SVM) in predicting river flow. The authors concluded that the SVM method performed better in simulating rivers in a semi-arid mountain region in China. Chen et al. [2015] applied a Hybrid Neural Network (HNN) based on fuzzy pattern recognition to simulate the Altamaha River. The authors compared three different optimization algorithms to determine the most appropriate HNN parameters and concluded that Differential Evolution (DE) and Ant Colony Optimization (ACO) outperformed the Artificial Bee Colony (ABC) algorithm.
Darras et al. [2017] employed feedforward and recurrent neural networks to forecast flash floods. The authors determined that the recurrent neural network performed better with longer lead time in flash flood prediction and the feedforward neural network performed better in simulating flash floods in short-range forecasting. Yaseen et al. [2017] combined the firefly algorithm with an adaptive neuro-fuzzy computing technique to propose a novel model for estimating of the stream flow. Young et al. [2017] introduced a hybrid model formed of a physically-based hydrologic modeling system and SVM and stated that this model showed good performance in simulating rainfall-runoff during typhoon events.
Alizadeh et al. [2017] combined the wavelet transform with ANN in order to predict rainfall-runoff in the Tolt River. The results showed that this model made appropriate forecasts for one and two months ahead. Zeynoddin et al. [2018] proposed a novel hybrid model to forecast rainfall of a basin with a tropical climate in Malaysia. One of the primary goals of using satellite information is to monitor and forecast the floods in ungauged basins.
The problem with river flood forecasting is that all data-driven models only use in situ information. Hence, because of the direct relation of flood data to the in-situ gauges, regions with no measuring stations cannot provide any information about the river. Nonetheless, the majority of rivers suffer from a lack of in situ stations.
In addition, the number of existing in situ stations in some countries are limited [Calmant and Seyler 2006, Khan et al. 2012, Shiklomanov et al. 2002, Sivapalan et al. 2003, Stokstad et al. 1999]. Hence, studying and forecasting floods is not possible on considerable regions of the earth. Therefore, Predicting in Ungauged Basins (PUB) has recently emerged as a topic of very high interest in flood forecasting [Salvia et al. 2011]. Researchers in this field mainly use satellite information such as space-based precipitation measurements to simulate hydrological circumstances [Brakenridge et al. 2007, Jiang et al. 2014, Khan et al. 2011, Su et al. 2008, Temimi et al. 2011, 2007].
An accurate means of simulating river flow applying satellite information is to utilize passive microwave sensors from the AMSR for Earth Observing System (AMSR-E) [Brakenridge et al. 2007]. Studies in this field began at the Dartmouth Flood Observatory (DFO), followed by the Joint Research Centre (JRC). AMSR-E sensors observe all of the Earth’s surface and detect wet river areas by calculating the differences in land and water brightness temperatures. Raw data is justified by the Global Flood Detection System (GFDS), which is accessible at http://www.gdacs.org/flooddetection.
To predict the rivers water level time series using satellite data, Zaji et al. [2019a] introduced a new approach of minimizing both horizontal and vertical errors. After that, Zaji et al. [2019b] developed a new Evolutionary Polynomial Regression-Time series predictor (EPR-T) and used it to predict the rivers discharge using satellite information. Bonakdari et al. [2019] developed two extensions of the Markov Chain (MC) method, namely Online-Markov Chain (O-MC) and Extreme Online-Markov Chain (EO-MC) to enhance the forecasting performance of rivers discharge using satellite information.
The signals received by satellites are affected by a range of weather conditions [Kugler and De Groeve 2007]. For instance, severe weather alters the emission signals of both land and water. The impact of severe weather is more critical when the water-surrounded area is smaller, which is why space-based signal accuracy is poorer when river discharge is low [Khan et al. 2012]. So, in order to improve the performance and reliability of satellite data, Zaji et al. [2019a] proposed an approach based on trial and error, classification, and outlier detection methods. The authors concluded that the developed method could significantly increase the accuracy of satellite data.
The primary goal of the present study is to introduce a hybrid method that comprises of a multi-objective particle swarm Optimization model, decision tree Classification algorithm, Hotelling’s T2 Outlier detection, and a Regression model (OCOR) for evaluating raw satellite signals to obtain accurate continuous signals. With this method, outlier signals received through severe weather or other unknown environmental situations are initially detected and eliminated. Then the removed signals and those missed due to technical satellite problems are predicted using a regression method.
Previous studies have mainly focused on simulating river discharge using space-based signals [Frasson et al. 2017]. However, when the goal is to use historical information of satellite sensors to forecast the future river discharge, a gap-free continuous space-based dataset is needed [Weigend 2018]. Thus, the second step entails evaluating a continuous dataset of space-based signals with no missed samples. In the training phase of the OCOR method, the in-situ measurements are needed in order to determine one of the objective functions of the multi-objective optimization algorithm and to develop the regression method to replace the detected noisy samples.
2. Space-based signals
AMSR-E and AMSR2 passive microwave sensors are employed in the present study to gather space-based signals [Brakenridge et al. 2007]. After that, the obtained signals are used to measure the river discharge indirectly. In order to obtain more stable observations, the descending orbit method was selected in this study [Kugler and De Groeve 2007, Tekeli and Fouli 2017], and the Earth’s surface was measured at least once a day.
Microwave measurements, which are very sensitive to water, are widely used in the soil moisture estimation field of science [Njoku et al. 2003, Schmugge et al. 1980, Srivastava et al. 2017, Theis et al. 1982, Ulaby et al. 1978, Wang et al. 1982]. By using the microwave signals, river discharge is estimated according to the differences between the thermal emission of dry and wet surfaces. The brightness temperature of the considered wet area is called Measurement (M), which is a proxy of river water and the received information is calibrated applying the surrounding dry area’s brightness temperature (C) to obtain the final AMSR space-based Signal (S) as follows:
| (1) |
According to Bjerklie et al. [2004] and Brakenridge et al. [2012], in most rivers, the discharge has a better correlation with flow width than with the flow velocity. So that, flow width, which is calculated by using the satellite information, could be considered as a robust proxy of river discharge.
3. Study area
In this work, two rivers are examined as case studies, namely the White River and the Willamette River. The properties of these two rivers are presented in Table 1. Both are located in the United States. The White and Willamette River sources are the Boston Mountains and the junction of the Middle Fork Willamette River with the Coast Fork Willamette River, respectively. Figure 1 presents a schematic overview of the in-situ stations and space-based measurement locations for the White and Willamette Rivers. In this figure, area M, area C, and the in-situ measurement station are denoted by blue, gray, and black, respectively.
Schematic overview of the (a) White River and (b) Willamette River locations (Landsat satellite images in false color Composite (7,5,2)).
White and Willamette River properties
| River name | Site ID | Station ID | Space based site coordinates Lat./Long. (dd) | In situ station coordinates Lat./Long. (dd) | Mean discharge (m3/s) |
|---|---|---|---|---|---|
| White, Newberry | 524 | 03360500 | 38.91/−87.07 | 38.92/−87.011 | 12137 |
| Willamette | 925 | 14191000 | 45.18/−123.01 | 44.94/−123.042 | 18928 |
The in-situ station information was collected from the United States Geological Survey (USGS) (http://www.usgs.gov), and the space-based information was obtained from GFDS (http://www.gdacs.org). The time periods examined for the White and Willamette Rivers are from 2009 to 2011 and from 2002 to 2016, respectively.
4. Numerical models
The primary goal of the method proposed in current study is to re-evaluate the in situ and space-based datasets by detecting and replacing their errors. As mentioned in the literature, many studies have addressed calibrating space-based information within situ measurements. However, the poor performance of satellite sensors, in some cases, can lead to inaccurate signals. In addition, satellite or in situ gauges are not always accessible. However, forecasting river discharge using space-based data necessitates a dataset with no gaps, whereby the technique should replace eliminated and missed data with appropriate values.
The OCOR method is introduced in this study to more efficiently (compred to exisiting methods) achieve these goals. The OCOR method involves an outlier detection approach combined with a classification algorithm to detect outliers and inaccurate signals. The OCOR subsequently employs a regression model to evaluate the eliminated and missed information. In addition, the model is justified employing a multi-objective optimization algorithm.
Outlier detection is the science of detecting the abnormal samples by considering the amounts of other samples of the dataset [Mitra et al. 2009]. An outlier detection model tries to identify the Global and Contextual outliers of space-based signals. Global outliers occur when a sample deviates significantly from the whole dataset, and Contextual outliers occur when a sample deviates significantly from nearby samples in that season [Han et al. 2011].
Hotelling’s T2 outlier detection method [Hotelling 1992] is used in the present study. Hotelling’s T2 has been applied as a quality checking algorithm in many studies [Mason and Young 2002, Shabbak et al. 2011, Sullivan and Woodall 1996]. In Hotelling’s T2, the entire dataset is transferred to a hypersphere with radius 𝛼 by using rotation and normalization. Following the mentioned transformations, the samples that satisfy the condition T2⩽𝛼2 are deemed normal, and the remaining samples are considered abnormal. Hence, 𝛼 is a strict criterion of this method.
In the present study, supervised outlier detection is utilized, which, together with Hotelling’s T2 outlier detection, necessitates a classification algorithm [Han et al. 2011]. In supervised outlier detection, the classification algorithm labels the samples as experts, after samples which samples that enlarge the classes are detected as outliers and eliminated from the dataset.
The OCOR method employs the decision tree algorithm, as it is one of the simplest and fastest classification algorithms [Quinlan et al. 1986, 1987, Quinlan and Rivest 1989]. This algorithm has a tree-like shape and comprises three parts. The first part entails internal nodes that make decisions on the attributes; the second part contains branches that represent the decisions made in the internal nodes; and the third part, or the final level of tree nodes, includes leaf nodes that present the class labels. The decision tree employed was introduced by Breiman et al. [1984] as the CART algorithm for measuring training dataset impurity as follows:
| (2) |
Parameters 𝛼 (strict Hotelling’s T2 criterion), m (number of classes), and MPS (decision tree termination criterion) should be determined to attain an optimum model. The optimum position is a model with the lowest number of outlier samples and the highest coefficient of determination (R2) between the satellite signals and in situ discharge measurements. Hence, two goals must be attained, and a multi-objective optimization algorithm is needed.
In the present study, Multi-Objective Particle Swarm Optimization (MOPSO) [Coello and Lechuga 2002] is used. MOPSO is a combination of Particle Swarm Optimization (PSO) [Kennedy et al. 2001, Shaghaghi et al. 2017, Zaji et al. 2015] and the Non-Dominated Sorting Genetic Algorithm II (NSGA-II) [Deb et al. 2000]. The goal of MOPSO is to determine the most suitable 𝛼, m, and MPS values to attain a model that detects the lowest number of outliers with the highest R2.
The final step of the OCOR method is the regression procedure. Here, the satellite-based samples that were eliminated in previous steps are replaced with accurate values. This procedure involves in situ discharge measurements as input samples to the regression model and satellite-based signals as the output samples. Following the elimination, the regression model is trained using the remaining samples, after which it models the eliminated samples.
The OCOR method tries to detect and eliminate as few inaccurate and noisy samples as possible by using a combination of outlier detection, classification, and multi-objective optimization algorithms and after that, replace the eliminated samples using a regression method.
Applying this model before using satellite rivers information is necessary for any further application of them. However, this version of the proposed method has some limitations. Firstly, in this method, the in-situ discharge measurements are used in order to find the highest R2, which is one of the objectives of the optimization algorithm and also for replacing the eliminated samples, which is the last phase of OCOR method.
Therefore, this method is not applicable to ungauged basins. Secondly, this model has only been tested on the AMSR satellite sensors’ information. The footprint size of AMSR is really big (about 8 × 12 km2). The information obtained by this sensor are more suitable for large rivers. Thirdly, in order to use the proposed preprocessing method on other satellite sensors, some justifications should be done to this model. For instance, despite having a high resolution of MODerate resolution Imaging Spectroradiometer (MODIS), the gathered information is more sensitive to the cloudy weather condition, and those images should be eliminated from the dataset separately.
5. Results and discussion
As mentioned earlier, one of the optimal alternatives to river discharge measurement is satellite information. For the satellite signals to be usable, they must undergo a preprocessing phase. The OCOR method entails two phases: preprocessing and calibration. Satellite signals have two major drawbacks. The first is inaccuracy due to poor environmental conditions, and the second is missed signals on account of inaccessibility to the satellite.
Figure 2 presents the in-situ discharge measurements and satellite signals for the two rivers considered. This figure indicates a good correlation between the satellite signals and in situ discharge measurements. However, it is evident that many time periods have no information and there are missed samples. For the White River, besides missed satellite signals, there is a period of time for which in situ measurements were lost.
According to the study area section, in the present study, three years of daily information was used for the White River, and 15 years of daily information was used for the Willamette River. It should be noted that selecting the most appropriated time period for each case study should be done according to the complexity of the considered problem. For instance, according to Figure 2, for the Willamette River, the satellite signals were missed for a long period of time (the black areas). In this case, longer periods of in-situ measurements and satellite signals are needed to evaluate a reliable model.
On the other hand, selecting a longer period of time leads to having more computational time as well, in this case, by using a MacBook Pro with 3.1 GHz Intel Core i7 CPU and 16 GB Memory, the running time of Willamette River model takes about 10 h. However, with the same computer, the running time of the White River model takes about 2 h.
One of the most critical objectives of studies on river discharge is forecasting. Forecasting river discharge via any method requires a continuous dataset with no missed samples. The goal of the preprocessing phase in the OCOR method is to identify inaccurate satellite signals and eliminate them from the dataset. The purpose of the calibration phase in the OCOR method is to re-evaluate the excluded outliers and missed signals in order to obtain a continuous and accurate dataset for use as time series in river discharge forecasting using satellite information.
Satellite signals and in situ discharge measurements for the (a) White River and (b) Willamette River.
An optimum outlier detection model will attain maximum R2 with the least number of eliminated outliers. Hence, there are two aims, and this problem cannot be solved using simple optimization algorithms. In the present study, MOPSO was utilized to adjust three parameters, i.e., MPS, 𝛼, and m, to attain the best model. In the present model, MPS varied from 1 to 500, while 𝛼 and m varied from 1 to 10. Each case study underwent 100 iterations and the population number considered was 300. With multi-objective optimization methods, the best model is selected by using the concept of domination. According to the definition, j = [Goal1j,…,Goalnj] dominates i = [Goal1i,…,Goalni] if all parameters of j are less than or equal to the parameters of i and none of the parameters of j are less than those of i.
In the MOPSO procedure, the non-dominated samples are saved in a repository. The present model repository can save 100 non-dominated samples. Upon reaching this number of samples, the best model is selected manually. Figure 3 illustrates the repository samples for the White and Willamette Rivers as red circles. In this figure, the best models are denoted by blue diamonds. These models evidently represent a good balance between high R2 and a low number of eliminated samples.
Repository samples for the (a) White River and (b) Willamette River.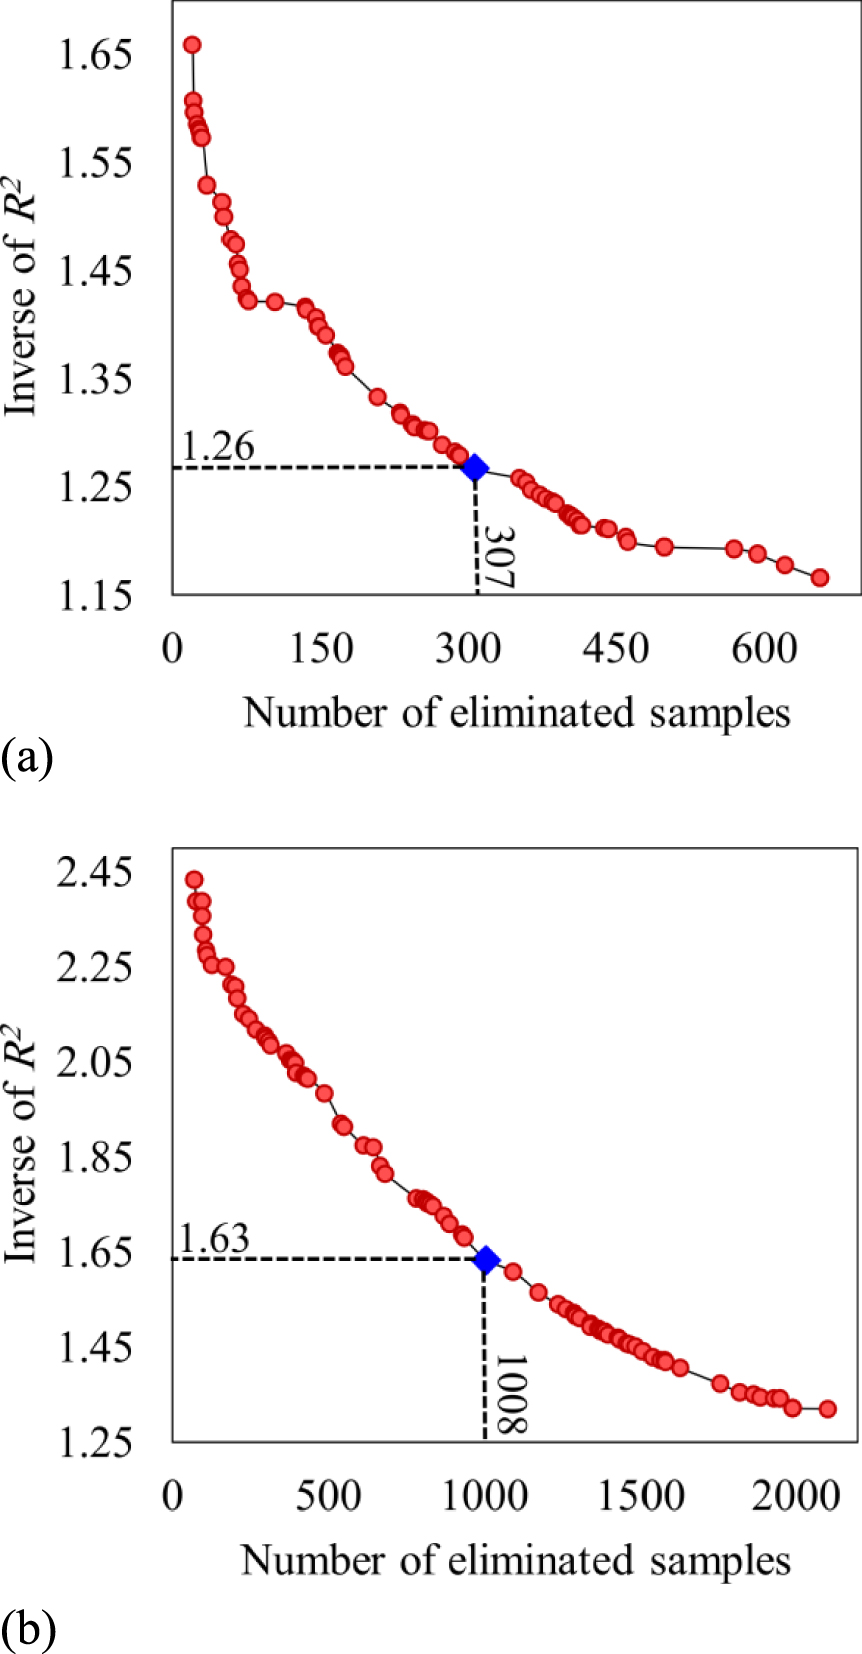
The most suitable model of the White River had MPS of 3, 𝛼 of 1.49, and m of 9, while the best model of the Willamette River had MPS of 4, 𝛼 of 2.18, and m of 10. All samples for these models and the eliminated samples are shown in Figure 4, where the classes are shown in different colors. Moreover, Figure 4 indicates that these datasets were not classified accurately. However, the goal of the present study was not accurate classification, but rather to determine the best outlier samples that increase the R2 of the satellite signals and in situ discharge measurements.
Classification and outlier samples of the (a) White River and (b) Willamette River.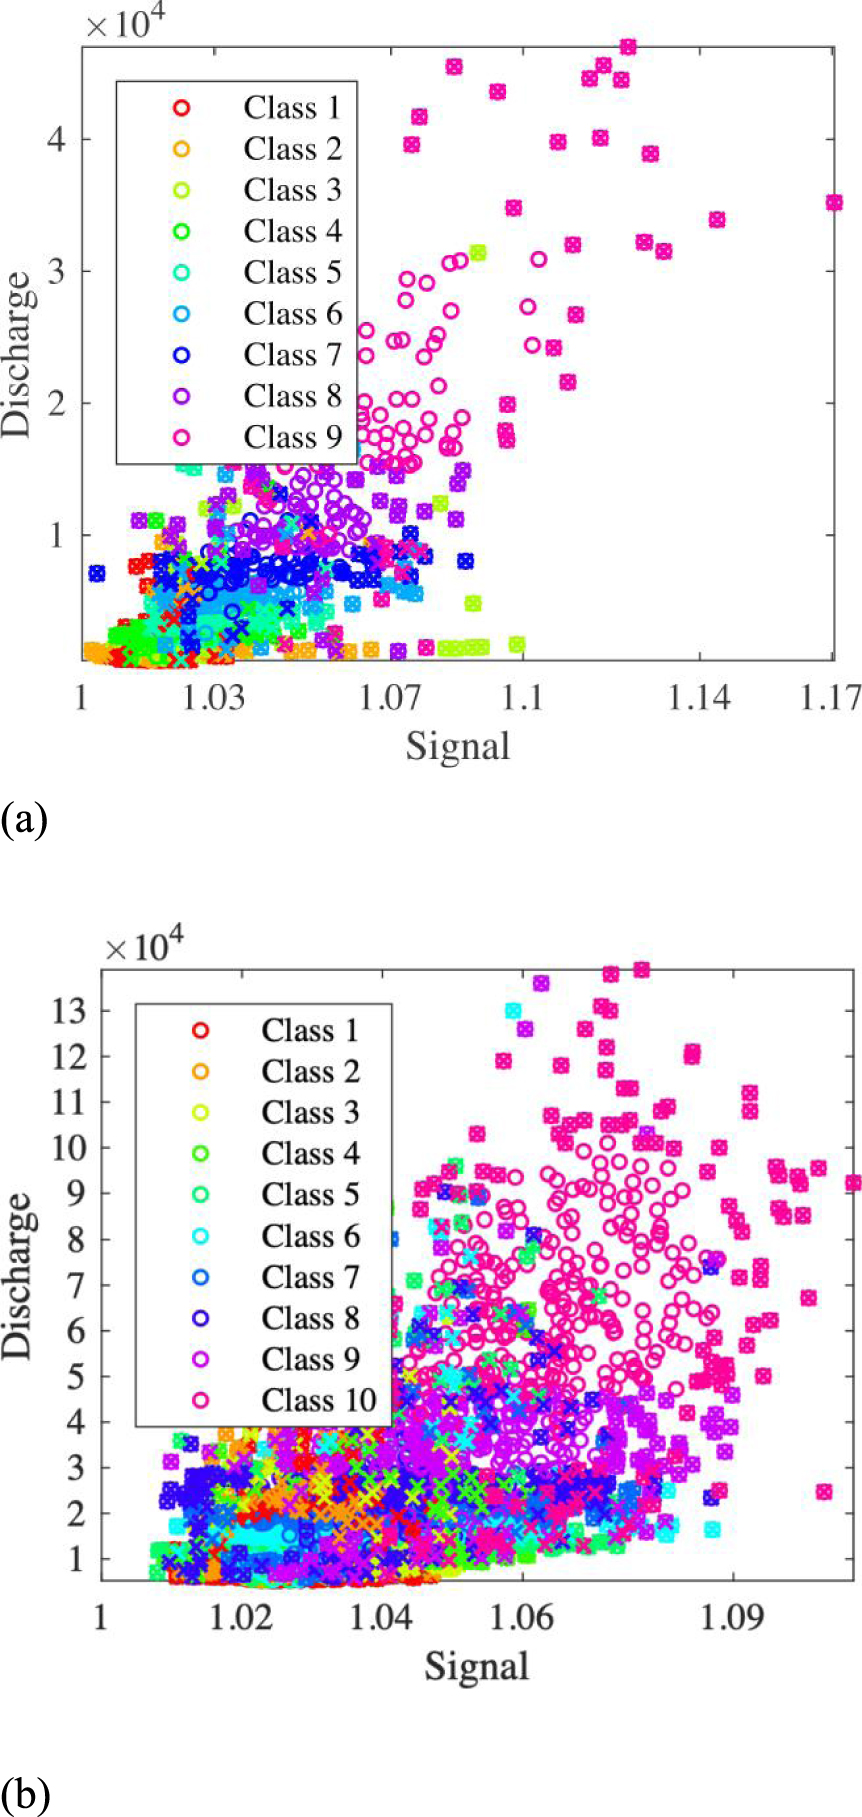
Thus far, a combination of multi-objective optimization, classification, and outlier selection methods were applied to detect and eliminate inaccurate signals from the dataset. The dataset additionally had gaps due to technical satellite problems. In order to fill these gaps, the second OCOR phase done was calibration. In this phase, the missed and outlier signals were evaluated using in situ discharge measurements, which served as nonlinear regression model inputs while the satellite signals were the targets. Following regression model training, the missed and eliminated signals were modeled. The calibration regression equations for the White and Willamette Rivers are given by (3) and (4), respectively, where S represents satellite signal values, and Q denotes in situ discharge measurements.
| (3) |
| (4) |
Values missed because of technical satellite problems are not specified. In situ gauges are also sometimes inaccessible, and the in-situ discharge measurement dataset has lost samples too. In such cases, a regression model can be employed to model in situ discharge measurements using satellite signals.
The signals evaluated for the two case studies are shown in Figure 5. Here, the red points are outlier signals eliminated from the dataset in the OCOR preprocessing phase and replaced in the calibration phase using (3) and (4). The blue points represent satellite signals missed because of technical problems. From this figure, it is evident that the Willamette River has lost signals for a long period of time.
These lost samples were re-evaluated by using the mentioned regression equations. The pink points in the figure for the White River dataset represent sample inputs replacing in situ measurement values missed due to technical gauge problems. For the White and Willamette Rivers, the R2 amounts between the initial satellite signals and in-situ discharges are 0.57 and 0.39, respectively, and the R2 amounts between the developed satellite signals and in-situ discharges are 0.86 and 0.7, respectively. So, using the OCOR method increases the performance of the satellite signals significantly. In addition, in the initial dataset, there are some gaps in the satellite signals and in-situ measurements, which are replaced in the final datasets.
The final dataset of satellite-based signals for the (a) White River and (b) Willamette River.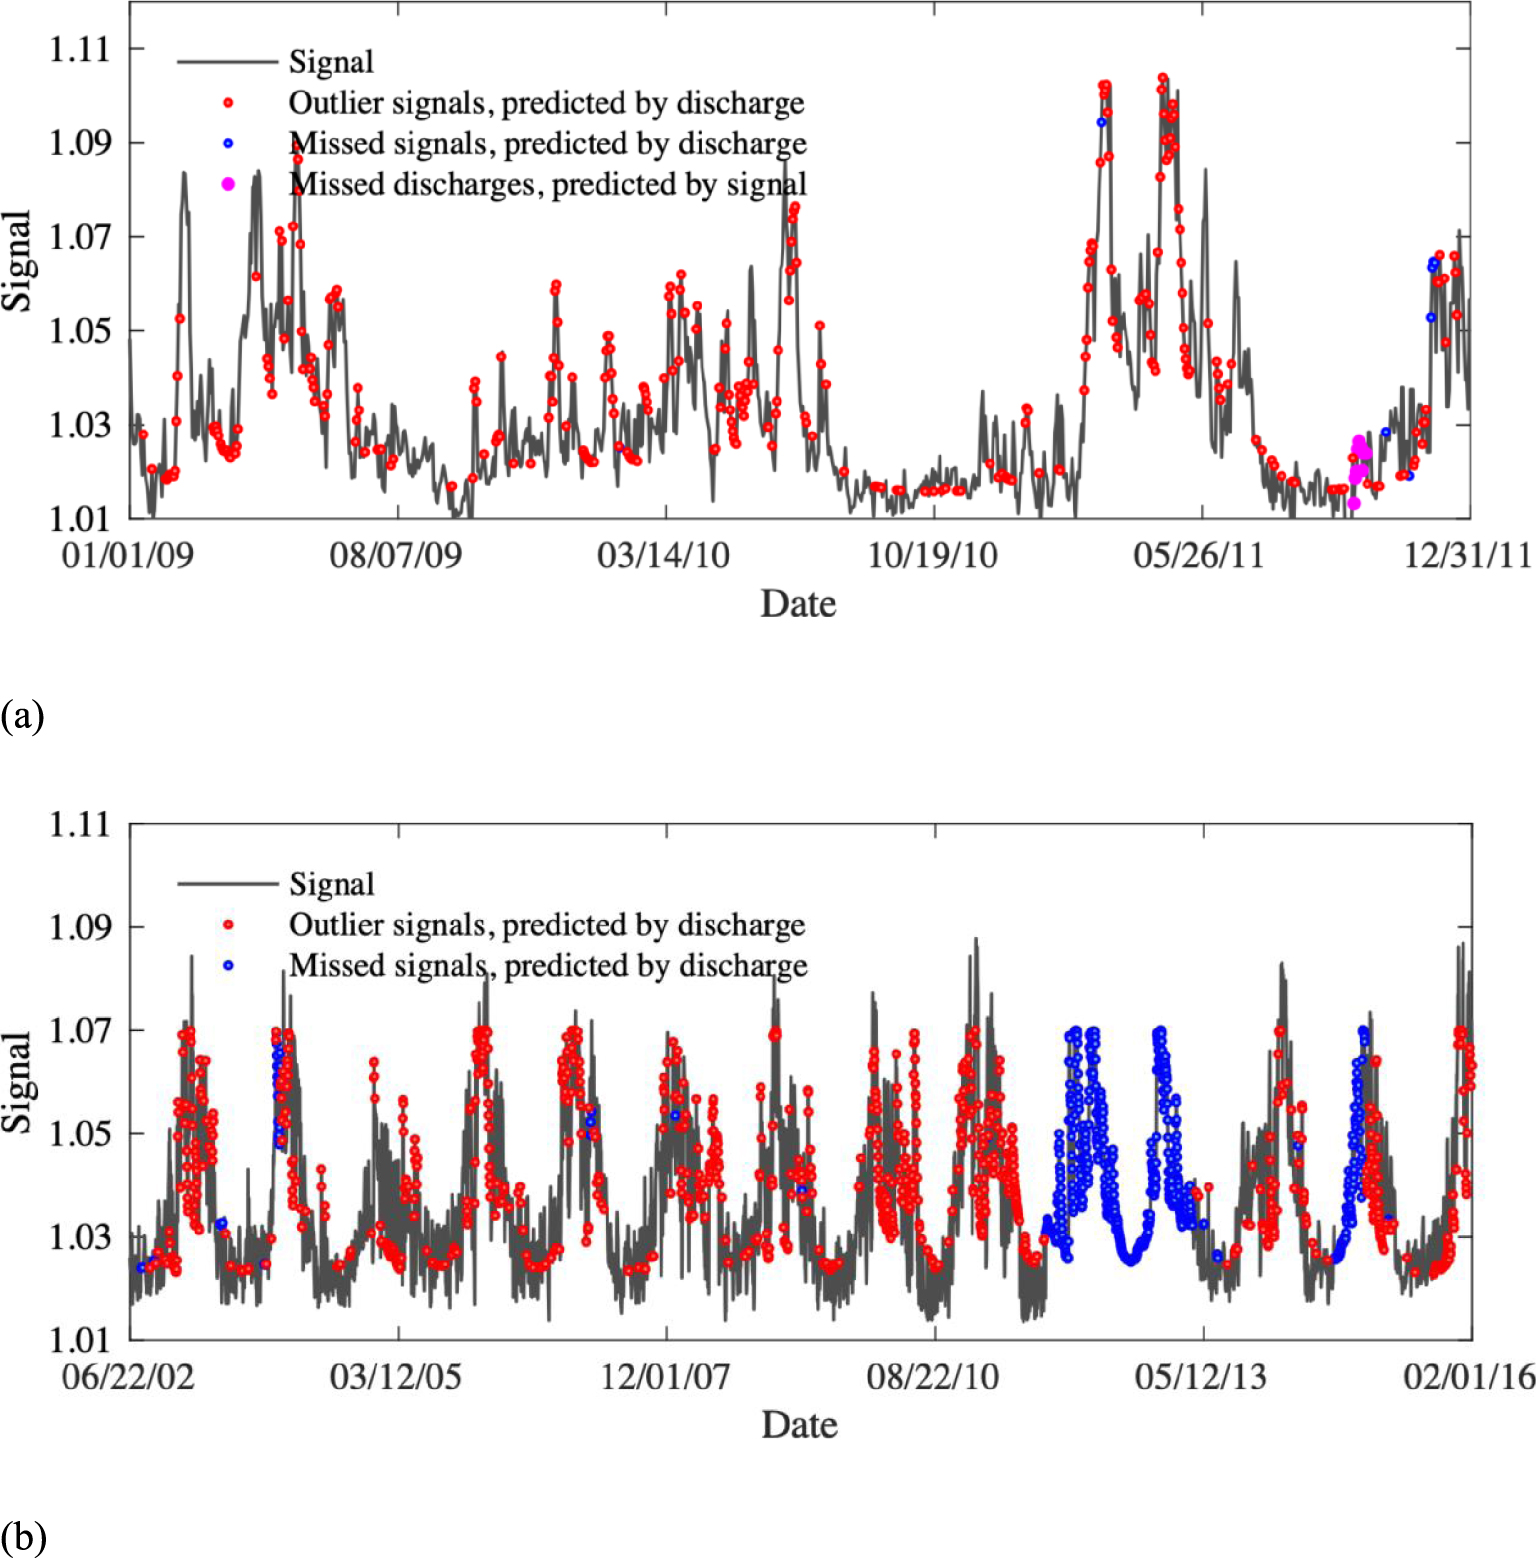
After calibration, the OCOR method has attained the objectives. First, inaccurate satellite signals were detected and eliminated. Second, the missed and excluded signals were re-evaluated using regression models. According to Figure 6, subsequent to these two phases, the satellite signals exhibited an excellent correlation with the in-situ discharge measurements; hence, this dataset can be used as a time series to forecast future river discharge.
Simulations of in situ discharge from the (a) White River and (b) Willamette River using satellite signals.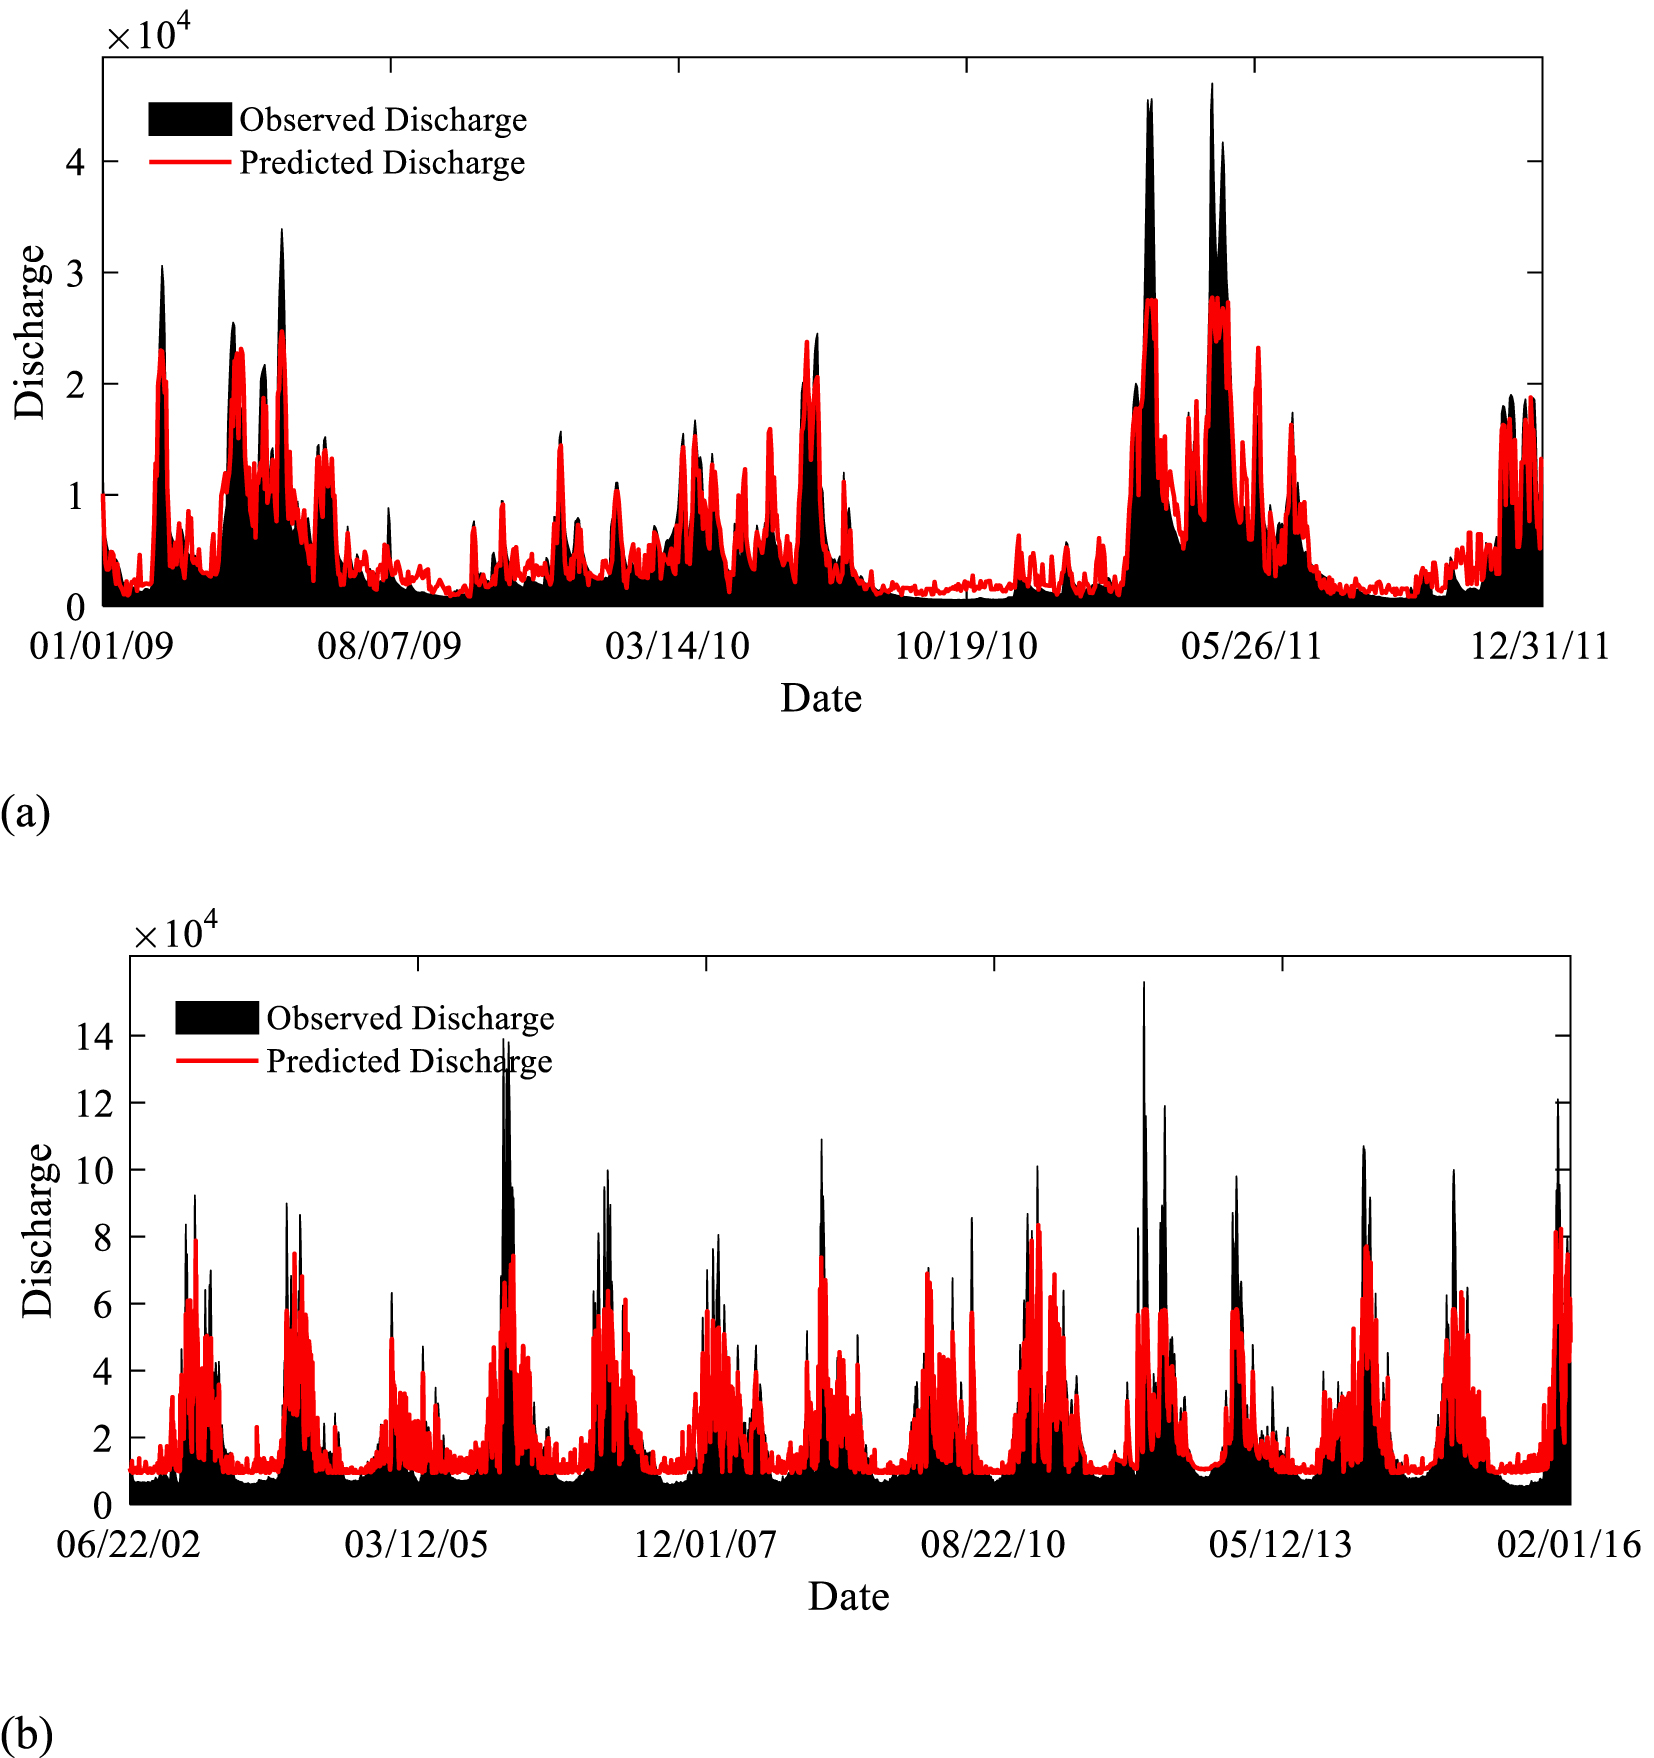
Finally, the OCOR method is used to distinguish between the normal water level of rivers and the flood water levels. In this theory, which was used in the field of satellite-based flood detection by DeGroeve and Riva [2009b], the Flood Magnitude (FM) is defined using the following equation:
| (5) |
| (6) |
| (7) |
Histograms of the Willamette and White Rivers’ FM datasets.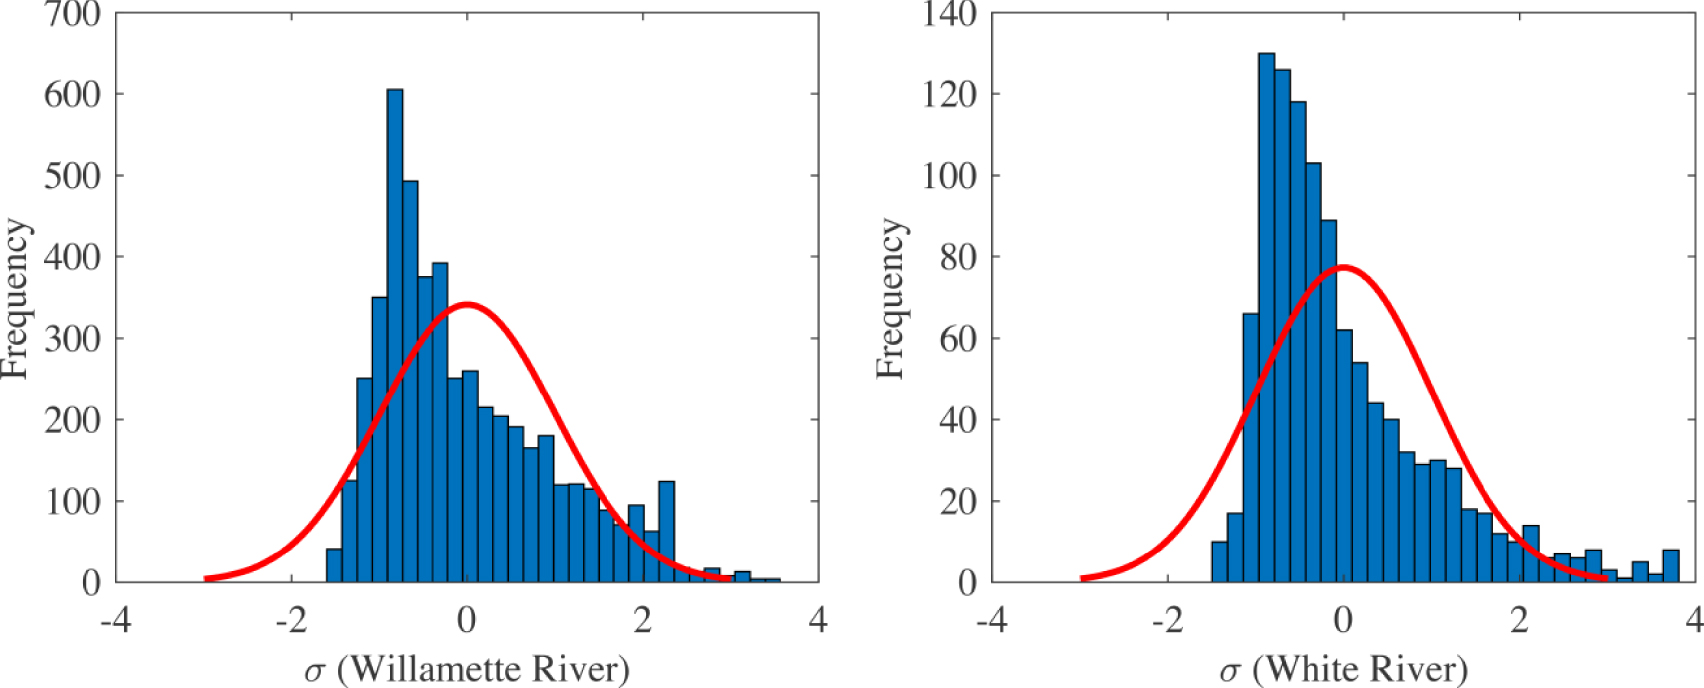
6. Conclusion
One of the most worthwhile aims of flood disaster management is to provide real-time flood water level forecasting for early warning evacuation plans to save lives. Various studies have been recently conducted in this field of science. Satellite-based signals are becoming more readily available and cost-effective method to monitor a vast network of rivers during major storm events. In this study, a novel method is proposed to improve the accuracy of satellite-based water level forecasts, comprising a multi-objective particle swarm Optimization model, decision tree Classification algorithm, Hotelling’s T2 Outlier detection, and a Regression model (OCOR). The new OCOR method can effectively identify inaccurate satellite signals and replace them with reasonable values.
Two case studies were selected to showcase the novel application of the new OCOR method, including the White River and the Willamette River, located in the United States. In total, 307 White River samples and 1008 Willamette River samples were identified as outliers or missing data due to satellite technical problems. Upon eliminating these samples, the satellite-based signals were successfully calibrated with the in situ hydrometric gauge data, and the deleted signals were gap-filled using the calibrated regression model. Hence, all dataset gaps were filled with satisfactory values. The final results demonstrate a superior correlation between in situ measurements and satellite-based signals following the OCOR model application and can be used as a cost-effective method for tracking water levels in vast river networks during major flood events for early warning evacuation plans to save lives.