


 CC-BY 4.0
1. Introduction
Statistical analysis of temporal relationships between large earthquakes and volcanic eruptions suggests that seismic waves may trigger eruptions over great ( >1000 km) distances from the epicenter, but a robust relationship between volcanic and teleseismic activity remains elusive [Avouris et al. 2017]. When a large earthquake occurs near an active volcano, there is often concern that volcanic eruptions may be triggered by the earthquake [Nishimura 2017]. The key to understanding earthquake volcano interactions is the response of gas and magma to earthquake-imposed stresses [Kennedy 2017]. Different types of earthquake-induced activity changes may occur in volcanic areas. In some cases, new eruptions begin local volcano-seismic events or degassing increases, groundwater pressure or geyser eruptions and hydrothermal activity enhance [Walter et al. 2007, and references therein]. [Kriswati et al. 2019] propose upon working on Sinabung eruptions of 2010 and 2013 that the earthquake triggering of eruptions appears to only take place in unusual situations in which the volcano in question was already pressurized and primed for eruption, such that a very small change in dynamic or static strain could trigger magma ascent. Similar arguments have also been proposed by Walter and Amelung [2007] and Manga and Brodsky [2006] [Kriswati et al. 2019]. An acceleration in processes such as volatile diffusion, bubble nucleation, coalescence, rise, shaking free of bubbles clinging to individual crystals, and sloshing may all contribute and cascade toward increased rates of convection and degassing [Kennedy 2017 and references therein]. Eggert and Walter [2009] mention that the time between a tectonic earthquake and a volcanic eruption may vary from a few seconds to years. They also indicate that the distance between the events can reach up to thousands of kilometers, but is most evident in the near-field, till to some tens of km.
An earthquake with Mw 5.1 occurred at 22h08 on September 20, 2020. Obruk village of Niğde province in central Turkey was specified as the epicenter (Figure 1). A large number of monogenetic volcanic vents are found around the investigated area and these vents are arranged along certain lines (Figure 1). The event was recorded by KOERI (the Bogazici University–Kandilli Observatory and Earthquake Research Institution, Regional Earthquake–Tsunami Monitoring Center) and AFAD (Ministry of Interior, Disaster and Emergency Management Presidency, Earthquake Research Directorate), two National Earthquake Recording Networks. In this article, we use the freely shared seismic data, recorded between September 20, 2020 and October 20, 2020, of both AFAD and KOERI seismic networks. Besides, for the Turkey earthquake catalog covering the whole period of instrumental records of seismic events covering the years 1900–2020, we used KOERI catalog, as AFAD network is operational since the 1970s [Çıvgın and Scordilis 2019]. According to AFAD seismic network records, one earthquake occurs before the mainshock, followed by 93 aftershocks (totally 95 events in AFAD). Besides, KOERI recorded a total of 117 records, including four precursor earthquakes and 112 aftershocks in one month.
(a) Location of Obruk–Zengen–Eğrikuyu segment (OZES) in Central Anatolia on NASA STRM DEM (www.earthdata.com; Last access: October 2020). (b) Epicenter of the Bor Mw 5.1 is located east of the Obruk village. Cinder cone and maar alignments and lineaments are shown on Landsat 8 false color image (R: band 3, G: band 2, B: band 1). (CAP: Central Anatolian Plateau, CAVP: Central Anatolia Volcanic Province, TFZ: Tuzgölü fault zone, NAF: North Anatolian fault, EF: Ecemiş fault, EAF: East Anatolian fault).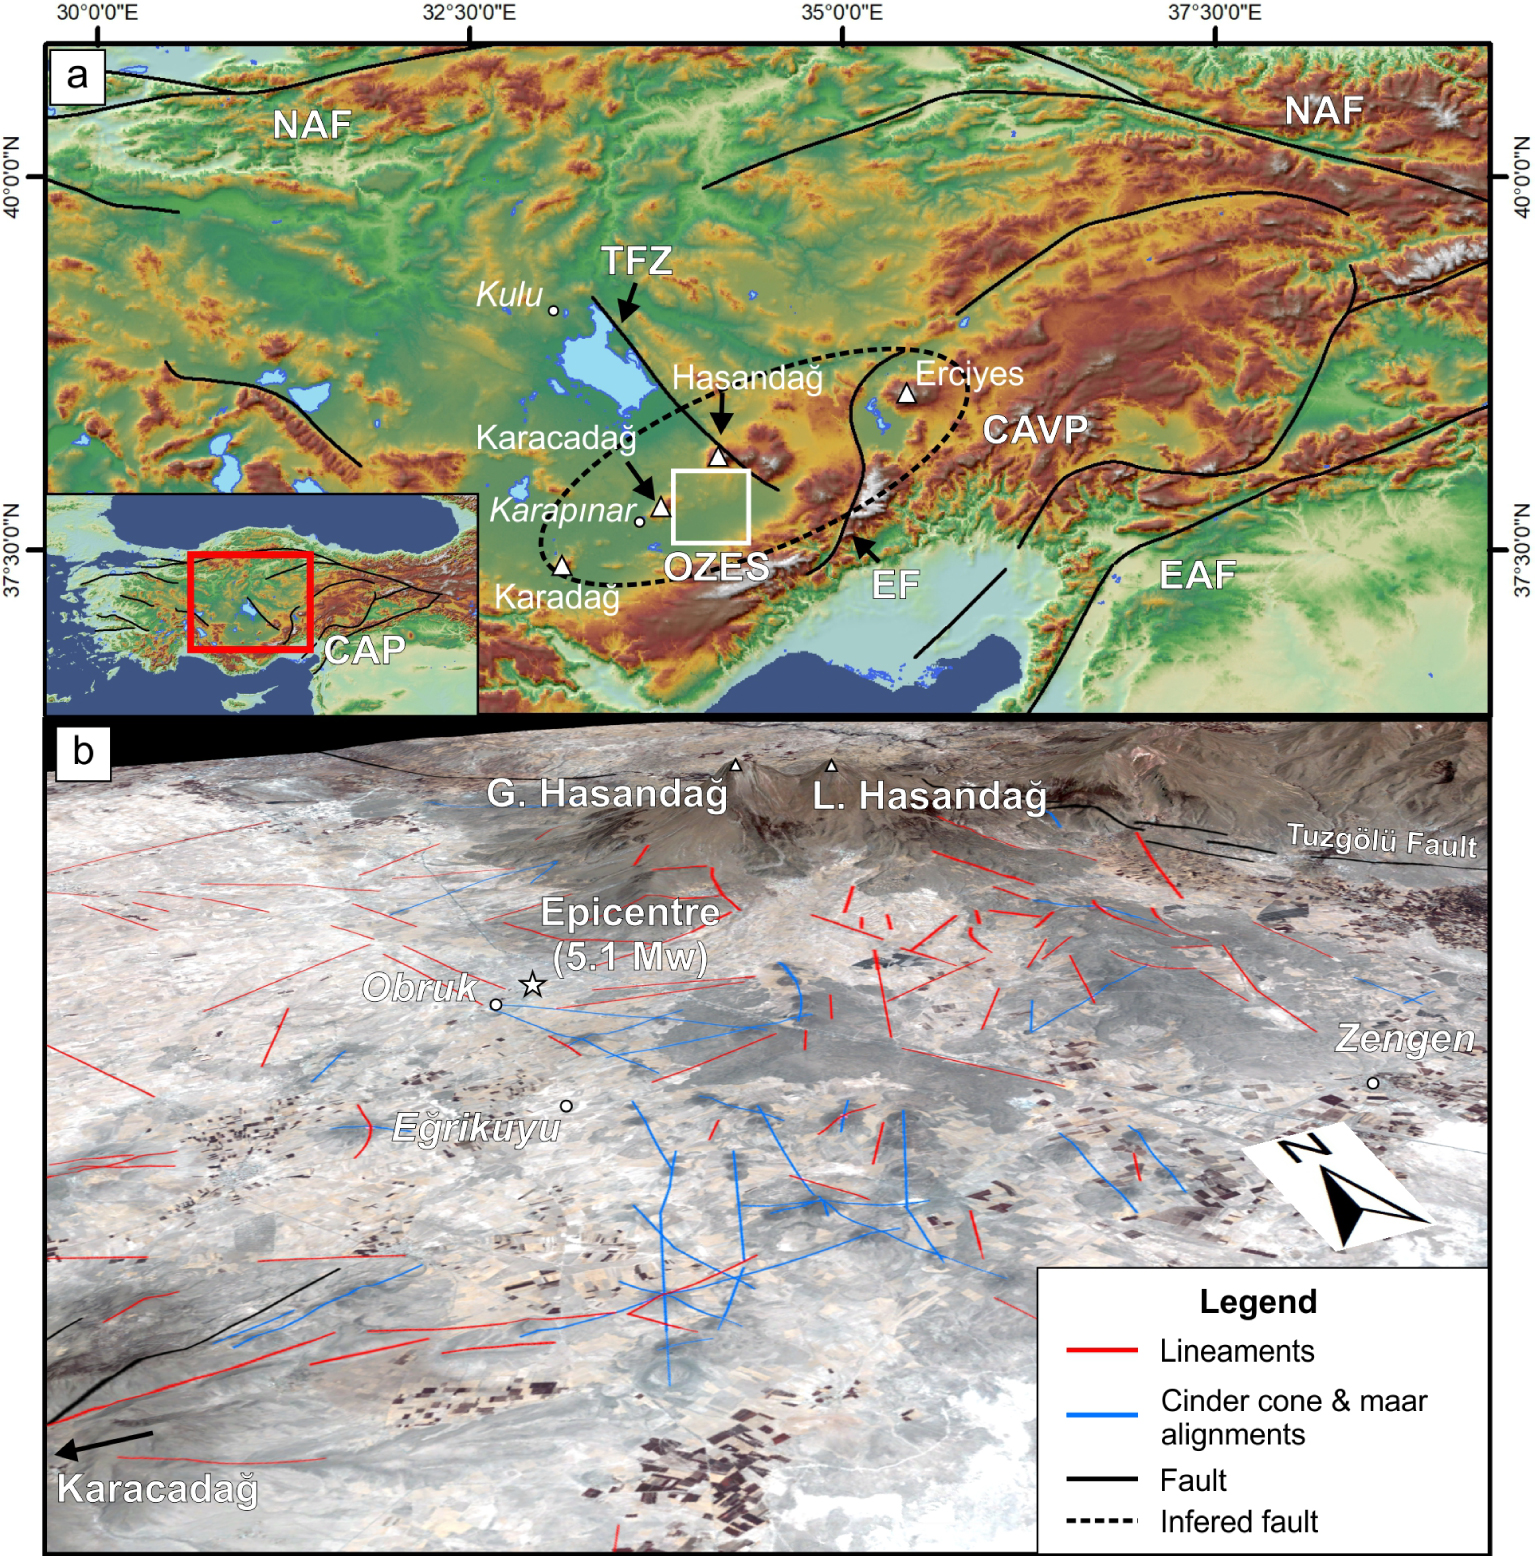
Obruk seismic activity occurred in an area where around 103 monogenetic volcanoes are gathered along mainly NW–SE and NE–SW alignments (Figure 1b). It is also located at the southwestern foot of Hasandağ stratovolcano (35 km from the summit) and close to the Tuzgölü fault zone (TFZ) (almost 50 km from the main segment), one of the main tectonic elements of the region. Kürçer and Gökten [2014], investigated neotectonic period characteristics, seismicity, geometry, and segmentation of the TFZ using the earthquake catalogs of the KOERI and AFAD (former Institute of Earthquake Research National Earthquake) networks, covering the years 1900–2011, they compiled 4151 events in and around TFZ and relate 203 events directly to the fault. We also plotted the earthquake epicenters for 120 years on a digital elevation model (DEM), using the catalog from KOERI that covers the years between 1900–2020. We give more details on the concerned catalog in the data section. Obruk seismic swarm fills a seismic gap in a place where no seismic activity has been observed in the last 120 years (Figure 2), this gap is also mentioned in KOERI [2020]’s Obruk Earthquake Report. Soysal et al. [1981], who compiled historical earthquakes (between 2100 BC and 1900 AD, for 4000 years) in this region in question, did not find any records. As the swarm happened, where the monogenetic volcanic vents are numerous and it is also very close to active–subactive Hasandağ stratovolcano, we evaluate this swarm more closely and examine its possible volcanic consequences. For this purpose, we aimed to investigate Obruk seismic events in volcanological point of view, to define the volcanic unrest on and around the active/subactive Hasandağ stratovolcano, and to determine the potential volcanic hazard and risk.
(a) Seismic activity of the region between 1900–2020 have been plotted on NASA STRM DEM according to KOERI database (Last access: October 2020, http://www.koeri.boun.edu.tr/sismo/2/tr/). (b) Mainshock of Obruk events and aftershock locations of AFAD database. Our gas sampling points are demonstrated. The nearest seismic stations are illustrated with triangles.
2. Geological setting
The Central Anatolian Plateau (CAP), Turkey is an orogenic plateau and represents numerous volcanic vents with different ages from Miocene to Quaternary (Figure 1a). The plateau reaches to 1500 m above sea level and has been uplifted by as much as 1 km since 8 My [Aydar et al. 2013]. The CAP, with a surface area of 800 km by 400 km, an average height of ∼1 km, low relief ( >300 m) is one of the world’s major plateaus [Okay et al. 2020]. The CAP is internally deformed and cut by numerous faults [Toprak 1998; Özsayın et al. 2013]. The 135-km-long TFZ, with its N30–40W strike and SW- and NE-dipping fault planes, is one of the most important fault zones in Central Anatolia and it stretches from the town of Kulu to Hasandağ Volcano [Özsayın et al. 2013] (Figure 1a). The network of faults in Central Anatolia is organized along with two main directions: NNE–SSW and NW–SE [Aydar et al. 1995] and these faults affect the recent Quaternary volcanic structures such as the Hasandağ [Aydar 1992]. The Central Anatolia Volcanic Province (CAVP) is a NE–SW trending volcanic arc extending from Karapınar to Erciyes and is parallel to the elongation of the eastern Anatolian fault and the Ecemiş fault (Figure 1a). Besides, it is also cut by the NW–SE trending Tuzgölü fault. Two fault systems exist in the province: One system (Miocene–Quaternary Tuzgölü—Ecemiş system) is oblique, whereas the other system (late Miocene–Pliocene CAVP system) is parallel to the long axis of the CAVP [Toprak 1998]. The volcanic vents have been emplaced in the CAVP with tectonic control [Toprak and Göncüoğlu 1993; Dhont et al. 1998]). According to volcanic vent types and sectors, the CAVP region is divided into different segments. Aydar et al. [1993, 1995] divided the CAVP into Karapınar (basaltic monogenetic vents: cinder cones, maars), southern sector of Hasandağ, Acıgöl, Derinkuyu, and Erciyes sectors. The monogenetic vent field located at the south of Hasandağ is called under different names in different studies as; Toprak [1998] calls as Karacadağ–Hasandağ cluster; Uslular et al. [2015] named as Eğrikuyu sector based on Notsu et al. [1995]’s work; Reid et al. [2017] regrouped this region as Hasandağ cluster, and recently, Doğan-Külahçıet al. [2018], gave the name of Obruk–Zengen. To be more explicit, we employ the term (using the name of nearby villages) Obruk–Zengen–Eğrikuyu sector (OZES) in this paper for the field of monogenetic volcanoes located between Karacadağ and Hasandağ (Figure 1). Arcasoy [2001] counted 103 cinder cones within OZES. Besides, Uslular et al. [2015] investigated the size distribution of 77 scoria cones by statistical methods. Moreover, we can add at least four more visible maars and tuff rings to the vents of the sector. The monogenetic vents of OZES align along three different directions as NE–SW, N–S, and NW–SE [Toprak 1998]. A relationship between earthquakes and the geological structure of the earthquake area has already been evidenced by the study of lineaments in Arellano-Baeza et al. [2006]. The alignment of the vents suggests that their emplacements are directly controlled by the main fault systems in the region [Uslular et al. 2015]. However, the scoria cones clustered near TFZ change their directions from NW–SE to N–S [Toprak 1998].
Reid et al. [2017] provided new Ar/Ar ages for the basalts of OZES which mostly cluster between 0.2 and 0.6 Ma, but some scoria cones are as old as 2.5 Ma. Besides, Doğan-Külahçıet al. [2018] also gave some new K/Ar ages for the monogenetic vents located west and northwest of Hasandağ. They dated the basaltic lava flow related to the Karacaören cinder cone in the western foot of the Hasandağ as 2000 years old using the K/Ar method. We quote here that numerous seismic events happened near this youngest cinder cone. Aydar and Gourgaud [1998] obtained an age of 34,000 years (K/Ar) from the basaltic area to the northwest of the Hasandağ.
Moreover, Friedrichs et al. [2020] provided new zircon ages for Hasandağ yielding between 91.9 ± 3.9 Ka and 13.5 ± 1.5 Ka and they proposed based on Late Pleistocene recurrence of at least one eruptive phase every ca. 5–15 Ka. Also, Schmitt et al. [2014] dated the pumice collected from the summit of Hasandağ to 9000 years. Kuzucuoğlu et al. [2020] have also provided some new K/Ar ages with a literature chronology compilation and they gave 0 age for a summital dacite lava. Another youngest age obtained in Hasandağ volcanism so far is 6000 years old lava from a lava dome of northern flank, provided by Aydar and Gourgaud [1998].
We wish to emphasize here that the karstic sinkholes, which are common in the Central Anatolia Region, are locally named as Obruk. However, Obruk, which gave the seismic swarm its name, is not a karstic structure, but a maar crater formed by the phreatomagmatic explosions [Aydar 1989; Aydar et al. 1993].
3. Data and methodology
3.1. Data
At the end of one-month seismic period, we requested more detailed information from AFAD and KOERI officials regarding these earthquakes that they did not publish on their websites, and they sent us the revised versions of these events. Çıvgın and Scordilis [2019] compared these two networks taking into account the historical development of these two national networks. Rojo-Limón et al. [2021] have recently seismologically compared the catalogs covering the years of 2006–2017 of those two seismic networks and tried to explain the reason for inconsistencies between two networks. On the other hand, scientific reasons for the differences in solutions between the two networks (KOERI and AFAD), including the earthquakes in the region in question can be summarized as follows (Pers. Comm. Dr. M. Nurlu, Head of Earthquake Department-AFAD);
- Institutions use different mathematical algorithms,
- Different geometric distribution of stations used by institutions,
- The ground factors where earthquake monitoring stations are located,
- The difference in speed models used (different crust models),
- Different types of magnitude used (such as Mw, ML, and Md).
We present the earthquake data recorded by both seismic networks, horizontal and vertical errors, azimuthal gap values, epicenter coordinates, magnitude, number of stations recording the event concerned, separately in Table 1 for AFAD and Table 2 for KOERI in Supplementary materials.
Besides, Kalafat [2016] provides a statistical evaluation of earthquake data of KOERI catalog covering the years between 1900–2015. Completeness magnitude (Mcomp) value is decreased from 1.8 to 2.4 toward Tuzgölü (Salt lake) region with reflecting increasing network sensitivity [Kalafat 2016], besides, Mcomp was computed as Mc = 2.0 for almost all parts of Turkey with a b-value of 1.01 ± 0.05 by Cambaz et al. [2019], based on the investigation of 2013–2017 KOERI catalog. While AFAD has been active since 1970, KOERI has been recording seismic events since 1900. Therefore, the catalog of KOERI covering the years between 1900–2020 was used in this study. AFAD, although newer, has a wider network with 679 seismic stations (Figure 3a) than KOERI with 242 stations (Figure 3b). We give in Supplementary materials recorded earthquakes by these networks and the list of whole seismic stations. Five nearest stations of both networks are given in Table 1 that the mainshock happened approx. 38 km and 40 km from the nearest station of KOERI and AFAD, respectively.
Location of national seismic networks belong to two institutions (a) AFAD Network (Ministry of Interior, Disaster and Emergency Management Presidency, Earthquake Research Directorate, (b) KOERI (the Bogazici University–Kandilli Observatory and Earthquake Research Institution, Regional Earthquake-Tsunami Monitoring Center).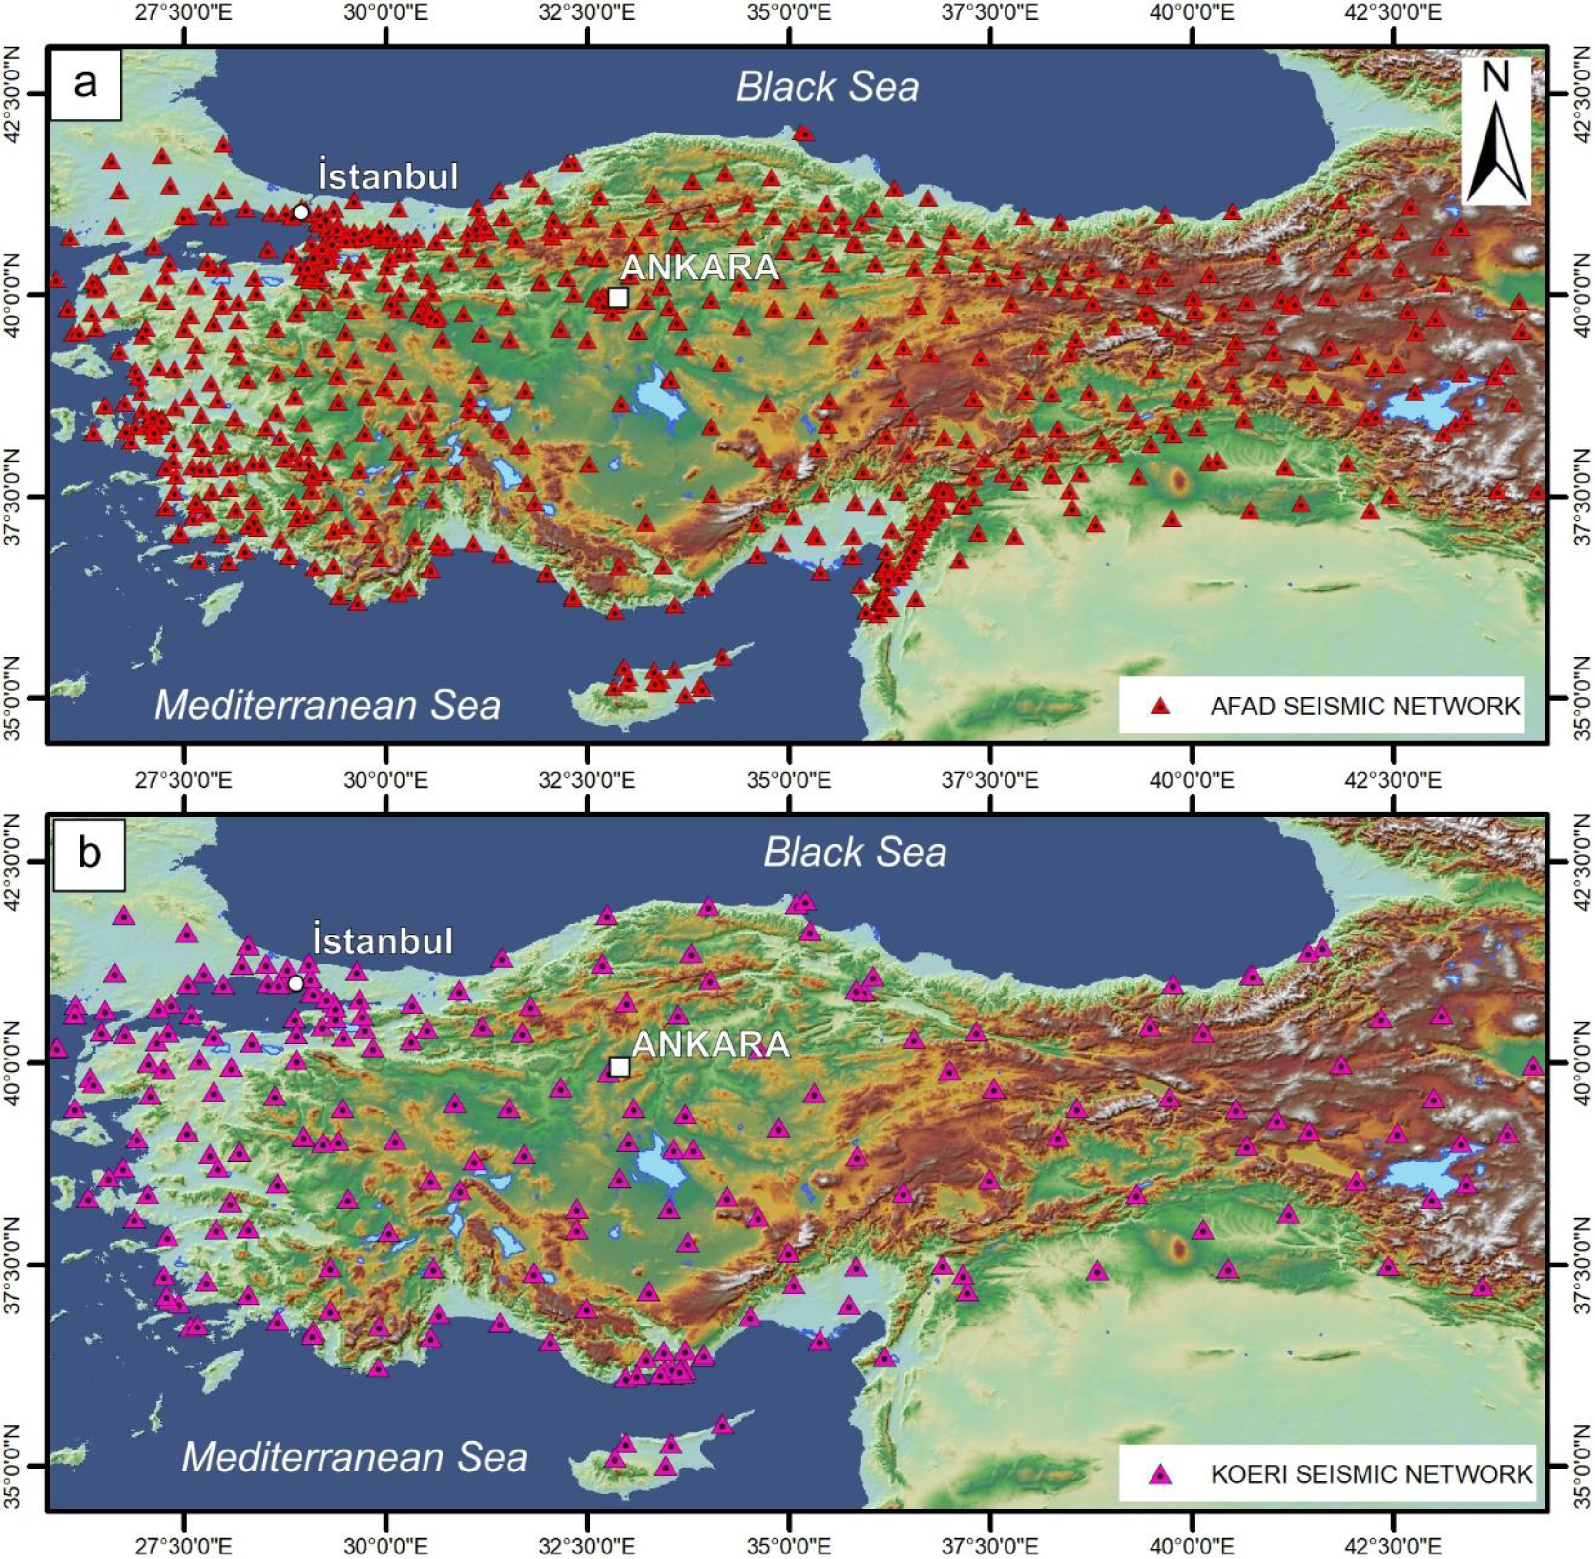
For Obruk events, AFAD gives Mw 5.1 for the mainshock upon the records of 36 stations. According to their data set, GAP is 34° and RMS is given as 0.8 s. The hypocenter errors are as follows: horizontal error (HERR) is between 0.25–4.49 km with an average of <0.9 km; while vertical error (VERR) ranges between 0.8–6 km with an average of <0.9 km (Supplementary materials Table 1).
Nearest five stations to Obruk mainshock epicenter of KOERI and AFAD networks
| KOERI | |||||||||||
|---|---|---|---|---|---|---|---|---|---|---|---|
| Code ID | Network | Serial No | Latitude | Longitude | Elevation (m) | Approx. distance (km) | Location | Sensor | Period | Sensor | Model |
| CMRD | KO | T5CH4/A4178 | 37.6623 | 34.9902 | 1234 | 94.74 | Çamardı-NİĞDE | 20131206 | 5T | CMG-DM24 | Accelerometer |
| GULA | KO | T6997/C874 | 38.3444 | 34.2360 | 1126 | 48.33 | Gülağaç-KONYA | 20090601 | 6T | CD24 | Speedometer |
| NIG | KO | T5V27/C1559 | 38.1080 | 34.6142 | 2270 | 52.10 | NİĞDE | 20111123 | 5T | CD24 | Accelerometer |
| SULT | KO | T3X67/A615 | 38.1988 | 34.5157 | 982 | 38.78 | Sultanhanı-AKSARAY | 20080104 | 3T | DM24 | Speedometer |
| YESY | KO | T6998/C870 | 37.7825 | 33.7432 | 1206 | 37.68 | Yeşilyurt-KONYA | 20090601 | 6T | CD24 | Speedometer |
| AFAD | |||||||||||
| Code ID | Network | Station | Latitude | Longitude | Elevation (m) | Approx. distance (km) | Location | Model | |||
| 2136 | TK | 4206 | 37.5251 | 34.0484 | 1032 | 53.94 | Ereğli-KONYA | Acceleration | |||
| 120 | TK | 5102 | 37.9678 | 34.6730 | 1229 | 56.07 | Merkez-NİĞDE | Acceleration | |||
| 648 | TK | 6801 | 38.3709 | 34.0270 | 980 | 39.96 | Merkez-AKSARAY | Acceleration | |||
| 1004 | TK | 5001 | 38.6605 | 34.7332 | 1140 | 94.35 | Merkez-NEVŞEHİR | Acceleration | |||
| 984 | TK | 3303 | 37.1659 | 34.6004 | 1225 | 86.19 | Çamlıyayla-MERSİN | Acceleration | |||
After the preliminary solutions, KOERI has revised the mainshock event from 5.4 to 5.2 Mw which is recorded by 79 stations. In these revised values, they give 34° for GAP, 0.5 km for ERH, 0.2 km for ERZ, 0.35 s for RMS for the mainshock. The margins of error in the hypocenter analysis of KOERI for all seismic movements are as follows: ERH varies between 0.2–2.2 km, while its average is <0.77 km and ERZ values are between 0.1–2.1 km with an average of <0.24 km (Supplementary materials Table 2).
3.2. Methodology
A 30 m resolution Shuttle Radar Topography Mission (SRTM) DEM (www.earthdata.nasa.org) have been used in this study. The epicenters of earthquakes have been plotted on DEM. Also, cinder cone lineaments have been digitalized in order to compare them with earthquake alignments. Our method is to determine whether there is any correlation between lineaments (structural and monogenetic vents) and earthquake clusters. The epicenter of events appears as clustered in a certain location of southwest Keçikalesi caldera. The K-mean algorithm developed by MacQueen [1967], was used to determine the preponderant orientation of this cluster. K is a user-defined parameter and represents the number of clusters. Although K-mean clustering provides separation into more than one cluster of data, in this study we used it to create a single cluster (K = 1), then, the elongation of the earthquake cluster was drawn on the map. For the monogenetic vent alignments, we used the nearest-neighbor directions of identified vents with the formula of Clark and Evans [1954], inspiring from Von Veh and Németh [2009] study and gave the details in the relevant chapter.
We have also drawn structural and monogenetic vent lineaments in the study area to make comparison with the elongation of the earthquake cluster using DEM and satellite images. To better understand the similarity between the orientations of each lineament (structural, cinder cone), rose diagrams have been created using free open-sourced Orientation Analyst Tool [Kociánová and Melichar 2012] for ArcGIS software.
We used synthetic aperture radar interferometry (InSAR) to derive deformation maps related to the Obruk earthquake swarm. Sentinel-1 radar imagery (Copernicus Sentinel data, 2020. URL: https://scihub.copernicus.eu/) was used to generate interferograms using radar images predating and following seismic events. Sentinel-1 descending orbit imagery pair dated September 10 and September 22, 2020 acquired on track 94, and descending orbit imagery pair dated September 9 and October 3, 2020 acquired on track 87, were used to produce coseismic interferograms. Line-of-sight displacement (LOS) were calculated for different pair images using the standard procedure utilizing SNAP toolbox of the European Space Agency (SNAP – ESA Sentinel Application Platform v7.0.4, http://step.esa.int). For the displacement mapping, image pairs were coregistered, interferograms and coherence images were generated, after the topographic phase removal and Goldstein phase filtering, the SNAPHU [Chen and Zebker 2000, 2001, 2002] was used to unwrap the phase. The SRTM 1 arc-second global digital elevation model was used for the processing. The unwrapped phase was converted to LOS displacement and the data was geocoded using range doppler terrain correction. A coherence mask ( <0.4) was used in the presented LOS images.
CO2, SO2, H2S, and radon gas measurements were made from the gas outlets at the Hasandağ summit. In addition, the same gas analyses were carried out in Keçikalesi region, which is located at the southern foot, very close to the earthquake swarm.
For radon gas measurements, we did not dig any hole to emplace our device. Such kind of method cannot reflect natural exhalation due to the vacuum effect of a hole in a closed media, plus pumping the radon which has individually less mobility can increase artificially radon concentration (method from Aydar and Diker 2021). A PVC bucket was used instead of a sealed chamber, and we waited for 10 min for air stabilization in the plastic bucket and started taking measurements. Radon Eye+ is a pulsed ion chamber type device and is a real-time smart radon detector which has a high sensitivity 0.5 cpm/pCi/l. The maximum concentration it can measure is 9700 Bq∕m3 of radon and the first reliable data can be obtained from 60 min of the measurement [Aydar and Diker 2021].
H2S, SO2 gases were measured in Industrial Scientific Ventis MX4 portable gas detectors. While measuring from the gas outlet at the summit, the gas was drawn from the chimney using the gas suction pump and hose. The detector can measure up to 500 ppm for H2S, 150 ppm for SO2, with an accuracy of 0.1 ppm.
CO2 gas degassing have been measured on-site using Vernier Lab Quest CO2 sensor. The sensor measures the level of the CO2 gas using infrared radiation that performs in a narrow band range centered on 4200 nm wavelength. CO2 gas must be diffused through the vent holes to reach the sensor tube. Measurements can be done in low range or high range (0 to 10,000 or 0 to 100,000). Accuracy of the measurement changes for low and high ranges, 10% and 20%, respectively. Besides, the resolution is 3 ppm for low range and 30 ppm for high range. The instrument needs a warm-up time about 0 s and the first response for the measurement will be in 120 s. Maximum reading time is 10 min, but the measurement may be terminated when the CO2 value is fixed on the graph. Measurements were carried out in the high range setting of the equipment, the sensor was placed into an open-bottomed 250 ml Nalgene bottle and the measurement was made until the full saturation condition is met.
4. Results
4.1. Seismic events
Seismic activity, which started on September 20, 2020, is still continuing at the time of writing this article, albeit at a slower rate. It also reached its peak in the first two weeks (Figure 4a, b). The magnitudes of these events vary between 0.8 and 5.1 (Figure 4c, d). Most earthquakes have a magnitude of less than 3, while, seven events were recorded to be greater than a magnitude of 4. Earthquakes were intense in the first two days, then their daily numbers gradually decreased (Figure 4a, b). Earthquake magnitudes of aftershocks have also gradually decreased over time (Figure 4c, d). Hypocenter solutions for each event differ between both networks (Figure 4e, f).
Numerical analysis of seismic events. (a) Number of events vs days; (b) Magnitude vs days; (c) Depth vs days.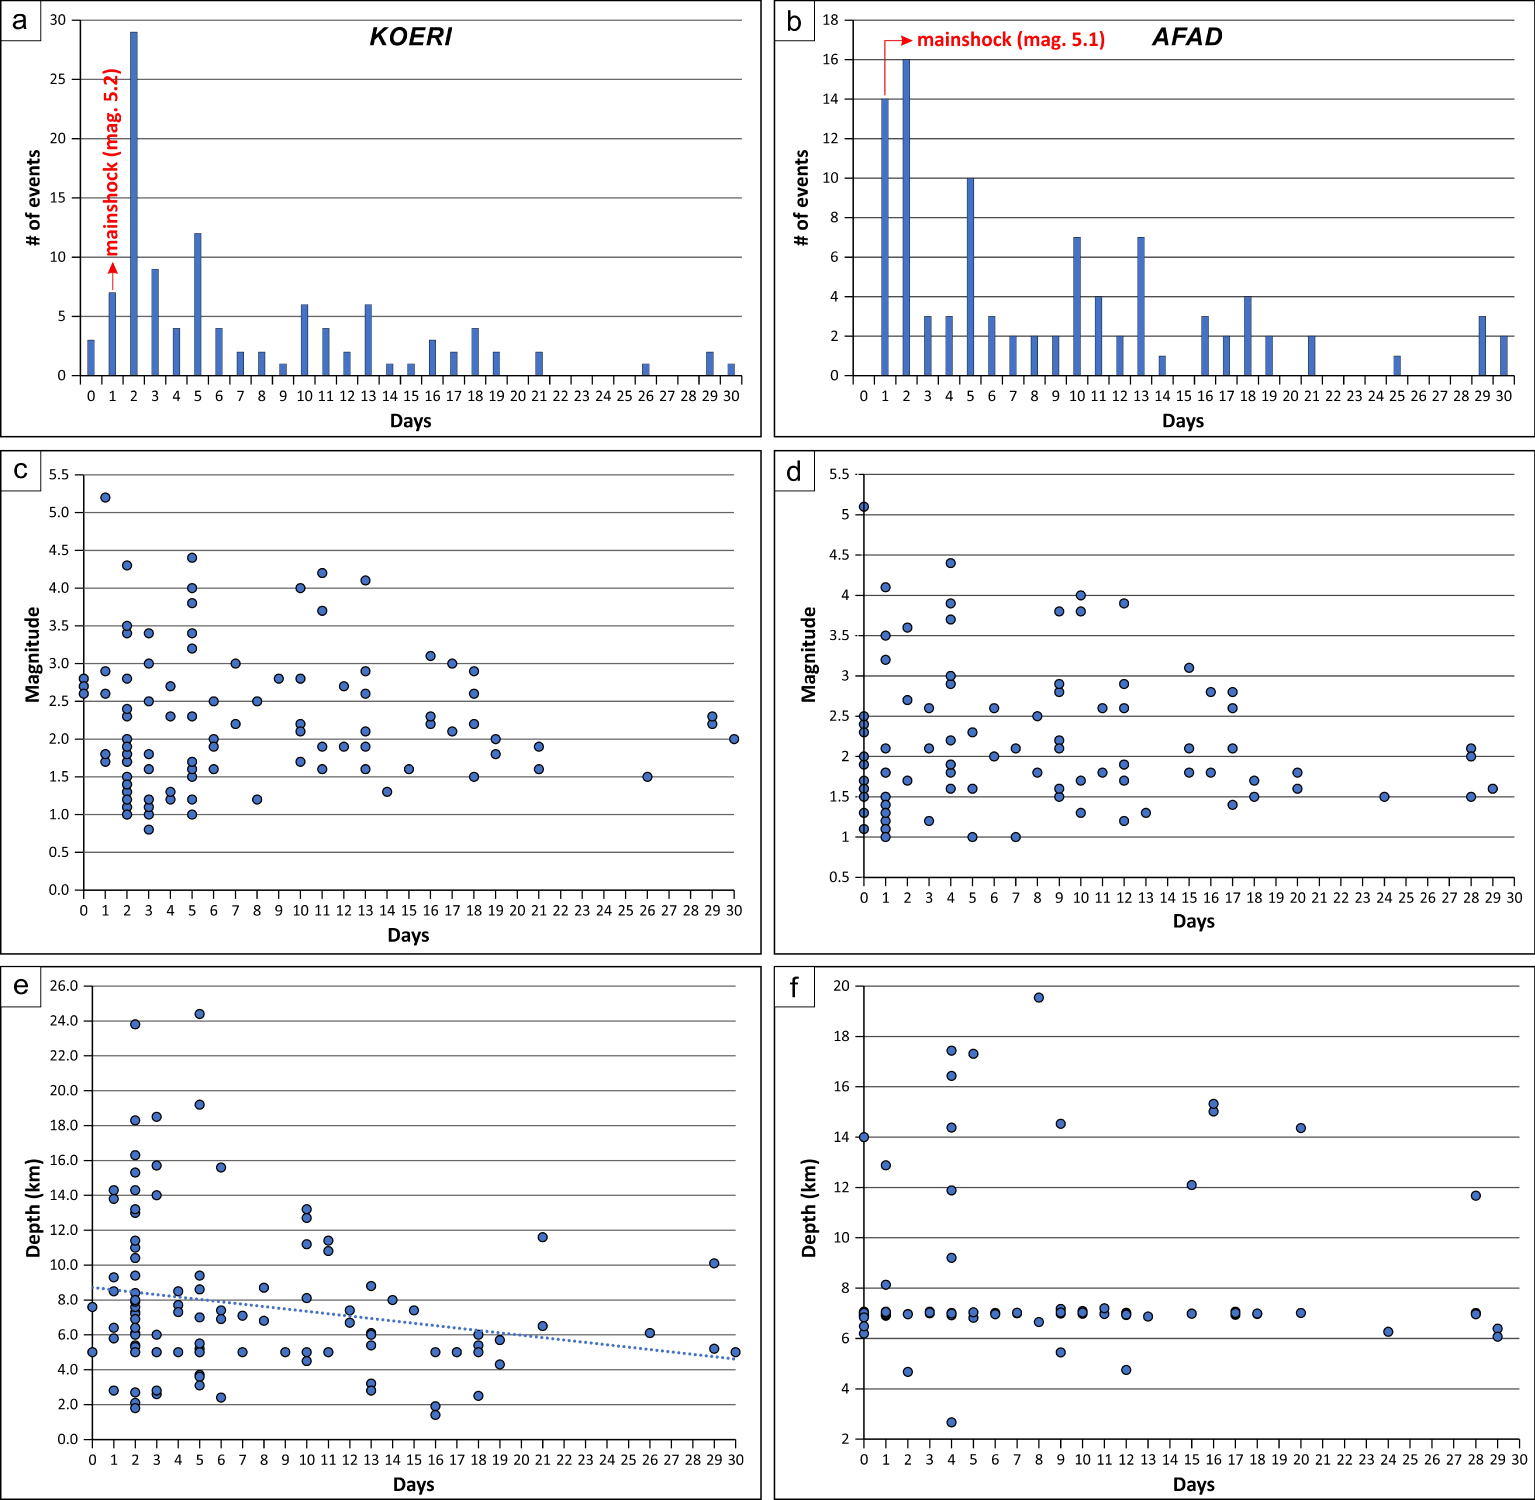
Earthquakes have occurred in a space where no earthquakes have been recorded so far during the 120-year-instrumentation periods (Figure 2). The first earthquake occurred near the village of Obruk. When the earthquake epicenters are plotted on the DEM, it is seen that the epicenters are mainly concentrated in different lines in the NW–SE direction (Elongation of the AFAD cluster is near N20W, while KOERI’s one is about N28W) (Figure 2b, c). This direction of epicenters coincides with the directions of the alignments of monogenetic volcanic vents and the structural lineaments (Figure 5a, b).
Orientation map have created using point data set of epicenters on SRTM DEM (a) monogenetic vents (cinder cones and maars), (b) structural lineaments and their related rose diagrams.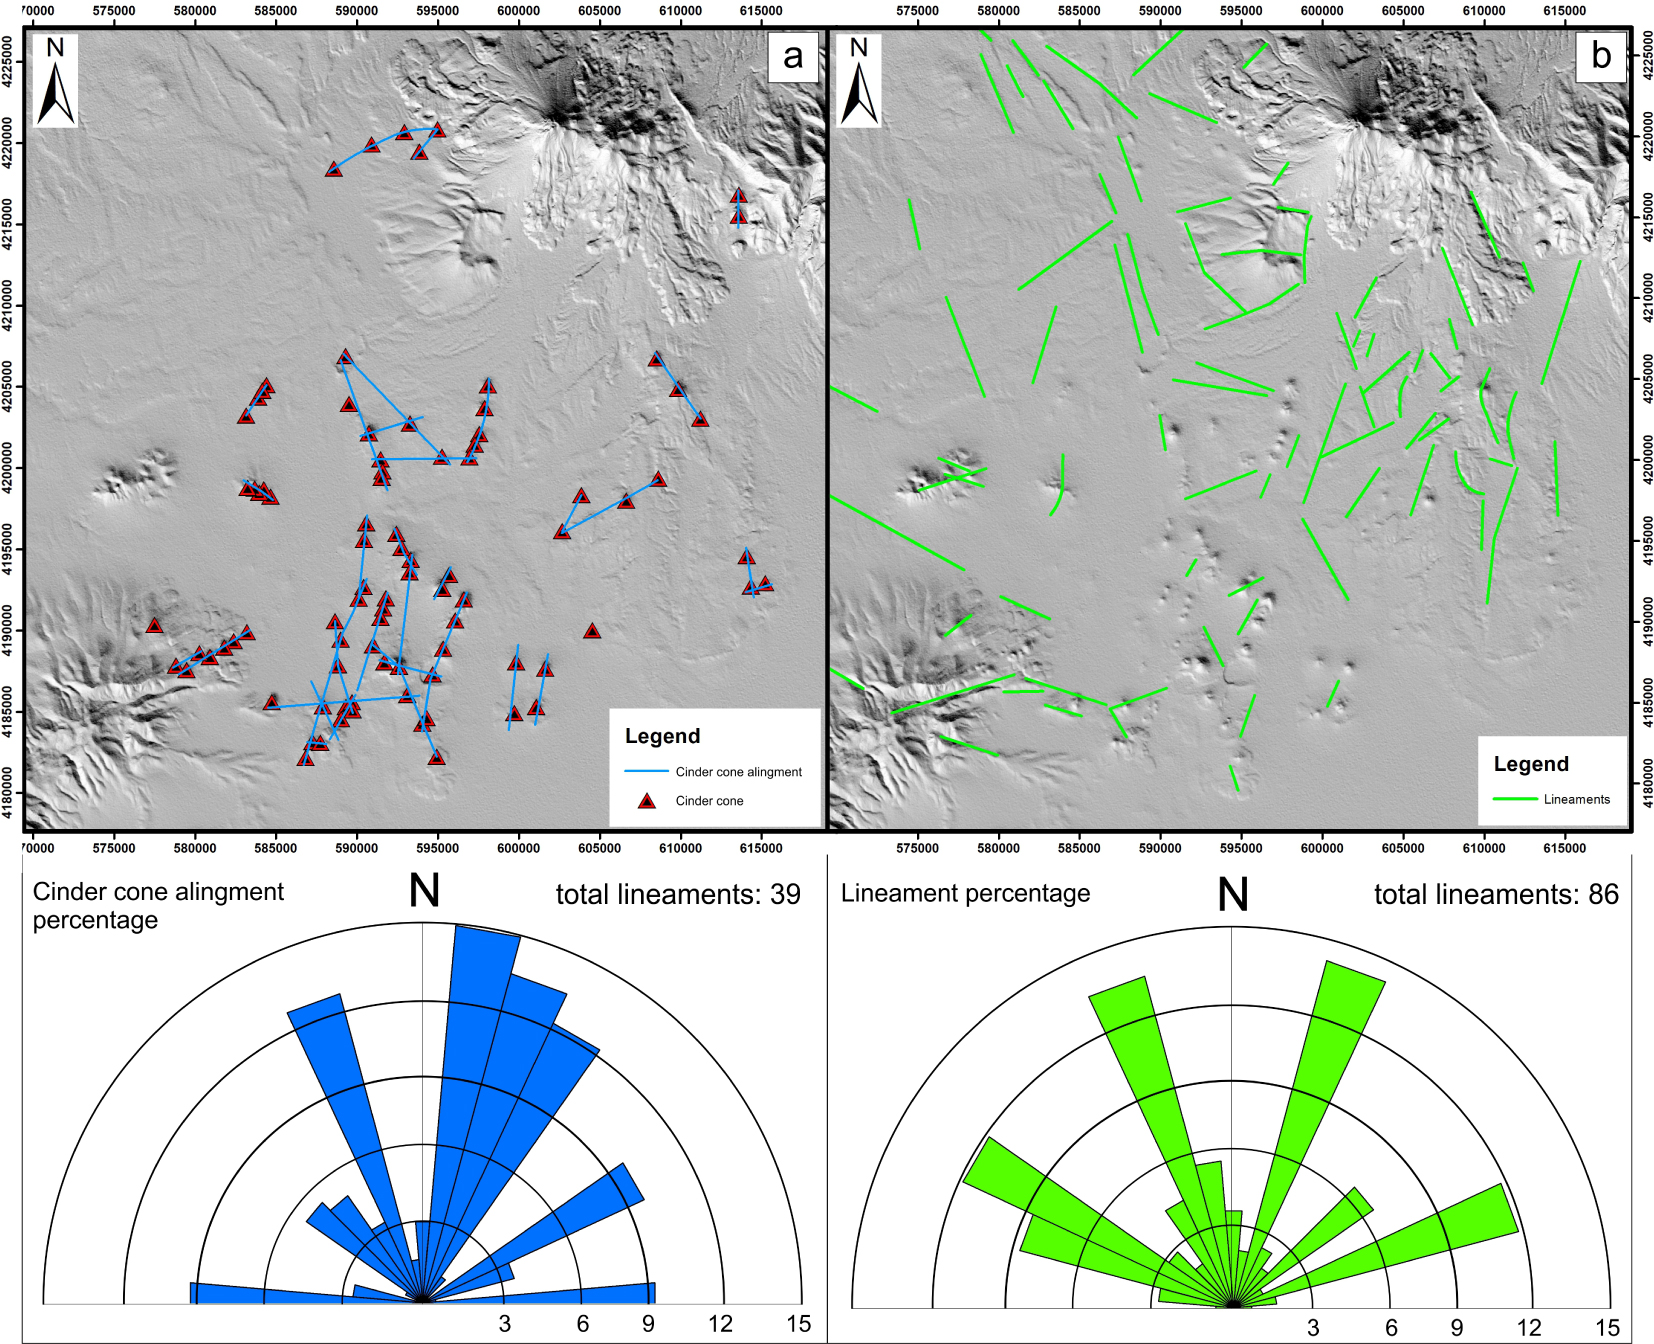
Coseismic LOS displacement maps were generated from the unwrapped interferograms for 10.09.2020–22.09.2020 (Figure 6a) and 09.09.2020–03.10.2020 (Figure 6b) Sentinel-1 image pairs. The first LOS pair (Figure 6a), covers 12 days and the second radar image was acquired two days after the main event. The second LOS pair (Figure 6b) covers 24 days period with opposite looking direction when compared with the first pair. While the deformation is visible, noise contribution due to overcast was higher in the first pair of images in the resulting interferograms (Figure 6a). Displacement maps of the shallow 5.1 earthquakes/swarm are in correlation with moment tensor solution of AFAD observatory (Figure 6; AFAD 2020); the trace representing the displacement is indicated with the white arrows in Figure 6b.
LOS (line-of-sight) displacements calculated from coseismic interferograms using Sentinel-1 radar data for (a) 10.09.2020 and 22.09.2020 image pairs and (b) 09.09.2020 and 03.10.2020 image pairs. Mainshock occurred on 20.09.2020 is plotted with red circle. Plotted seismic events and moment tensor solution is from AFAD [2020]. Satellite flight and look directions are indicated with yellow arrows. Inset graphs are showing the LOS displacement sections through the indicated dashed line. Projection and Datum: WGS84-UTM.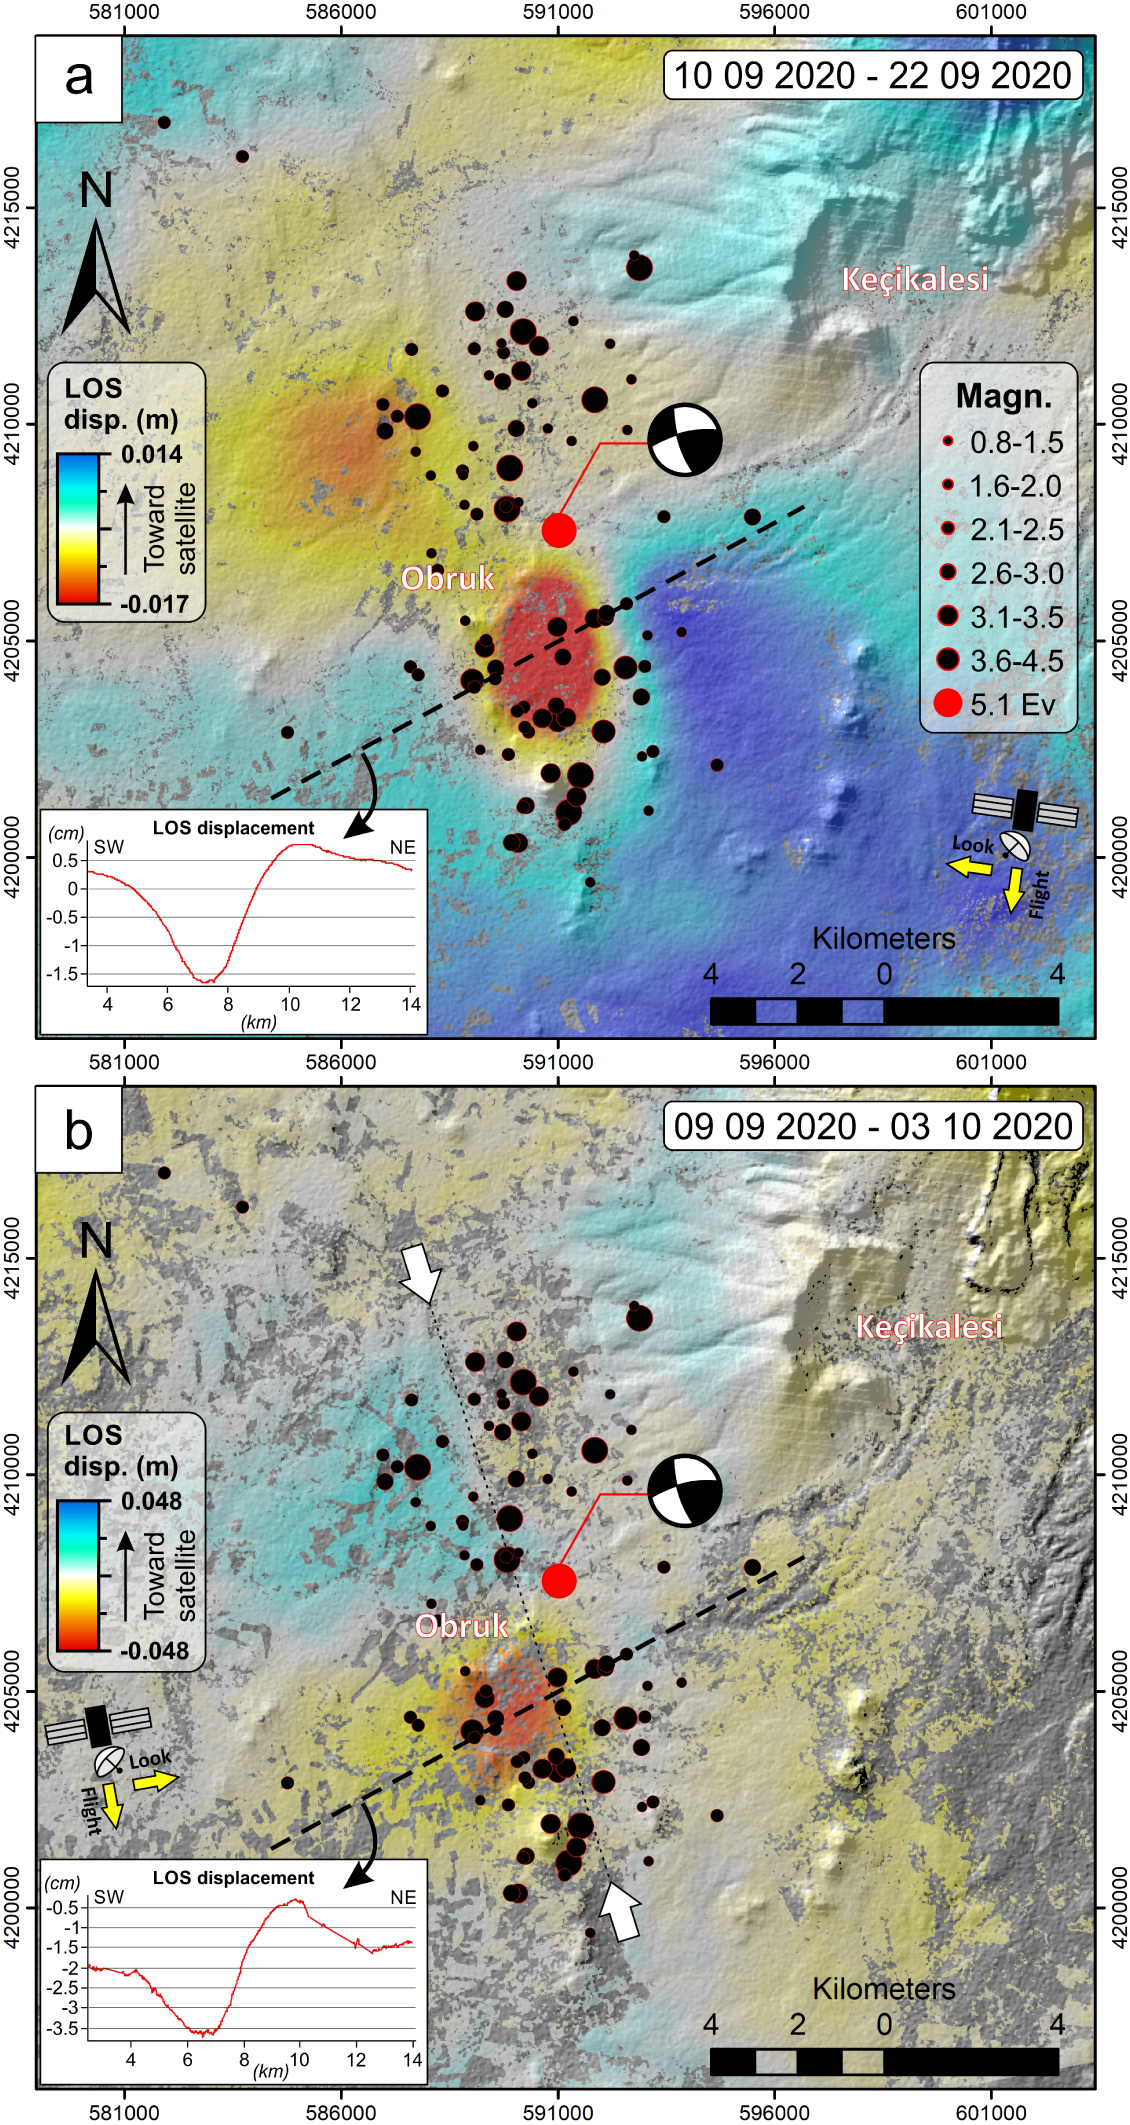
Positive LOS values (blue colors) represent movement toward satellite (tumescence: decrease in the vertical component of LOS distance) while the negative values (red colors) represent movement away from the satellite (subsidence: increase in the vertical component of LOS distance). In the first pair of the differential InSAR displacement image, depression is observed to the immediate southeast and northwest of the Obruk village (Figure 6a). In the second pair representing a longer time interval, the depression in the southeast of Obruk village slightly increases, while a tumescence is observed at the northwest of the village (Figure 6a and Figures 6a, b: inset displacement graphs). The amount of LOS displacement was measured ∼1.6 cm (Figure 6a: inset image) and ∼3.5 cm (Figure 6b: inset image) in the first and second pair displacement images. The observed difference between the LOS displacements on this tumescence is due to the longer observation period of the second image pair (Figure 6b) and opposite looking directions (Figure 6). Both of the InSAR displacement pairs show a slight tumescence to the east of the Obruk village (Figures 6a, b: blue areas to the east of the Obruk village).
4.2. Structural lineaments and monogenetic vent alignment
Figure 5 represents the synthesis of the monogenetic vent alignments (Figure 5a) and the lineaments of the structural discontinuities (Figure 5b). All have been drawn on the satellite image and DEM. The length of the lineaments varies between a few hundred meters and several kilometers. In the rose diagram (Figure 5), it is seen that the linearity directions are mainly NE–SW and NW–SE. Those structural discontinuities are especially concentrated between N10°–30° and N300°–330°. Besides, the monogenetic vents (cinder cones and maars) form some clusters aligning in a preferential direction. We analyzed the nearest-neighbor directions of identified vents with the formula of Clark and Evans [1954], inspiring from Von Veh and Németh [2009] study. They provide the formula for expected mean distance of Clark and Evans [1954] as , where n is the number of features and A is the area. The standard error SE is also given by . When we apply these formulas to OZES, where 103 monogenetic structures are located over an area of approximately 975 km2, we obtain an expected mean distance for the nearest-neighbor vents as 1530 m ± 0.065 m. This threshold value was used when extracting vent sequences and transferred linearly to DEM and satellite images. We obtained that the vents aligned in NE–SW, N–S, and NW–SE directions Figure 5a). Vent alignment presents a great similarity to the structural discontinuities (Figure 5b). Here, it should be noted once again that the cluster elongation is also N20W.
4.3. Gas measurements
Here, we briefly present the gas measurement results we made before the earthquake swarm and on the 12th day of the swarm. Gas measurements were made at the south foot of Hasandağ, Keçikalesi, and the second at the gas outlets at the summit. Before seismic swarms, CO2 concentration was around 1431 ppm at the southern foot and around 10,000 ppm at the summit vents [Diker et al. 2018; Ulusoy et al. 2018]. In the measurements we took during the swarm, the CO2 concentration at the southern foot station was higher than the measurement range of the device, that is, 100,000 ppm. In other words, a CO2 concentration of more than 10% has been reached. No significant change was observed in the summit vents. Also, H2S and SO2 measurements were made on the 12th day of the swarm. Accordingly, the H2S value was measured at 234 ppm in the southern foot, while SO2 was measured at 1.6 ppm (H2S∕SO2 = 146.25). At summital vents, while there was no H2S additive to fumaroles, SO2 was read as 1.2 ppm. On the other hand, radon measurements were also made on the 12th day of the swarm. While it was 1800 Bq∕m3 in the southern foot, the soil radon in the fumarole zone at the summit was measured as 3000 Bq∕m3. To make a very brief comparison with the hydrothermal system related to the volcano, we also measured radon in Ihlara village, which is also close to other geothermal resources. The radon measurement we got from the point to the north, 17 km away from the summit of Hasandağ, was around 886 Bq∕m3.
5. Discussion
AFAD and KOERI, Turkey’s two major seismic observation networks, have recorded Obruk Seismic Swarm separately. The depth and magnitude values are different due to the analysis algorithms, the azimuthal distribution of the stations used in the solutions and the different crust and velocity models. The epicenters are very close to each other with a slight shift of KOERI data set toward the east, but the hypocenters are variable (Figure 4e, f). The nearest stations are located 38–40 km from the mainshock epicenter. This distance may be enough for a regional observation, but in volcanological point of view, we need more stations on volcanic systems. We have no high-resolution seismic data to say whether a dyke has been emplaced during the seismic crisis.
It is well known that volcanic alignments can reveal volcano–tectonic interactions at different scales [Gómez-Vasconcelos et al. 2020]. Alignment analysis shows that either the ambient tectonic environment exerts a strong influence on the preferential orientations of the volcanic alignments, or that it is in competition with other factors (e.g., preexisting structures, local stress changes due to older intrusions) [Le Corvec et al. 2013]. The great variety of eruptive styles, edifice morphologies and deposits in monogenetic volcanoes is the result of a complex combination of internal (magma composition, gas content, rheology, volume) and external (regional and local stress fields, stratigraphic and rheological contrasts in substrate rock, hydrogeology) parameters that characterize each volcanic system [Martí et al. 2016, references therein]. Magma pathways within the brittle upper crust are influenced to various degrees by two end-member situations: (1) formation of new extension fractures perpendicular to the least compressive stress (σ3), and (2) reactivation of preexisting fractures that are near-parallel to the maximum principal stress (σ1) [Le Corvec et al. 2013]. Similar to Obruk event, although the tectonic regime would be different, the Natron (east Africa) seismo-magmatic crisis with dyke emplacements are well recorded with a temporary broadband seismic network, where hypocenters clustered in the N33 E direction [Calais et al. 2008], following rift fracture. Evaluation of the epicenters of the Obruk seismic swarm (main cluster directions: AFAD-N20W and KOERI-N28W), the structural lineaments and the alignment of the monogenetic vents together exhibits that reactivation of preexisting fractures caused the swarm, although they were inactive for 120 years.
Stratovolcanoes are characterized by at least a near-surface magma chamber, while in a monogenetic volcanic system, the magma does not accumulate in such shallow reservoirs or chambers and tends to rise to the surface from greater depths using rheological and/or structural discontinuities [Martí et al. 2016]. In other words, a near-surface magma chamber is not expected under the monogenetic cluster, while the nearby Hasandağ stratovolcano can have at least one magma chamber. Aydar [1992] and Aydar and Gourgaud [1993] modeled the magma chambers of Hasandağ volcano with petrological data and stated that the crystallization depth of amphibole minerals started at 4 km in the last volcanic phase. Besides, Tank and Karaş [2020] have realized three-dimensional analyses of magnetotelluric data collected at 27 sounding locations to develop electrical conductivity images for the Hasandağ volcano and its vicinity and proposed a magma chamber starting from 4–6 km beneath the volcano. Hasandağ is an active/subactive volcano having summit fumarole activities [Aydar 1992; Aydar and Gourgaud 1998]. Diker et al. [2018] worked on hydrothermal activities of Hasandağ with self-potential, surface temperature and CO2 measurements and they relate those activities with structural discontinuities [Ulusoy et al. 2021] on the volcano. They concluded that the hydrothermal zone starts above 2250 m; on the summit zone, fumaroles, hot grounds, and water vapor vents are observed between 3000–3100 m, and the highest temperature and CO2 value measured in the fumarole vents is 68.7 °C and ∼10,000 ppm, respectively [Diker et al. 2018; Ulusoy et al. 2018]. Kunrat et al. [2020] realized the gas and thermal measurements at the summit of the Gamalama volcano, they proposed that the system is dominated by hydrothermal processes based on H2S∕SO2: 2–8 value. As in the hydrothermal systems, SO2 reacts with H2O to give H2S and H2SO4, our high H2S∕SO2 (146.25) values at the southern foot, indicate an effective conversion to H2S of SO2 at prolonged hydrothermal conditions. Besides, no H2S at the summital fumaroles and weak SO2 content must be a result of a dynamic hydrothermal system with a very few amount of magmatic contribution or nonmagmatic contribution to fumarole. All these volcanological, petrological, geophysical data, and the several eruptions in the last 10 thousand years, make Hasandağ an active volcano and show that there is an active magma chamber and an active hydrothermal system beneath it. When a large earthquake occurs near an active volcano, there is often concern that volcanic eruptions may be triggered by the earthquake [Nishimura 2017]. The key to understanding earthquake volcano interactions is the response of gas and magma to earthquake-imposed stresses [Kennedy 2017]. Epicenters of the Obruk events are lined up in N20W–SE (AFAD cluster) or N28W (KOERI cluster) with possible secondary NE–SW directions. Cone lineament trends can be highly variable, resulting from the interplay between (1) the regional stress field, (2) local magma-induced stress fields, and (3) stress rotations [Muirhead et al. 2015]. On Figure 2, the main alignments of the events stay identical comparing the vent alignment, structural discontinuities, and deformation. It seems that the volcanic vents are mostly located at the intersection points of the two conjugate directions in whole OZES (Figure 7).
Compilation and synthesis of all orientations on SRTM DEM. Black dots: Epicenters, Triangles: Monogenetic vents, Blue lines: Monogenetic vent alignment, Green lines: Structural discontinuities.
The presence of a hydrothermal system may affect the eruptive style of a volcano, favoring the occurrence of phreatic or phreatomagmatic events, but it also controls heat and fluid transport within the volcanic edifice during both quiescent and unrest periods [Todesco 2008]. Large increases in hydrothermal pore pressure are produced by a variety of mechanisms: heating of confined pore water by intrusions; degassing of intrusions; discharges of highly pressurized fluids from the depth and by deformation associated with faulting [Day 1996]. Doke et al. [2018] detected the ground deformation with a radar image in the Hakone phreatic explosion (Japan) in 2015. They stated that, in Yamada et al. [2015] InSAR images detected surface displacements of about 10 cm toward a satellite in an area of about 1 km in diameter in the case of the 2014 phreatic eruption of the Ontake Volcano in Japan. In our study, although the data are noisy, especially in the first pair of images (Figure 6), satellite-derived displacement maps show that along with a blurred strike-slip component, there is a slightly positive value (tumescence) to the east and a negative value (subsidence) at the southeast of Obruk village. Solely tectonic or with magmatic and/or hydrothermal component, this movement should not be disregarded. In this case, a new monogenetic vent emplacement can be expected soon in the region. This deformation near an older maar crater, caused by hydrovolcanism, suggests two main scenarios: (1) if the deformation is due to the hydrothermal activities rather than tectonic, either a phreatic or phreatomagmatic explosion may occur, or (2) if the deformation is caused by magmatic injection (dyke), a cinder cone may be emplaced.
On the other hand, seismic activities can activate the gases in the magma chamber beneath Hasandağ. Our gas measurements show an increase in CO2 gas concentration while SO2 emission is low. Besides, soil radon concentrations are high enough to propose an active hydrothermal system beneath this volcanic region. We interpret those results as an indication of nonmagmatic unrest rather than magmatic one. We can add that after completion of gas and temperature measurement at the summit of Hasandağ on October 2, 2020, the members of our research team heard a rumbling and explosion sound from inside the mountain when they were descending. They felt the ground vibration. KOERI Earthquake and AFAD seismic networks did not record this explosion and vibration. It is stated that these explosion sounds are heard by local people from time to time in the region. So, we believe that those gas are confined in the conduit and explode. In addition to this, very close seismic activities, excessive H2S gas, low SO2 content, high CO2, and fumarole activities (72 °C) bring the risk of a phreatic explosion in Hasandağ as a result of nonmagmatic unrest. The type of explosion defined as Bandai-san in the literature can also occur in Hasandağ. The fumarole activities are located especially on the west side of the summit where the slope value locally exceeds 50°. The surrounding rocks are extremely altered and the flanks are also covered with loose material such as block-and-ash flows. H2S activity in the fumaroles let us think if sulfuric acid also formed, it may weaken the ground. All we counted here suggests that the slope may become unstable with a phreatic eruption and/or a strong earthquake. Our soil radon measurements seem to be high with 1800 Bq∕m3 at the southern foot, 3000 Bq∕m3 at the summit fumarole zone. CO2 concentration was about 10,000 ppm at the summit and 100,000 ppm at the southern foot during seismic swarm period. Among geochemical precursors, radon gas in groundwater and soil is considered a notable precursor, used to detect chemical and physical changes during the generation of earthquakes and volcanic events [Morales-Simfors et al. 2019]. Radon needs usually a transporter like a fluid, gas, even seismic waves to reach the surface [Aydar and Diker 2021]. It seems that radon enrichment is parallel to CO2 enrichment at Hasandağ, due to a hydrological response to seismic events.
6. Conclusion
An earthquake hit the Obruk village of Niğdei–Bor (Central Anatolia, Turkey) with a magnitude of 5.1 (AFAD) or (5.2 KOERI) on September 20, 2020 and the events continued a month, albeit with a decrease. In this study, we analyzed these earthquakes in volcano-structural and volcanic unrest point of view. Our analyses suggest that
- the seismic swarm activated preexisting NW–SE structures, while secondary clusters align along a NE–SW trend,
- Obruk seismic swarm fills a seismic gap in a place where no seismic activity has been observed in the last 120 years,
- Epicenters alignment is roughly parallel to volcanic vents alignments
- A phreatic/phreatomagmatic vent can be formed around the detected ground deformation,
- As swarm happened nearby Hasandağ volcano, we measured gas contents and find that nonmagmatic unrest was effective and before magmatic unrest, a phreatic eruption may happen,
- Finally, Hasandağ must urgently be started to survey with seismic, acoustic, geodetic methods and a permanent gas and thermal measurement devices must be installed.
Acknowledgments
We are grateful to all members of KOERI and AFAD for their freely shared seismic catalogs. We thank especially Dr. M. Nurlu, Director of Earthquake Department of AFAD, who gave us seismic catalog and his personal comments on the reasons why the discrepancies happened between two national seismic networks and also Mr. Yavuz Güneş, Geophysical Engineer from KOERI for sharing his revised data and for his patience against our questions, anonymous referee and the handling editor for their constructive comments and suggestions. We also have special thanks to F. Chabaux for his editorial handling. The authors appreciate constructive reviews by Carole Petit (also for her editorial handling) and by two anonymous reviewers. Pre-event gas and thermal measurements were carried out by a project funded by the Scientific and Technological Research Council of Turkey (TÜBİTAK P. No: 116Y167); project participants are greatly acknowledged.