

1 Introduction
The Isere River is a particularly good indicator of the hydrosedimentary functioning of a large Alpine drainage basin. Although it is only a medium-sized tributary of the Rhone in terms of its contribution to the latter's volume, the Isere nevertheless plays an important role in the Rhone's flux of suspended and dissolved matter. However, there have been very few studies of the transit of suspended matter in the Isere, and certain quantifications and estimations of solid flow rates at Grenoble, where the basin has an area of 5720 km2, are still sometimes based on Pardé's 1925 estimation at 19.9 Mt yr−1 [24], itself calculated from the observations of Müntz and Lainé [22,23]. Nearly twenty years later, Pardé [25] concluded that his own original evaluation had been completely wrong, and revised his estimation of SM flux as being closer to 3.1 Mt yr−1, before publishing a new estimation of between 4 and 6 Mt yr−1 in 1964 [26].1 Recent attempts by Vautier [38] and Allain Jegou [2] to assess the sedimentary flux clearly show the lack of information on the transit of suspended matter in the Isere.
However, managing a watercourse requires an accurate, up-to-date quantification of fluxes in order to assess the potential amount and rate of sedimentation, as the latter are factors in elevating a riverbed's level, thus directly impacting on the protection provided by embankments. The aims of the present study were therefore to quantify the flux of the Isere at Grenoble and to evaluate the evolution of sedimentary transit since 1960. To this end, regular and continuous measurements were made between January 1995 and December 2005.
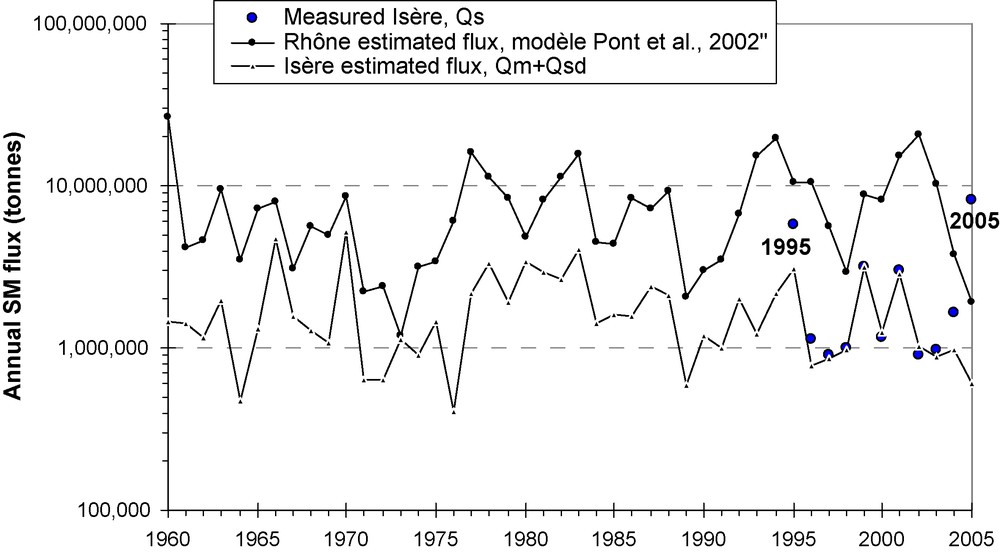
The drainage basin under consideration, upstream from Grenoble, covers an area of 5720 km2 in the northern Alps (Fig. 1). The Isere is mainly fed by snow and rain, with high water levels from May until July, characteristic of a mountainous catchment area, more than 70% of which being above an altitude of 1000 m. The mean annual flow of the Isere is 183 m3 s−1 over the reference period of 46 years beginning in 1960, when the hydrological station used in this study was opened (Diren, Banque Hydro: W1410010). The last century was a relatively quiet one for the Isere, since the highest recorded flow rates scarcely reached half the maximum 2000 m3 s−1 observed during the last great flood in 1859 [11]. The ten-year extreme event is generally estimated at around 760 m3 s−1, the fifty-year event at 1000 m3 s−1, and the hundred-year event at over 1600 m3 s−1 ([38], and Banque Hydro-Diren); other studies have given slightly higher figures [2,40].
The Isere drainage basin at Grenoble.
Fig. 1. Bassin versant de l’Isère à Grenoble.
2 Method
Beginning in 1994, equipment allowing the flux of dissolved and suspended matter (SM) to be observed was progressively set up at the hydrometric station run by the ‘Institut national polytechnique de Grenoble’ (INPG) on the Grenoble University's campus [28].
An automatic sampler on the left bank enabled SM concentrations to be measured from 500-ml samples; the measurements were carried out by filtering with 0.45-μm membranes and weighing. Measurements were made twice daily from 1995 to 2004, then daily from January 2005 onwards. They were carried out by J.-L. Peiry from 1995 to September 1999 [28], and by the present author since that time. The regularity of sampling and the high number of samples analysed, over 7200 in all, enabled daily SM fluxes to be worked out fairly accurately, and monthly and yearly figures to be calculated with a reasonable degree of confidence.
Two turbidity gauges (Partech IR40C and IR15C) enabled certain missing data to be complemented. However, the concentrations they measured sometimes showed sharp turbidity peaks due to the smearing or severe clogging of the gauges’ optical systems. Such errors cannot yet be completely eliminated by new systems equipped with wipers, which were tested for a short time in the Isere. Studies of the sedimentary transit in the Rhone have led to the same observations [4]. Although such artificial peaks can be quite easily discerned, the relationship between sampling data and turbidity gauge data is sometimes poorly correlated due to the interference of texture, colour, and undoubtedly various degrees of sediment aggregation, with the optical measurements [13,15,31]. This, plus the fact that the relationships between concentrations obtained from optical measurement and those from samples taken over short periods remain significant, is the reason why turbidity measurements have been used here simply to fill out incomplete data.
Along with constant measuring, over 15 full gaugings were carried out, enabling the selective measurements to be compared to the actual mean concentrations of the wet-area cross-section. They were done with Isere flow rates recorded between 105 m3 s−1 (10 October 2002) and 348 m3 s−1 (17 May 2001). The hydrological conditions corresponding to these gaugings (dates, flow rates, etc.) were described in a previous article [10]. In order to assess the evolution of the sedimentary transit over several decades, data from the hydrological station located a little way downstream from the Grenoble campus station (1960–2005: Diren W 1410010) were used in the present study. However, the choice of this downstream station, where no full gauging has yet been carried out, made it necessary to resort to the method of estimating the mean concentration (Cm) over the whole cross-section, based on the sampled concentration (SMfixed), and the following regressive model [10] (Eq. (1)):
| (1) |
The mean daily-corrected concentration was then calculated from the two daily samples (Cmd, in mg L−1).
3 Results
3.1 Anthropogenic impacts on the quantification of the SM flux
In their estimations of sedimentary transit, studies based on regular sampling, or a fortiori based on the extrapolation of limited measurements with SM = f(Q) relationships, seldom highlight bias due to certain human activities directly affecting the watercourse (maintenance, consolidation of riverbanks, development projects, etc.). Such short-term activities are fundamentally different from structural modifications of the river basin directly or indirectly linked to more permanent types of human activity such as deforestation, reafforestation, fire, land use changes, agriculture, urbanisation, etc., which often lead to long-term variations in sedimentary flux, and whose cause or causes can be both understood and evaluated [20,44].
Desperate attempts to identify relationships between concentrations, SM flux, and liquid flow rates seem hardly worthwhile when such impacts become primordial with respect to the sedimentary transit of a watercourse. From January 2005 to July 2006, the Isere was thus subjected to major development work on its flood-banks about one kilometre upriver from where this study's samples were taken, on the territory of the town of Gières. This had a significant effect on measurements, as the work resulted in considerable discharges of sediments over about 2300 m, with the building of a temporary track at the foot of the flood-bank. The track was made from gravel and silt scooped directly from the riverbed. The highest mean daily concentration (Cmd) since the sampling instruments were set up was thus recorded on 18 April 2005, with an average of over 15.5 g L−1 for the sector. The same year, the observed sedimentary flux was for the most part a direct result of anthropogenic disturbance, giving an annual transit some 7.5 Mt higher than what would have normally been expected (see Table 2).
Estimation of the annual SM flux of the Isere at Grenoble since 1960, with Q the annual mean flow (m3 s−1), estimated flux with monthly flow (Qsm), and with monthly flow plus daily high-water flow > 500 m3 s−1 (Qsm + Qsd), and measured flux between 1995 and 2005. All SM flux in 106 tonnes
Tableau 2 Estimation des flux de MES annuels de l’Isère à Grenoble depuis 1960, avec Q le module annuel (m3 s−1), flux estimé avec les débits mensuels (Qsm) et les débits mensuels, plus les crues journalières supérieures à 500 m3 s−1 (Qsm + Qsd), et flux mesuré entre 1995 et 2005. Tous ces flux de MES sont en mégatonnes
| Estimated flux | Estimated flux | Estimated flux | Measured flux | |||||||||
| with | with Qsm | with | with Qsm | with | with Qsm | |||||||
| Yr | Q | Qsm | +Qsd | Yr | Q | Qsm | +Qsd | Yr | Q | Qsm | +Qsd | |
| 1960 | 186 | 1.4 | 1.4 | 1976 | 111 | 0.4 | 0.4 | 1992 | 193 | 1.6 | 2.0 | – |
| 1961 | 176 | 1.2 | 1.4 | 1977 | 224 | 2.2 | 2.2 | 1993 | 178 | 1.2 | 1.2 | – |
| 1962 | 166 | 1.2 | 1.2 | 1978 | 234 | 2.5 | 3.3 | 1994 | 219 | 2.1 | 2.2 | – |
| 1963 | 185 | 1.6 | 2.0 | 1979 | 210 | 1.9 | 1.9 | 1995 | 235 | 2.7 | 3.1 | 5.7 |
| 1964 | 117 | 0.5 | 0.5 | 1980 | 241 | 2.7 | 3.4 | 1996 | 145 | 0.8 | 0.8 | 1.1 |
| 1965 | 176 | 1.3 | 1.3 | 1981 | 252 | 2.7 | 2.9 | 1997 | 148 | 0.9 | 0.9 | 0.9 |
| 1966 | 234 | 2.9 | 4.7 | 1982 | 234 | 2.3 | 2.7 | 1998 | 158 | 1.0 | 1.0 | 1.0 |
| 1967 | 181 | 1.4 | 1.6 | 1983 | 237 | 2.6 | 4.1 | 1999 | 213 | 2.2 | 3.1 | 3.2 |
| 1968 | 173 | 1.2 | 1.3 | 1984 | 193 | 1.4 | 1.4 | 2000 | 168 | 1.1 | 1.3 | 1.2 |
| 1969 | 162 | 1.1 | 1.1 | 1985 | 205 | 1.6 | 1.6 | 2001 | 217 | 2.3 | 2.9 | 3.0 |
| 1970 | 219 | 2.8 | 5.2 | 1986 | 198 | 1.6 | 1.6 | 2002 | 163 | 1.0 | 1.0 | 0.9 |
| 1971 | 132 | 0.6 | 0.6 | 1987 | 217 | 2.1 | 2.4 | 2003 | 147 | 0.9 | 0.9 | 1.0 |
| 1972 | 133 | 0.6 | 0.6 | 1988 | 221 | 2.1 | 2.1 | 2004 | 140 | 0.8 | 1.0 | 1.7 |
| 1973 | 149 | 0.9 | 1.1 | 1989 | 122 | 0.6 | 0.6 | 2005 | 129 | 0.6 | 0.6 | 8.1 |
| 1974 | 156 | 0.9 | 0.9 | 1990 | 158 | 1.0 | 1.2 | |||||
| 1975 | 189 | 1.5 | 1.5 | 1991 | 156 | 0.9 | 1.0 | Mean | 183 | 1.49 | 1.76 | 1.54 |
To a lesser degree, work on building the Maurienne motorway in the Arc River valley begun in 1994, involved the consolidation of embankments and the building of civil engineering structures (in particular the Aiton, Saint-André and Escalade viaducts), and interfered with the assessment of daily sedimentary flux. This was especially true in 1994 and throughout 1995, when the work was mainly taking place in the area downriver from the Arc Valley, not far from its confluence with the Isere. In 1995, the recorded sedimentary flux was a great deal over the ‘normal’, most likely more than 2.5 Mt in comparison with an annual transit undisturbed by human activity (see Table 2).
3.2 Seasonal sedimentary variations
For the above reasons, and in order to show the Isere's monthly characteristics as well as its seasonal SM transport model [20], the years 1995 and 2005 have been eliminated from the monthly and yearly statistics (Table 1). For the period from 1996 to 2004, the means, deciles and medians of concentration, as well as the mean flux, calculated from the daily figures, give a good indication of the Isere's sedimentary transport model (Table 1).
Seasonal model of flow rates and SM transport de MES, 1996–2004. C10, C90, C50: deciles and medians of daily concentrations and specific daily SM flux. Like mean flux, they were calculated from mean daily data
Tableau 1 Régime saisonnier des débits et du transport de MES pour la période 1996 à 2004. C10, C90, C50 : déciles et médianes des concentrations journalières et des flux spécifiques journaliers de MES. Comme le flux moyen, ils sont calculés à partir des données moyennes journalières
| Mean Q (m3/s) | SM concentration (mg/L) | Mean flux (tonnes) | Specific flux (T/km2/day) | ||||||||
| mean | C10 | C50 | C90 | mean | C10 | C50 | C90 | max | |||
| J | 141.2 | 125.0 | 29.8 | 62.4 | 162.5 | 91,481 | 0.516 | 0.05 | 0.13 | 0.44 | 62.97 |
| F | 134.2 | 90.4 | 34.3 | 61.4 | 143.3 | 36,705 | 0.229 | 0.05 | 0.12 | 0.33 | 7.50 |
| M | 161.5 | 244.6 | 37.9 | 79.6 | 337.6 | 208,566 | 1.176 | 0.06 | 0.18 | 1.06 | 52.46 |
| A | 169.9 | 178.4 | 49.2 | 107.8 | 362.9 | 97,780 | 0.570 | 0.09 | 0.25 | 1.28 | 7.18 |
| M | 265.4 | 367.1 | 69.2 | 185.2 | 848.6 | 366,330 | 2.066 | 0.19 | 0.62 | 5.07 | 39.57 |
| J | 257.1 | 383.1 | 95.1 | 203.3 | 804.9 | 294,333 | 1.715 | 0.28 | 0.76 | 4.19 | 22.41 |
| J | 180.9 | 199.5 | 71.0 | 124.0 | 323.1 | 113,220 | 0.639 | 0.14 | 0.32 | 1.07 | 26.89 |
| A | 141.0 | 235.9 | 71.8 | 144.5 | 433.7 | 95,356 | 0.538 | 0.13 | 0.30 | 1.14 | 7.99 |
| S | 125.5 | 169.6 | 61.4 | 123.5 | 256.1 | 57,486 | 0.335 | 0.10 | 0.24 | 0.63 | 6.13 |
| O | 140.6 | 142.8 | 56.9 | 109.2 | 270.2 | 56,742 | 0.320 | 0.09 | 0.20 | 0.64 | 3.39 |
| N | 147.9 | 135.6 | 46.2 | 86.5 | 254.8 | 52,510 | 0.306 | 0.07 | 0.17 | 0.71 | 2.52 |
| D | 134.2 | 121.6 | 43.9 | 92.8 | 195.6 | 56,210 | 0.317 | 0.07 | 0.15 | 0.44 | 19.62 |
| Y | 166.6 | 199.5 | 46.2 | 108.7 | 367.3 | 1,526,720 | 0.731 | 0.08 | 0.24 | 1.25 | 62.97 |
Seasonal variations in sedimentary flux are in relative agreement with the rain–snow regime of the Isere. If the concentration model shows up in the means (monthly variation index: 4.2), it becomes even clearer in the upper deciles, where the monthly differences are greater (monthly variation index: 5.9). In contrast, the mean specific flux, with a peak in May and a lesser one in March, is less characteristic of seasonal variations, as it depends too much on the sedimentary transfers linked to rising water levels. The maximum specific solid flow rate, for example, directly linked to rising-water periods, accounts for 47% of the variation in mean monthly solid flow, whereas deciles and medians are independent of such extremes. It is clear that days with a flux of around 63 t km2 d−1 (in one single day, 14 January 2004, a flux equivalent to 23,000 t km2 yr−1 was recorded) will certainly have an influence on monthly means.
Median and (especially) upper deciles, less influenced by extreme events, themselves independent of the seasons (three major rises in the river level were observed in May, March and January, respectively), seem the most pertinent factors to use in describing seasonal fluctuations of SM flux. They highlight the strong seasonal variations in sedimentary transit, superior to 15 (from 0.3 to 5.1 t km2 d−1) for the upper deciles of specific flux (Table 1). The months of May and June clearly show the importance of snowmelt in sedimentary production.
3.3 The importance of periods of rising water in sedimentary transit
As with most rivers [21,29,36,37,42,43], the times at which the Isere rises are those accounting for most of its annual sedimentary transit. The evolution and quantities of suspended matter carried by the river during periods of rising water were closely monitored by means of twice-daily sampling. Since 1996, there have been three such periods at Grenoble, with an expected occurrence of 10 years or slightly more: in May 1999 (Qmax = 809 m3 s−1), March 2001 (Qmax = 875 m3 s−1), and January 2004 (Qmax = 750 m3 s−1). With transits of over 1 million tonnes in ten days for the first two and half a million tonnes in four days for the third, these three episodes were typical examples of the importance of this type of event. They accounted for 34%, 39%, and 30% respectively of the annual tonnage (equal to 3.2 Mt in 1999, 3.0 Mt in 2001, and 1.7 Mt in 2004) for 1.3%, 5.4%, and 3.3% of the annual water volumes carried by the river. Rising-water periods thus require fairly regular monitoring of SM and show that estimations of sediment transfer based on insufficient or insufficiently frequent sampling may be somewhat unreliable.
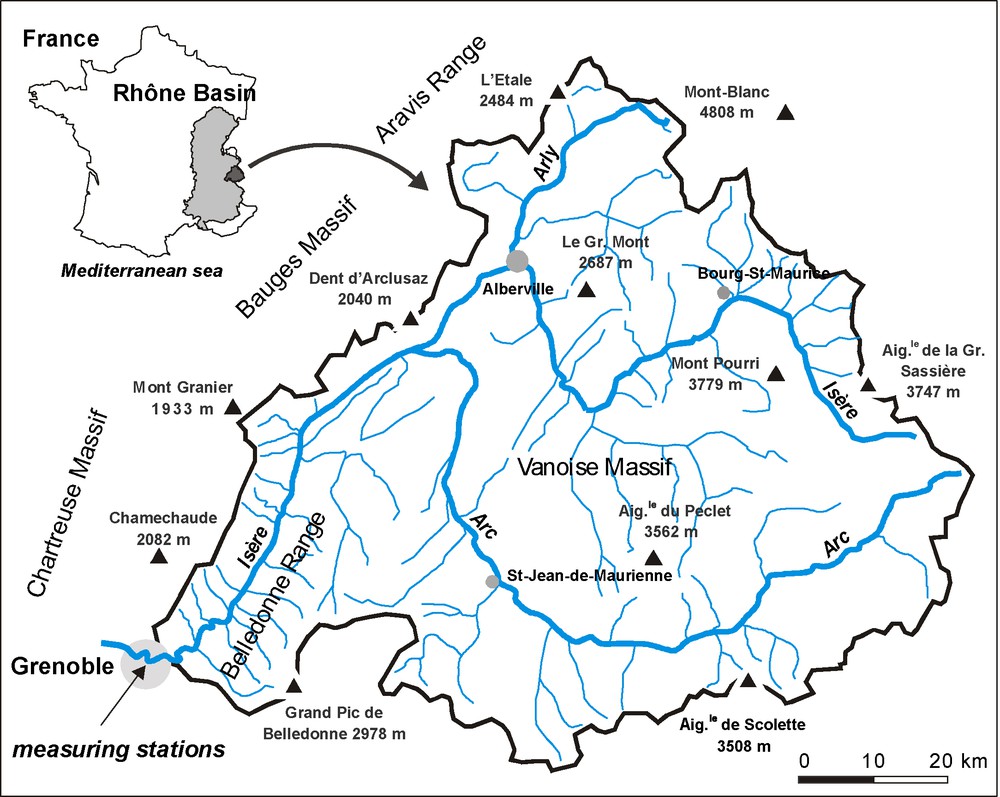
Duration curves [21] show how important rising-water periods are, and enable the Isere's sedimentary variations to be more accurately discerned (Fig. 2). Apart from 1995 and 2005, the curves are all fairly similar, and can be superimposed on each other, with all of them remaining within the delineations of 2000 and 2004 (Fig. 2). Over half the Isere's annual sedimentary transit (from 44% to 71%, depending on the year; 55% on average) is generally transported within a lapse of 30 days, i.e. about 8% of the year. These figures partially agree with, and complement, Meybeck's estimations for the Rhone–Alpine area [20]. The curves also show that 1995 and 2005 were anomalous years, and thus provide an additional means of detecting the possibility of transit having been significantly influenced by work along riverbanks or in their immediate vicinity.
Annual duration curves: the time percent needed to carry away a quantity of annual sedimentary flux. Anomalousness of years 1995 and 2005.
Fig. 2. Courbes de durée annuelle : pourcentage du temps nécessaire pour évacuer une quantité de flux sédimentaire annuel. Singularité des années 1995 et 2005.
3.4 The relationship between SM flux and water flows, and estimation of flux since 1960
In order to make up for incomplete data (September–December 1998) and to be able to estimate sedimentary transits over a longer period of time, a relationship between SM flux and the flow rate of water needs to be established. Relationships such as SM = a Qb, although regularly used in many studies [3,5,12,20,29], are poorly demonstrated (with a few exceptions) by daily data from the Isere, even if attempts are made to do so on a monthly or seasonal basis. The often-clockwise hysteresis of rising-water events is the main explanation for this, as sediments deposited during the previous such event go back into suspension when water level next rises [20,37,42]. Setting aside rising-water events, the use of regular, frequent sampling can lead to a large number of different cases, various types of high-water hysteresis, and differing pre-rise basin conditions. Irregular relationships between daily concentrations and observed flow rates are therefore hardly surprising when they concern a relatively large drainage basin located, moreover, in a high-mountain area, where processes of sedimentary supply, contributory zones, and pre-flood basin conditions may vary considerably over time and are even partly independent of seasonal influence.
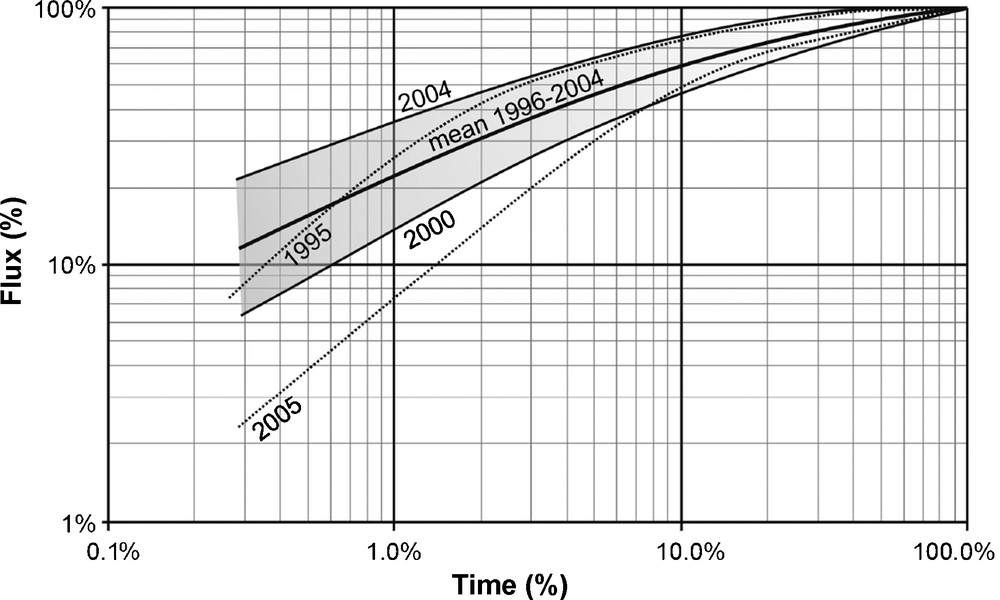
In contrast, taken month by month, mean concentrations and, to an even greater degree, solid monthly flux (Qsm in tonnes month−1) are quite well related to monthly liquid flow (Qm, in m3 s−1); this is also usually given in the form of a power equation [3,29,30]. The relationship used for the Isere reads (Eq. (2) and Fig. 3):
| (2) |
Relationship between solid (Qsm) and liquid (Qm) monthly flow. Reference period: 1996–2004.
Fig. 3. Relation entre les débits solides mensuels (Qsm) et liquides (Qm). Période de référence : 1996–2004.
The year 1995, despite improving the explanation of the model very slightly (r = 0.82), has been excluded. On the other hand, Fig. 3 clearly shows and confirms the influence of the work on the Isere embankments in 2005, with monthly figures for sedimentary transit that are clearly different from other years’ ones. The relationship has thus been established from the 1996–2004 period, and it explains around 66% of the variation in the Isere's monthly sedimentary flux. Months when water levels rise significantly, resulting in heavy transport, are nevertheless still underestimated. Such underestimation of transit is often unavoidable, even with strictly daily models, when high-water events have not been measured [3,4,29]. According to Eq. (1), underestimation of monthly figures is around 1 Mt for the rising-water events of May 1999 and March 2001, and around 0.5 Mt for that of January 2004.
Since the monthly figures described above take little account of periods during which the river rose to very high levels, it seems worthwhile to attempt to complete the present estimations of monthly transit by including days of very high flow rates. During flood periods from 1996 to 2004, power relationships, with daily flux and flow rates, match better than for the rest of the time, especially for flow rates in excess of 500 m3 s−1 (r2 = 0.65, with figures for 16 days, Eq. (2)), and steadily decline if flow-rate thresholds over 450 m3 s−1 (r2 = 0.52 with records for 36 days) or 400 m3 s−1 (r2 = 0.49, with 60 days) are used instead. For days when the daily flow rate is over 500 m3 s−1, the daily transit can be modelled by Eq. (3):
| (3) |
Strictly speaking, the basic monthly transit (Qsm, Eq. (2)), including daily flow rates over 500 m3 s−1 only, should be estimated based on a new monthly flow rate. This approach has not been adopted, however, as its effect on final results is minimal, and it unnecessarily and probably deceptively complicates estimations of transit. For the three years in which a major rising-water event was observed, taking the sedimentary transit of episodes over 500 m3 s−1 into account raised estimations of annual transit from 2.2 Mt to 3.1 Mt in 1999 (3.2 Mt were estimated from measurements), from 2.3 Mt to 2.9 Mt in 2001 (3.0 Mt measured) and from 0.8 Mt to 1.0 Mt in 2004 (1.7 Mt measured).
Overall, for the period between 1996 and 2004, taking into account, if only partially, such rising-water events over the threshold of 500 m3 s−1 thus clearly improves the accuracy of final estimations of monthly sedimentary transit. The relationship between calculation and measurement of flux is improved, with a Bravais–Pearson coefficient of 0.82 instead of 0.62, when an estimation does not include daily flows of 500 m3 s−1. The period for which data are missing, from September to December 1998, can thus be reconstituted in monthly stages with a certain degree of confidence in as much as the Isere was generally fairly low during that time. For the years measured, apart from 1995 and 2005, annual SM flux ranged from 0.89 to 3.16 Mt yr−1 (Table 2), with monthly fluxes between 0.012 Mt (January 2002) and 1.78 Mt month−1 (in May 1999).
As reconstituted since 1960, fluctuations of monthly and annual flux have increased slightly in amplitude, while remaining within the same general scale of values. Thus, over the 46-year period studied, the monthly flux varied by a ratio of 1:333, compared with a ratio of about 1:13 for the annual flux. These ratios naturally reflect the importance of rising-water events for sedimentary transit, but above all indicate considerable seasonal variations, intra-annual fluctuations being considerably greater than interannual ones.
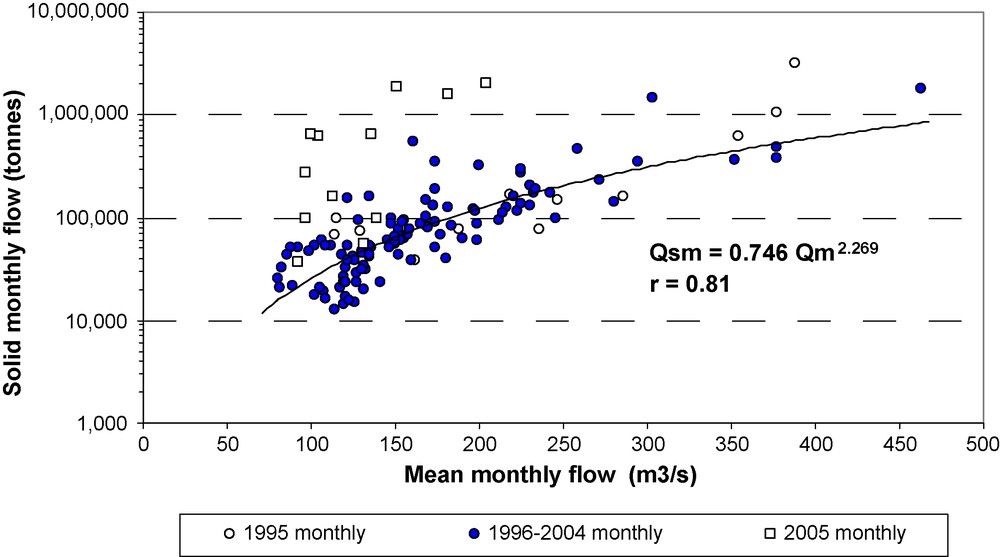
For the period going from 1996 to 2004, the mean measured SM flux was a little over 1.54 Mt yr−1, i.e. a specific flux of 270 t km–2 yr−1. The period studied nevertheless shows a mean model for the Isere slightly lower (167 m3 s−1) than the one calculated over 46 years (183 m3 s−1). Over the period from 1960 to 2005 (Fig. 4), mean SM export by the Isere, according to the estimations derived from reconstitutions (Qsm + Qsd), amounted to 1.76 Mt yr−1, i.e. a specific flux of 308 t km−2 yr−1. Based on a larger number of samples and figures for sedimentary flux given in monthly steps over 46 years, this mean figure thus gives a more accurate revised estimation than that of 2.20 Mt yr−1, reached in a previous study [10].
Evolution of the annual sedimentary flux in the Isere (measured and calculated), and in the Rhone, estimated from the model of Pont et al. [29].
Fig. 4. Évolution des flux sédimentaires annuels de l’Isère (mesurés et calculés) et ceux du Rhône, estimés avec le modèle de Pont et al. [29].
When solid flow rates of the Isere and the mouth of the Rhone are compared, based on a reconstitution of the Rhone's ones using the model by Pont et al. [29], both rivers show fairly similar annual transit variations (Fig. 4). From 1960 to 2005, the Isere contributed an average of around 11% of the volume of the Rhone's annual flow as measured at Beaucaire, but an average of nearly a quarter of the Rhone's annual sedimentary transit. However, the latter figure hides considerable interannual variations, on the one hand, and a clear tendency towards a drop in the Isere's contribution to the Rhone's SM sedimentary transit, with an average of 35% in the early 1960s, compared with an average of 22% at the beginning of the 21st century, on the other hand.
4 Comparisons with other Alpine rivers and streams
The specific annual flux of the Isere, calculated at around 310 t km–2 yr−1, does not show the extent to which its sedimentary inputs are actually spatially heterogeneous. The Arc supplies the Isere with its greatest quantities by far of SM, particularly via the former's own tributary, the Arvan [19]. The mean specific annual flux of the Arvan exceeds 2500 t km–2 yr−1 for a steeply-sloping basin of about 200 km2; at the confluence of the Arc and the Isere, this drops to 766 t km−2 yr1 for a basin of almost 2000 km2 [19]. Such a difference is by no means unusual for a basin covering a large area [21], especially when a mountain region of considerable lithological complexity is involved, leading to the geographical diversity of sedimentary inputs. In the Isere River's basin, the sector most favourable to sedimentary input is in fact the Maurienne Valley (through which the Arc flows), with its mostly-bare slopes and geological formations highly susceptible to erosion: Lias schist on the Arc's left bank (particularly the Arvan basin) and lustrous shale upstream from Modane. In the northern sector, the basins of the Tarentaise Valley (the upper Isere) appear less erodible due to more extensive plant cover, even where the geological formations are vulnerable ones [14]. Finally, basins located on external crystalline massifs (e.g., the Belledonne Range) are less vulnerable to erosion, due to the geological formations’ resistance and extensive plant cover.
The mean specific erosion rate of the Isere, lower than the Arc's one, nevertheless comes well within the range of 250 to 350 t km–2 yr−1 put forward for the eastern edge of the Pyrenees [36,37], and significantly exceeds the European average of between 30 and 80 t km–2 yr−1 [6,18]. It fits the figures for a number of major mountain watercourses, whose basins drain comparable areas [21,33,34]. Examples from Switzerland include the Arve at Geneva (299 t km–2 yr−1 for a basin of 2079 km2), the Alpine Rhone at Porte de Scex (320 t km−2 yr−1 for a basin of 5220 km2), and the Alpine Rhine at Bad Ragaz (323 t km−2 yr−1 for a basin of 4455 km2). The mean specific flux of the Isere is also comparable to (and in some years exceeds) that of the Durance, evaluated at 360 t km−2 yr−1 [1], a river located in the Alpine Arc, but in a region under a much more Mediterranean influence.
Over the whole Alpine Arc, in fact, it is in small sectors and drainage basins of the most southerly parts (‘les Alpes du Sud’), especially in areas of black marl, that the highest rates of erosion have been observed, usually ranging between 12,500 and 20,000 t km−2 yr−1 [8]. In local areas, figures can even exceed 60,000 t km−2 yr−1 [17]. Such rates of erosion, as measured in the ‘Alpes du Sud’, are nevertheless a great deal lower in river basins that are more extensive. Studies of sedimentary silting at various dams [7,9] have resulted in erosion figures of 2500 t km–2 yr−1 for the Claps dam (with a basin of 182 km2), 900 t km−2 yr−1 for the L’Escale dam (with a basin of 3500 km2), 414 t km−2 yr−1 for the Serre–Ponçon dam (with a basin covering 3000 km2), and 90 t km–2 yr−1 for the Cadarache dam (a basin of 5500 km2). Such high spatial variations of specific erosion are also found in the northern Alps [7,9,41], where sedimentary silting of dams shows the following rates of erosion: 670 t km–2 yr−1 at the Sautet dam (for a basin of 1000 km2), 490 t km−2 yr−1 at the Verney dam (for a basin of 120 km2), 220 t km−2 yr−1 at the Chambon dam (for a basin of 220 km2), even going as low as 90 t km–2 yr−1 at the Aussois dam (for a basin of 150 km2). Such spatial variability of erosion can also be found over the whole of a watercourse itself; it has been described in the Northwest of Italy, for example, for the Dora Baltea, an Alpine tributary of the Po River. Sedimentary transport of SM is higher in the upper part of the basin and diminishes going downstream, with specific erosion figures of 553 t km–2 yr−1 for a basin of 543 km2, 265 t km−2 yr−1 further downstream for a basin of 1303 km2, and 181 t km−2 yr−1 for a basin of 3264 km2 [39].
Even when confined within the Alpine Arc, however, comparisons are difficult to make properly, as local characteristics specific to each basin have a strong influence on the intensity of the sedimentary flux. The basin size is one important explanatory factor, but definitely not the only one. Studies of the sedimentary silting of Alpine dams have moreover partly highlighted this complexity (see above). The Alpine Rhine at Lustenau (Austria) is an extremely good example, since specific annual SM flux exceeds 1800 t km–2 yr−1 there, despite a basin covering an area of over 6000 km2 [21]. Conversely, the mean annual flux of the Glatt, observed at Rheinfelden in Switzerland, is 8 t km−2 yr−1 for a basin of 416 km2 [34]. Similarly, in the Alps of northeastern Italy, the Rio Cordon, with a basin of 5 km2, has a mean specific erosion of only 69 t km−2 yr−1 [16]. A study of SM flux over a score of Swiss Alpine watercourses has clearly shown that flux is independent of the area of the drainage basin, and that there is considerable geographical variation in figures, ranging from 8 to over 1500 t km−2 yr−1 for basins covering areas of between 350 and 1500 km2 [34]. Comparisons must also be treated with a great deal of circumspection when authors do not give annual means. When, as is frequently the case, interannual variations of SM flux are high, such comparisons are actually meaningless. In the Bavarian Alps of Germany, two confluents of the Danube have annual rates of erosion ranging respectively from 2 to 86 t km−2 yr−1 for the Partnach, and from 180 to 1500 t km−2 yr−1 for the Lahnenwiesgraben [35].
In addition to the information outlined herein and the model of SM flux defined (potentially enabling easier future management of the Isere's sediments), the present study's analysis of the Isere's sedimentary transit, reconstituted for the last four decades, has resulted in a reliable, representative mean figure of sedimentary flux, and thereby made a valuable contribution to a yet-to-be-made synthesis of sedimentary flux on the scale of the whole Alpine area.
5 Conclusion
Downriver from Grenoble, the Isere no longer seems to export river-bottom sediments [27,32,38]. The large number of obstacles built in the beds of the different watercourses undoubtedly hinders the transport of solids, to the extent that there are probably no longer any large-sized materials reaching the confluence of the Drac and the Isere. On the other hand, the transit of suspended sediments in the Isere, with a mean annual flux estimated 1.76 Mt yr−1 over recent decades, remains at significant levels.
The contribution of extrapolation to all estimations of sedimentary transit is still, and will probably long remain, a considerable one in this type of evaluation. Concerning the Isere, this is evidenced, moreover, by Pardé's series of estimations [24–26]; hence the need to specify the sources and methods of evaluation used (measurements or other, number of samples, figures estimated from a model, etc.) and to link the latter to the figures given. The results presented are the first to have been established for the flux of suspended matter in an important Alpine watercourse. There are still very few continuous, decade-long data available for the Alps. On the scale of the Isere basin, the annual and monthly sedimentary fluxes are obviously heavily dependent on water volumes. Nevertheless, rising-water periods, during which a significant proportion of annual solid flow is transported, upsets these relationships. In consequence, it would be interesting to improve current knowledge of monthly flux, reached by default, by making further estimations, on a daily basis, of sedimentary transit produced by such hydrological incidents.
Acknowledgements
The author wishes to thank J.-L. Peiry (Professor at the University of Clermont-Ferrand) for having provided part of the equipment for measuring SM at the Grenoble Campus station, P. Bois (professor at the INPG) and the INPG for permitting access to the Campus’ hydrological station. The author also extends his thanks to the two anonymous reviewers for their remarks and comments.
1 The figures for total annual tonnes are taken for purposes of comparison from data given by various authors for the Isere at Grenoble; the figures for specific flux will be used later to compare different drainage basins.