

1 Introduction
Since 1970, West Africa has experienced one of the most abrupt and long-lasting changes of climate ever in the world since the beginning of the records in 1896 [5,15,27,33,34]. This period of rainfall decrease is still ongoing [9,21,22], although less strong since the mid 1990s than during the 1980s. The average rainfall over the last 37 years has remained below the 1900–1970 average in this region with large scale consequences [16]. From a hydrological point of view, the relevant question for West Africa is: how has climate change (and especially the rainfall decrease) affected the rainfall–runoff relationships and the river regimes?
For almost all the rivers of West Africa, runoff has decreased since 1970. However, the changes in the rainfall–runoff relationships are disproportionate [26], and even show paradoxical situations. The first hydrological paradox in West Africa is that in most cases the runoff decrease rate largely exceeds that of the rainfall, which is explained mainly by the long-lasting lowering of the water table, and hence less and less contribution from the baseflow to the river regime after 1970 [4,25,26].
In regions more arid, as in the Sahel, only surface runoff drives the hydrological regime [6,7]. A few long-time runoff series for this region have been recently studied, from which has been described the second paradox: the increase of runoff coefficients of the Sahelian rivers since 1970. Pouyaud [37] and Seguis [38] had already observed such an increase but only for very small catchments. Recent studies show that these hydrological changes also modified hydrological regimes of large Sahelian river basins [1,28,29], while Favreau et al. [12] showed an increase of the groundwater level in Niger, related to the same runoff increase in a context of endoreic basins.
In this article, we present an update to 2006 of the Sahelian rainfall index of L’Hote et al. [21], to see what is the current state of the Sahel drought. We discuss the regional variability of the drought, through regional indexes, and we compare the rainfall variability to the runoff variability of several Sahelian catchments, through regional averaged runoff coefficients, to see whether the previous observations of runoff increases at local scales in Sahel is also visible at the scale of larger basins and for many different areas of Sahel.
2 Material and methods
2.1 Rainfall
After L’Hote et al. [21], we use 21 rainfall gauging stations in West and central African Sahel (Fig. 1). This figure shows the southward shift of the isohyets after 1970 (from L’Hote and Mahé [20]). Data have been updated to 2006, thanks to National Meteorological Services, and the normalized Sahelian rainfall index is now available for 111 years (Fig. 2). The number of stations is limited to 21 in order to get the greatest number of stations with the longest long time series, which can also be updated more easily.

The 21 rainfall stations used for the Sahelian rainfall index. The map of West and Central Africa show the isohyets before and after 1970 (250, 500, 1000 and 1500 mm) for the period 1951–1989 (after [20]). The areas where are located the studied basins are outlined by squares.
Fig 1. Les 21 stations pluviométriques utilisées pour l’index de pluie sahélien. La carte des pluies d’Afrique de l’Ouest et centrale montre les isohyètes avant et après 1970 (250, 500, 1000 et 1500 mm), pour la période 1951–1989 (d’après [20])). Les aires contenant les bassins versants étudiés sont représentées par des carrés.
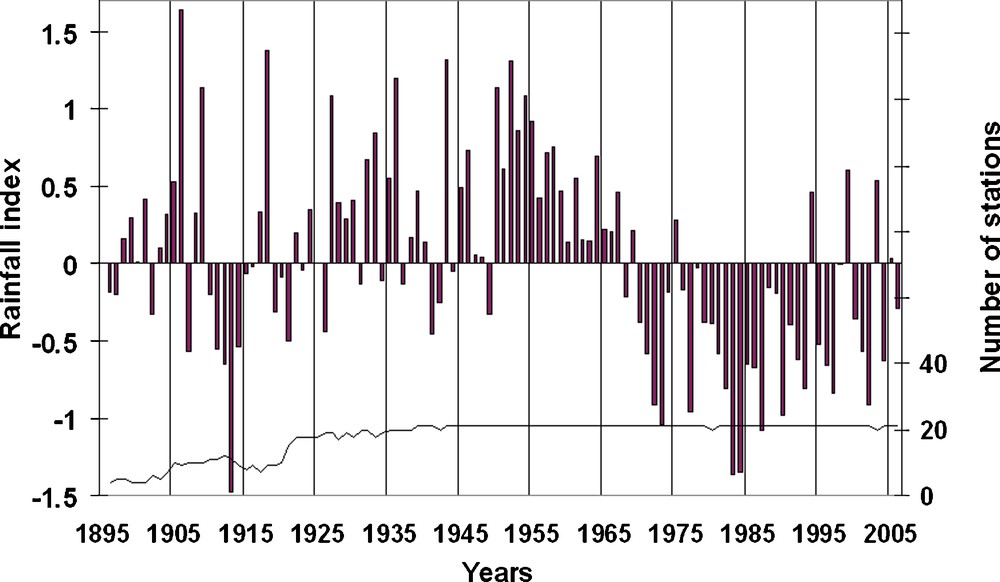
Sahelian rainfall index (1896–2006) (updated from [21]), and number of stations.
Fig. 2. Index de pluies sahéliennes (1896–2006) (mis à jour de [21]) et nombre de stations.
In order to check for regional distribution of the index, we divide the Sahelian area studied into four sub-regions, following previous results either from past records [18,31] where the latitudinal limit on both sides of the isohyet 500 mm per year was pointed out, or from future scenarios from GCMs [2], where Sahelian rainfall tend to slightly increase in the East of the Greenwich meridian, but to still decrease in the West. The raingauges of the Northwest area are: Dakar, Saint Louis, Podor, Boutilmit, Nema, Mopti and Tombouctou; of the Northeast area: Gao, Zinder, Agadez, Tahoua, Nguigmi; of the Southwest area: Banjul, Tambacounda, Kayes, Bamako, Ouagadougou, Bobo-Dioulasso; and of the Southeast area: Niamey, Ndjamena and Sahr. Each index is the average in millimeters of annual rainfall at all regional stations.
2.2 Runoff
Data come from three National Hydrological Services in Burkina-Faso, Niger and Mauritania. In Burkina-Faso and Niger, the basins studied are: Gorouol (Alcongui, Koriziena and Dolbel gauging stations), Dargol (Tera and Kakassi stations), Sirba (Garbe Kourou station), Goroubi (Diongore station), Nakambe (Wayen station). In Mauritania, the basins studied are: Niorde (Harr and Tourime stations), Ghorfa (Ghorfa aval, Ouloumbome and Ouled Addet stations), Gorgol Blanc (Agueilat and Gleita Tor stations), Gorgol Noir (Foum Gleita station). These basins are displayed in the SIEREM website (http://www.hydrosciences.fr/sierem) and a quick description of the basins is given in the Table 1. Due to data availability for some stations, the interannual study is performed before and after 1970, and the monthly study before and after 1972.
Description of the Sahelian river basins studied.
Tableau 1 Description des bassins versants sahéliens étudiés.
| Station | River | Main stream | Country | Surface km2 |
| Alcongui | Gorouol | Niger | Niger | 42,444 |
| Koriziena | Gorouol | Niger | Burkina-Faso | 2886 |
| Dolbel | Gorouol | Niger | Niger | 7515 |
| Tera | Dargol | Niger | Niger | 2750 |
| Kakassi | Dargol | Niger | Niger | 7460 |
| Garbe-Kourou | Sirba | Niger | Niger | 38,868 |
| Diongore | Goroubi | Niger | Niger | 15,739 |
| Wayen | Nakambe | Volta | Burkina-Faso | 20,241 |
| Haar | Niorde | Senegal | Mauritania | 1550 |
| Tourime | Niorde | Senegal | Mauritania | 480 |
| Ghorfa Aval | Ghorfa | Senegal | Mauritania | 5020 |
| Ouloumbome | Ghorfa | Senegal | Mauritania | 2500 |
| Ouled Addet | Ghorfa | Senegal | Mauritania | 1125 |
| Agueilat | Gorgol Blanc | Senegal | Mauritania | 8370 |
| Gleita Tor | Gorgol Blanc | Senegal | Mauritania | 3770 |
| Foum Gleita | Gorgol Noir | Senegal | Mauritania | 8950 |
3 Sahelian rainfall variability 1896–2006
The Sahel can be defined by several characteristics. The most commonly used is the amount of annual rainfall. Between May and October, with a rainfall maximum usually in August, annual rainfalls reach between 250 and 750 mm from the north to the south. The rainfall variability over West Africa and particularly over the Sahel is naturally high. The rainfall drought during the 1980s, relative to the 1950s, is about 10–15% over tropical humid Africa, and about 15–20% over the Sahel. Since the mid 1990s, the rainfall average over the region slightly increased to reach the level of 1970s rainfall. The interannual rainfall variability indeed increased since 1994, with more years above the mean, but with occurrences of several very dry years in a row (Fig. 2). Then the rainfall average during the 1990s and the 2000s is above the 1980's mean, but similar to the 1970's mean.
On Fig. 3, the four subregional Sahelian regions are displayed. The southwest region is the more humid and the northeast the driest. The interannual variability follows similar trends in each region but the variability is greater in the south than in the north. The variability is the same in all regions since the end of the 1960s and the beginning of the drought in 1970. The indexes follow identical trends in the Northwest and the Northeast Sahel, with rainfall most often lower in the east. On the other hand, the variability in the southeast is different from that in the southwest. In the southwest, annual rainfalls were each year greater than in the southeast until the mid-1970s. Since then, annual rainfalls are quite similar, and rarely greater in the southeast than in the southwest.

Four Sahelian subregional rainfall indexes (1896–2006): North and South of 500 mm annual rainfall, East and West of Greenwich meridian.
Fig. 3. Quatre index de pluies sahéliennes sous-régionales (1896–2006): Nord et Sud de 500 mm de pluies annuelles ; et Est et Ouest du méridien de Greenwich.
Rainfall changes are more obvious when studying the variability around 1970 (Table 2). The rainfall decrease is similar in the northwest and the northeast, lower in the southwest, and much lower in the southeast (Table 2). Some rupture tests [24] show slightly different results according to the period used (Table 3). Considering the 1921–2006 period (due to lack of data for some stations before 1921), there are temporal breaks detected in times series for all subregions, except for the southeast with the Hubert test (segmentation test). Breaks are negative and detected in 1969 (northwest and northeast) or 1970 (southeast). The southwest varies differently with breaks occurring sooner, in 1966, or 1962 (Hubert), and with a positive break recorded in 1950, which lasts 11 years and is known as “Petit pluvial” in this part of Sahel. Considering the 1951–2006 period, the results vary more from one sub-region to another. Negative breaks are recorded for all regions, with very different results with Hubert's test in regard to both Pettitt and Lee and Heghinian tests. Only one positive break is recorded in 1994 for the southeast, which clearly points out this area as the least affected by the Sahel drought. For all the regions Pettit and Lee & Heghinian tests show a rupture between 1966 and 1970, while the Hubert test shows various years from 1959 to 1981. Both north sub-regions show two negative ruptures according to Hubert's test, in 1959, and during the 1970s. So the addition of the recent years induced no change in the segmentation test results published in the end of the 1990s [21].
Rainfall statistics for the four Sahelian subregions, in millimeters.
Tableau 2 Statistiques des pluies pour les quatre sous-régions sahéliennes, en millimètres.
| Sahel rainfall | Northwest | Northeast | Southwest | Southeast |
| Before 1970 | 374.0 | 334.0 | 967.0 | 689.0 |
| Standard deviation | 83.0 | 85.0 | 133.0 | 163.0 |
| After 1970 | 272.0 | 246.0 | 799.0 | 671.0 |
| Standard deviation | 58.0 | 59.0 | 102.0 | 107.0 |
| Rainfall ratio after/before 1970 | 0.73 | 0.74 | 0.83 | 0.97 |
| Standard deviation ratio after/before 1970 | 0.70 | 0.69 | 0.77 | 0.65 |
Years for which three detection tests find significant ruptures in times series of the four subregional indexes.
Tableau 3 Années de ruptures significatives dans les quatre séries chronologiques sous-régionales détectées selon trois tests.
| Region | Period | Rupture test | ||
| Pettit | Lee & Heghinian | Hubert | ||
| Northwest | 1921–2006 | 1969 | 1969 | 1970 |
| 1951–2006 | 1969 | 1969 | 1959 & 1971 | |
| Southwest | 1921–2006 | 1966 | 1966 | 1950 & 1962 |
| 1951–2006 | 1967 | 1966 | 1962 | |
| Northeast | 1921–2006 | 1969 | 1969 | 1970 |
| 1951–2006 | 1969 | 1967 | 1959 & 1977 | |
| Southeast | 1921–2006 | 1970 | 1970 | None |
| 1951–2006 | 1970 | 1969 | 1981 & 1994 |
4 Relationship between rainfall deficit and recent changes in Sahelian hydrology
4.1 The counter-intuitive Sahelian paradox
Rainfall and runoff for hundreds of river basins have been studied in West Africa [25]. For nearly all basins, we observe a runoff reduction around 1970, except for Sahelian Rivers [28]. Figs. 4 and 5 show the runoff coefficient increase relative to the rainfall variability from 1970 both in the Central Sahel (Burkina-Faso and Niger, Fig. 4) and in the western Sahel (Mauritania, Fig. 5). Increasing runoff coefficient (runoff/rainfall ratio) means that the same rainfall produces more runoff now than before. It is also surprising to report that during the same period human consumption and dam storage capacity have increased over the Nakambe basin, from 55 million m3 in 1965 to 170 million m3 in 1994 [29]. This basin is located slightly north of the intersection between the four sub-Sahelian regions outlined previously.
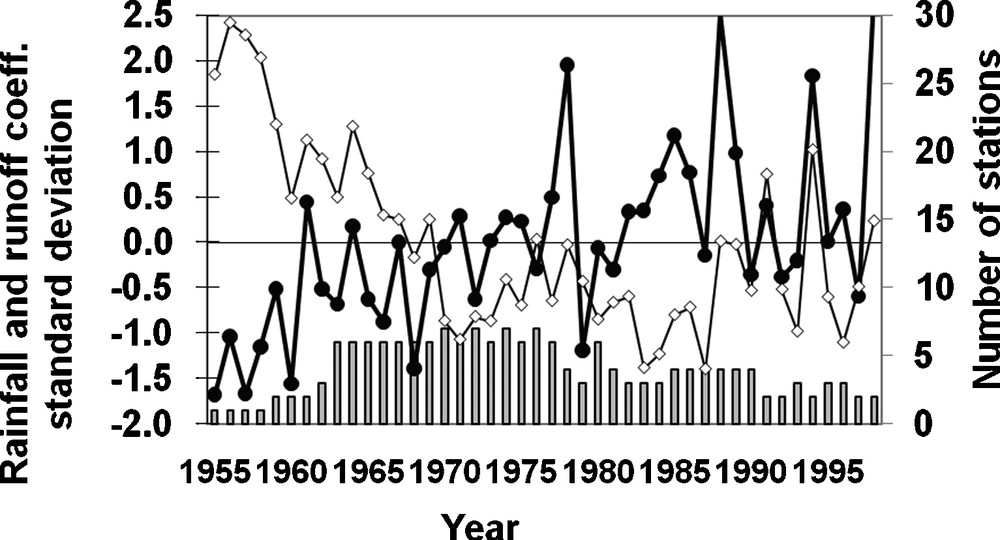
Standard deviation variability for rainfall (white dots) and runoff coefficient (black dots) for central Sahelian river basins of Burkina-Faso and Niger over the years 1955–1998 (bars: number of basins available per year, max = 7).
Fig. 4. Variabilité de l’écart centré-réduit de la pluie (ronds blancs) et du coefficient d’écoulement (points noirs) pour les rivières sahéliennes centrales du Burkina-Faso et du Niger pour les années 1955 à 1998 (barres : nombre de bassins disponibles par an, max = 7).
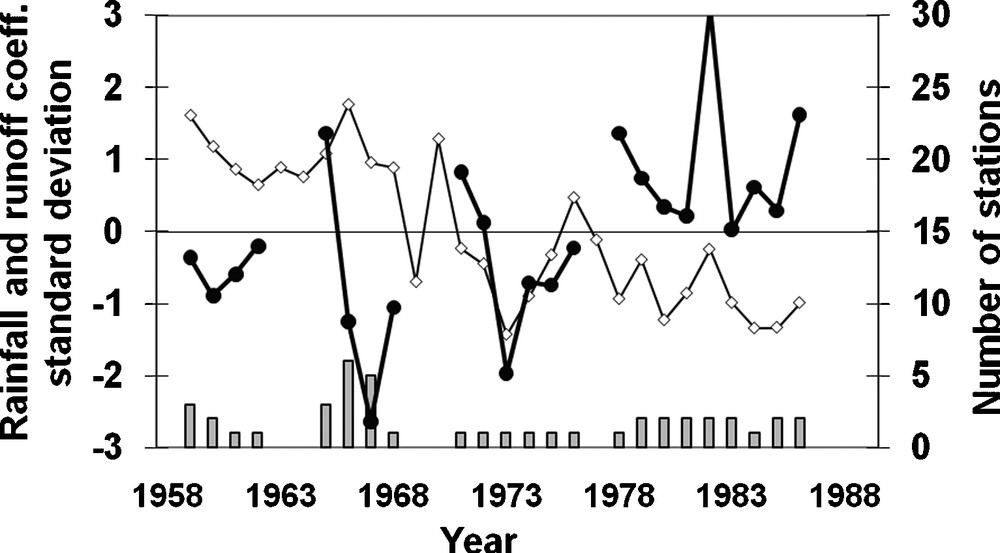
Standard deviation variability for rainfall (white dots) and runoff coefficients (black dots) for western Sahelian river basins of Mauritania over the years 1959–1986 (bars: number of basins per year, max = 8).
Fig. 5. Variabilité de l’écart centré-réduit de la pluie (ronds blancs) et du coefficient d’écoulement (points noirs) pour les rivières sahéliennes occidentales de Mauritanie pour les années 1959 à 1986 (barres : nombre de bassins disponibles par an, max = 8).
4.2 The aridification process and its impact on hydrological regimes
Over the past 35 years, by natural equilibrium, vegetation and soil have adapted to the new climatic conditions, leading to more “arid” conditions in the Sahel. However, it is very difficult to separate natural causes from human causes, because there is no basin being protected from human impacts, which could be used for reference hydrological studies. Nevertheless, the Dargol River basin, at the boundary between Burkina-Faso and Niger and close to the Nakambe River (slightly northeast of it), only poorly inhabited, could serve as a reference for comparison with highly anthropogenized basins like the Nakambe River. The Dargol basin is located at the same latitude as the North of the Nakambe basin, in Burkina-Faso; they receive, respectively, 450 and 600 mm annual rainfall. The increase of the runoff coefficient for the Dargol River at the Tera station is only 37% against 108% for the Nakambe at the Wayen station [28].
Human impact on the Sahelian environment is increasing the speed of the land cover change. Humans need to “deforest” to increase agricultural surface production. In Sahel, this means that grasses, bushes and rare small trees are removed and burned. This has several impacts on the soil-vegetation relationships [3] and makes the soil top layer very sensitive to rainfall. An impermeable crust appears which is responsible for an increase of the surface runoff and a reduction of the water holding capacity [6–8,11,36]. It must be noted that in this area, runoff coefficients are very low (a few %), as almost all rainfall is evaporated. According to Casenave and Valentin [6,7], in the Sahel, the hydrological processes are mainly surface ones, with a negligible contribution of groundwater to the flood.
It was thought since Pouyaud [37] that this increase of runoff coefficients concerned only very small catchments, and this was once more observed recently by Favreau et al. [23] or Seguis et al. [38], but other studies have shown that this runoff increase was also observed at the outlet of larger river basins [11,28,29], with very high increase of the runoff coefficients in the most inhabited areas.
4.3 Temperatures and potential evaporation
The global increase of temperature observed over the earth surface since the last century is also supposed to affect the African continent. Such an increase would increase the potential evaporation (PE) and might reduce the surface runoff consequently. We present some results about PE variations since the 1950s.
Ould [32] studied monthly and annual PE for big river catchments in West Africa, calculated from CRU data (University of East Anglia, UK) [30], over the years 1920 to 1995. PE is related to temperature changes, but also to cloud cover, air humidity and wind changes. This study shows a significant and systematic increase by about 1 to 1.5% of the annual PE (Penman-Monteith and Thom and Oliver formulas, [2]) over great rivers like the Niger and Volta. Discontinuities within monthly time series of catchments’ PE have been detected by statistical tests (Pettitt and Hubert tests, [24,35]); they all show an increase of PE since mainly the late 1970s or the early 1980s, and mainly for the months of January, April, August and September. This is mainly due to the increase of the mean of daily temperature, which is slight over Africa, only 0.5 °C, but significant since the late 1970s [15]. The predicted increase of temperature and PE over the 21st century is likely to affect West Africa river regimes by reducing discharge for most of the rivers in tropical and equatorial humid West Africa. But for Sahelian rivers the impact of the land degradation up to now has been far more important on runoff than that of the temperature increase.
5 Discussion and conclusion
Updated rainfall up to 2006 show that the drought is still continuing in Sahel, even if the annual rainfall since the mid 1990s is close to that of the 1970s, after a period of very dry years in the 1980s and up to 1993. The rainfall variability is different from the West to the East and from the North to the South of the Sahel: the highest rainfall decrease has been recorded in the Northwest Sahel, and the lowest in the Southeast. This coincides with the spatial distribution of future rainfall variability predicted by GCM outputs.
Following the beginning of the lasting drought in the 1970s, the hydrological monthly regime of the Sahelian Rivers has changed. For river basins northward of the 750-mm annual isohyet, the increase of runoff coefficients go with flood peaks occurring one month sooner, in August, according to runoff data recorded in Mauritania, Burkina-Faso and Niger (Fig. 6). This is correlated with land use/cover change, which leads to a reduced infiltration in the soil top layer due to soil crusts at the soil top surface, increasing Hortonian runoff [10,19] and thus to the reduction of the water holding capacity [13]. Thus the Sahel drought has induced a hydrological change: for the same amount of rainfall, less water can infiltrate and more water runs overland due mostly to the land degradation induced by the land-use. The discharges are higher since the first rains of the season in May, June and July (Fig. 6); the August discharges are also higher for both western and central Sahel. The flood peak occurs sooner, in August rather than in September. In details, the river discharges within eastern Sahel (i.e. Burkina-Faso and Niger) are lower in September to November since 1970, which means that the rivers dry more rapidly than before 1970. For the western Sahel, the river discharges are higher only in September since 1970, and are quite similar for the rest of the year.
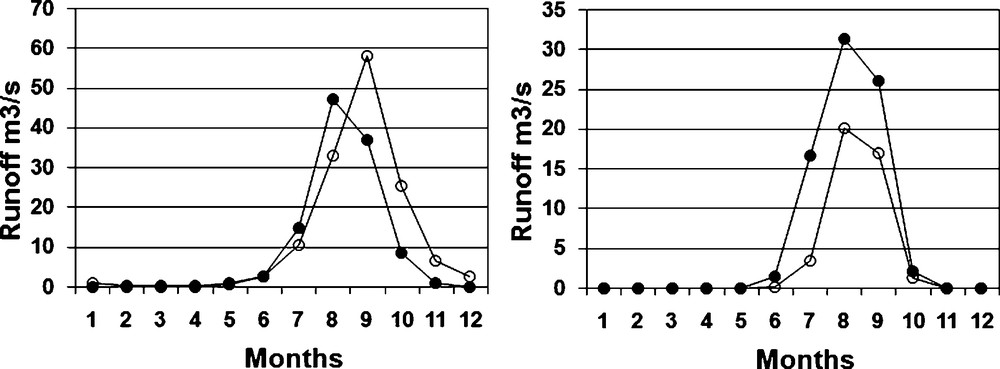
Monthly discharges up to 1972 (white dots) and after 1972 (black dots), for central Sahel countries (Burkina-Faso and Niger) (left), and for Mauritania (right).
Fig. 6. Débits mensuels jusqu’en 1972 (points blancs) et après 1972 (points noirs), pour le Sahel central (Burkina-Faso et Niger) (à gauche) et pour la Mauritanie (à droite).
This Sahelian runoff increase observed over small and medium scale watersheds has also impacted the hydrological regime of the Niger River basin at Niamey (400 000 km2). Over the period 1923–1979, the flood peak coming from the Guinean and Malian upper basin (300 000 km2) had always been the highest one. Since 1980, a higher flood peak coming from the local Sahelian tributaries (100,000 km2) has been observed several times [1,28].
It is likely that the aridification of the environment – triggered by climatic change, especially rainfall shortage – is to an important extent, enhanced by human increasing agricultural activities, leading to desertification. From the very different evolution of the runoff coefficient over the two basins of Dargol and Nakambe, and the results over other basins [28], it can be hypothesized that the human impact is responsible for a higher increase of the runoff coefficient than what it could be in this Sahelian area considering the climate impact alone. Diello et al. [11] have shown that using a time varying WHC in hydrological modelling, instead of an average fixed value, increases the performances of the model. The performances of the model are even better if the land use/cover variation is linked to the demography variations, through a logistic population model.
All studies have also noted the increasing agricultural activity, correlated with deforestation and alteration of local soil properties, specifically infiltration. It is nevertheless very difficult to separate the human induced and climate induced variability in the observed hydrological changes of Sahelian basins [14,17]. There is a need to equip a set of experimental areas as control catchments (because this cannot be achieved on ‘basins’) to differentiate the impact of climate change from the impact of the land use/cover changes.
Acknowledgements
We acknowledge the National Hydrological and Meteorological Services of Mauritania, Burkina-Faso and Niger, for providing data, and thank IRD and the FRIEND-AOC program (UNESCO IHP) for funding and support, we also thank the reviewers and Dr Didier Orange for their great support for increasing the quality of the manuscript.