


 CC-BY 4.0
1. Importance and originality of karsts
From a general point of view, responsibility, negotiation, participation, solidarity are only made possible by an awareness of the “common good” character of the groundwater, a “groundwater consciousness” [Marsily and Besbes 2017]. Groundwater resources belong to a category of natural freshwater resources that are difficult to understand and study. Since the second half of the 20th century, demographic pressure and the development of intensive agriculture have put this essential resource at risk. This strong pressure is increasing today with the visible and future effects of climate change combining a decrease in rainfall recharge and an increase in evapotranspiration. Stevanović [2019] estimates that less than 5% of the yearly renewable water in karst aquifers is nowadays exploited. Thus, karst aquifers constitute an important source of freshwater that may allow equilibrating the increasing imbalance between freshwater availability and the need for sustaining human activities (drinking water supply, agriculture, industry, and others).
Worldwide, carbonate rock outcrops cover 12–15% of the continental surface. In France, they cover 35% of the metropolitan territory, but their extension under other geological formations is much higher. According to the most recent estimate, almost 50% of the French territory is affected by karst formations [Chen et al. 2017]. Karst aquifers contribute to 40% of drinking water supply of France. [Chen et al. 2017]. About 25% of the world’s population is supplied with domestic water from groundwater taken from karst [Ford and Williams 2013].
The particular character of karst aquifers is linked to the heterogeneity of the reservoir resulting from the karstification processes. The presence of karst morphology is related to the dissolution of carbonate rocks by water enriched in CO2 by root respiration and microfauna combined with the oxidation of organic matter. The setting up of karst systems is therefore the result of complex processes such as fracturing, mechanical erosion and dissolution of carbonate rocks [Quinif 1999]. The occurrence of a large-scale multi-porosity promotes the storage of a large amount of water, but also the occurrence of complex flow behaviour leads to significant difficulties in the utilisation of this freshwater resource. A large part of the flow is thus concentrated in groundwater preferential pathways, mainly conduits or unclogged fractures, with relatively rapid flow velocities compared to those observed in porous or fissured media. Therefore, darcian flows can be observed in the matrix, while velocities around 1 mm/s can be observed in the fissures or small fractures and velocities superior to 1 m/s are often measured in the conduit network.
Another part of the flow takes place in the matrix and may have some exchanges with the preferential flow path. The hydrological behaviour of karst systems is therefore highly non-linear and non-stationary, making it difficult to characterize and predict their functioning. Karst aquifers are not only sensitive quantitatively, due to the potential evolution of recharge processes in the context of climate change [Tramblay et al. 2020] but also qualitatively, due a rapid infiltration of potential contaminants within the aquifer [Hartmann et al. 2021]. It is therefore important to be able to respond to the legitimate societal demand for access to an integrated groundwater management model.
2. Objectives
For many years, karst aquifers have been the site of numerous experiments aimed at understanding, analysing and modelling the occurrence of non-linear flow behavior. Today, this concern is stressed by the need to have access to a history of this hydrological response to identify possible non-stationarities or to corroborate the analyses already carried out for a short observation period. Several scientific operations are striving to document precisely the functioning of different hydrological compartments within OZCAR project [Gaillardet et al. 2018] and now at European level with the ELTER programme. Karst aquifers are recognised as an original compartment from both a hydrological and hydro-biogeochemical point of view and the creation of the National Karst Observation Service (SNO Karst) is the logical continuation of this awareness [Jourde et al. 2018]. Among the French karst watersheds, which are continuously monitored, the present study focuses on the Baget basin (Pyrénées, France), where the first investigations began in 1969 [Mangin 1975].
Beginning with an intense period of research activities between 1969 and 1985, monitoring of the basin was then limited to the estimation of daily flows at the main outlet until 1996, when the discharge sampling step was fixed at 30 min, first sporadically, and then continuously from 2005. Former studies [Labat 2000; Labat et al. 2011] put in evidence that a 30-min sampling rate is optimal for acquiring relevant information on the hydraulic behaviour of the basin. We describe in this contribution an enhancement of limnigraphic archives that allows to propose an estimate of hourly discharge over the last fifty years. In a second step, we compare the results already obtained using time series analysis on discharge at more restricted time intervals with the results obtained at much longer time interval in this study.
3. Study site: the Baget karst watershed
The Baget catchment area is located in the Ariège in the commune of Agert-Balaguères. The Baget valley naturally leads to the Lez valley about 10 km west of Saint-Girons. The catchment area of the Baget karst system extends from West to East over 10 km in length and 1 km width for an area of approximately 13 km2. This system is located in the metamorphic zone bounded by two faults: to the north the North Pyrenean fault, and to the south the Alas fault. The Mesozoic limestones can be considered globally as a monoclinal structure. These limestones then come into contact with the Paleozoic terrains to the north and disappear to the south under the pelitic clay-sandstone formations of the Albo-Cenomanian [Debroas 2009]. The limestones present within the basin are very homogeneous and crystalline, with a porosity of around 2%. The Lachein valley is characterized by a fairly deep furrow of 300 m which follows the longitudinal axis of the basin. The most important reliefs are in the East with the Tuc de Graué (1417 m) while the outlet is located at 498 m. The average altitude of the basin is around 923 m and its median altitude around 930 m. Within the Baget basin, several overflows should be mentioned, including the overflows of Moulo de Jaur and that of Hillère in particular.
The non-calcareous land represents approximately 33% of the total surface area and is divided into two sectors: sandstone clay pelites in the South and Upper Cretaceous conglomerates in the North. They are characterized by significant temporary superficial flow during periods of flooding. The Lachein stream thus meets the limestones about 4.5 km upstream from Las Hountas (Figure 1). At the end of low water, the waters of the stream bury themselves very quickly in contact with the limestone. During periods of average water capacity, the surface water travels 2.5 km over the limestone before disappearing and during periods of high water they progress even further downstream to get lost at the level of the Peyrère. During episodes of strong floods, the loss of the Peyrère can behave like an emergence.
Geological map of the Baget karst system and location of the gauging station (thanks to the courtesy of Ibrahim El-Khoury).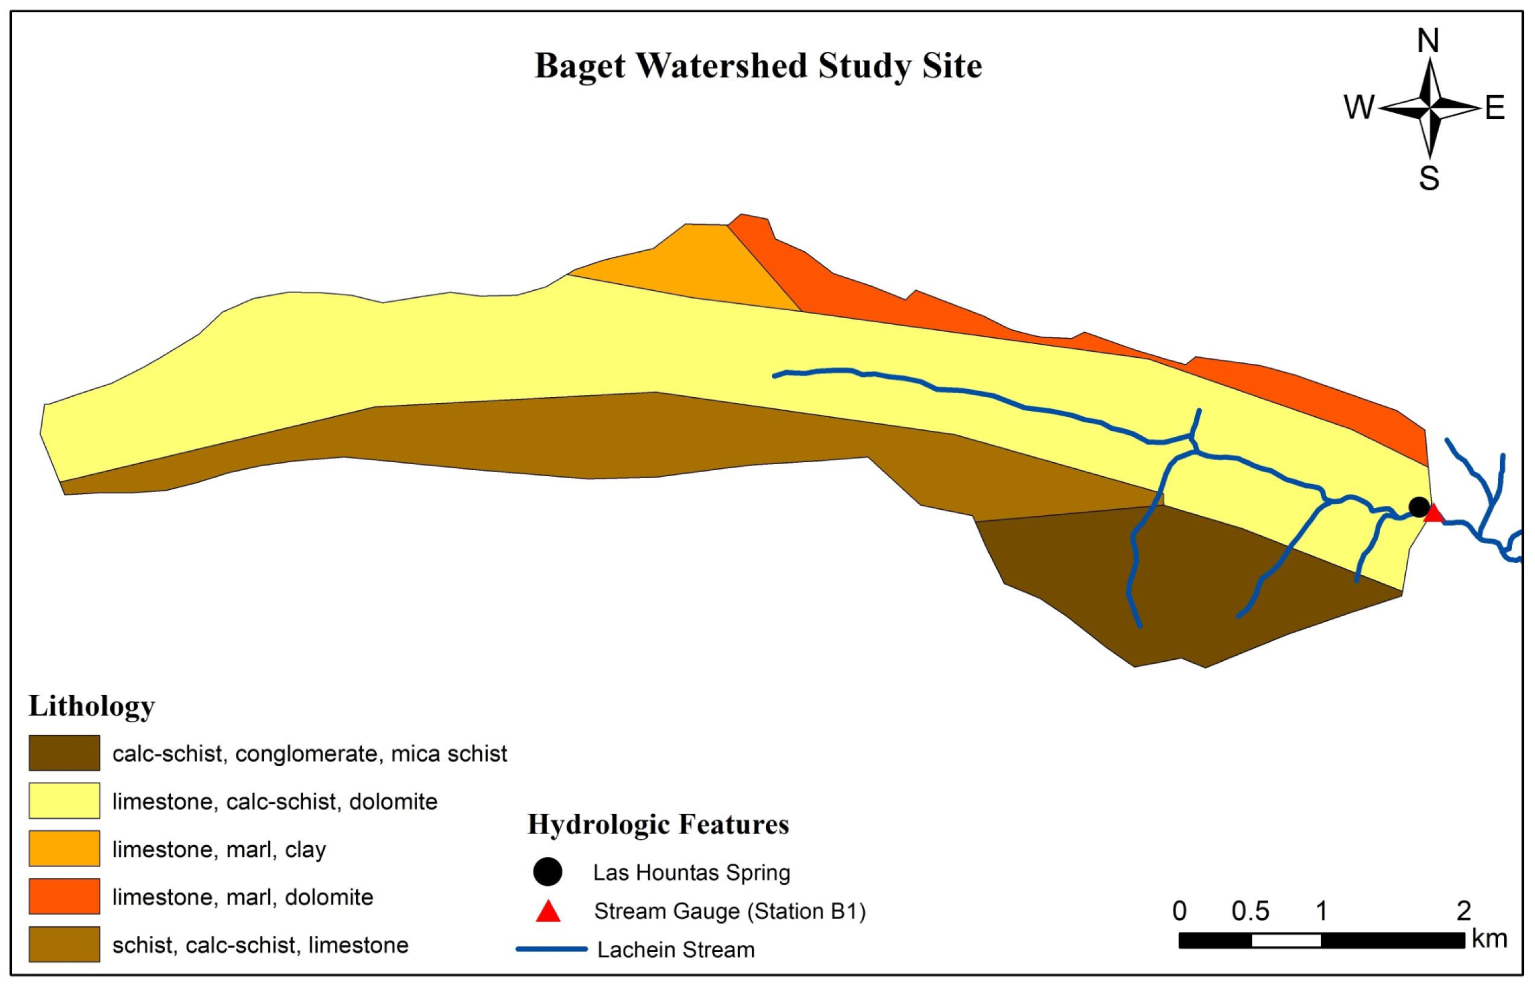
The average rainfall representative of the basin is around 1800 mm per year (with a variation rate of around 400 mm per year) with an average annual evapotranspiration estimated at around 600 mm per year. The average flow of the Baget is estimated at 0.51 m3∕s for a minimum observed flow of around 0.05 m3∕s. Overall for a typical hydrological cycle, it is estimated that 66% of the total flow volume comes from the perennial source of Las Hountas. In addition, several pumping tests with large flows were carried out in the karstic zone in 1991, showing a higher level of karstification in the upstream part of the basin and also the high potential of this karst in terms of water resources.
4. Materials
We propose here a reconstruction of the hourly flows using the limnigraphs that have been carefully kept for years. These limnigraphs have been annotated rigorously by Alain Mangin (Figure 2) through all these years. We use them to propose an estimate of the hourly flow rate at the Baget outlet over the last 50 years. The monitoring of water levels at the outlet was first carried out by the teams of the Moulis underground laboratory, with a 1/5 scale OTT 16 water level gauge until 1996. Then, a differential pressure sensor probe was installed to provide automatic acquisition. However, the discharge measurements were not completely continuous until 2005. Since 2017, the french geologic survey (BRGM Occitanie), in collaboration with the Moulis experimental ecological station, is responsible for monitoring water levels using the same equipment. Thus, for the period 2005–2012, we have at our disposal both the water level gauges and the data from the differential pressure sensor installed at the monitoring station. The long manual digitisation work, by creating the abscissa and ordinate axes from the reference data collected on-site, was carried out with the help of the software available online “PlotDigitizer”. This software allows the digitisation of the graphical documents with an average resolution of 2 to 3 h directly linked to the speed of the water level gauge clock. Thus, the periods of rising floods, in particular, are correctly estimated. In a second step, a linear interpolation was carried out to produce a continuous series of water levels over the period 1972–2008. The 2005–2008 period has been considered as a validation period for comparison of digitised data versus the differential pressure sensor data. For the period 2008–2022, we used the data available from the digitisation and the differential pressure sensor measurements were compared to validate the digitisation work. In general, the correspondence between the two sets of data was less than 3 cm. Some corrections related to the drift of the probe were also made. During the last fifty years, the hydraulic control of the rating curve at the outlet of the system has been very stable. Effectively, we estimate the discharge rate using only three successive rating curves of the station, including the construction of the artificial weir in 1976, illustrated by the step visible on the water level record. Therefore, the rating curve is still valid from 1976.
Left: Example of limnigraph digitised including the annotated information. Right: A. Mangin in front of the limnigraphic station (photo by Seifeddine Jomaa).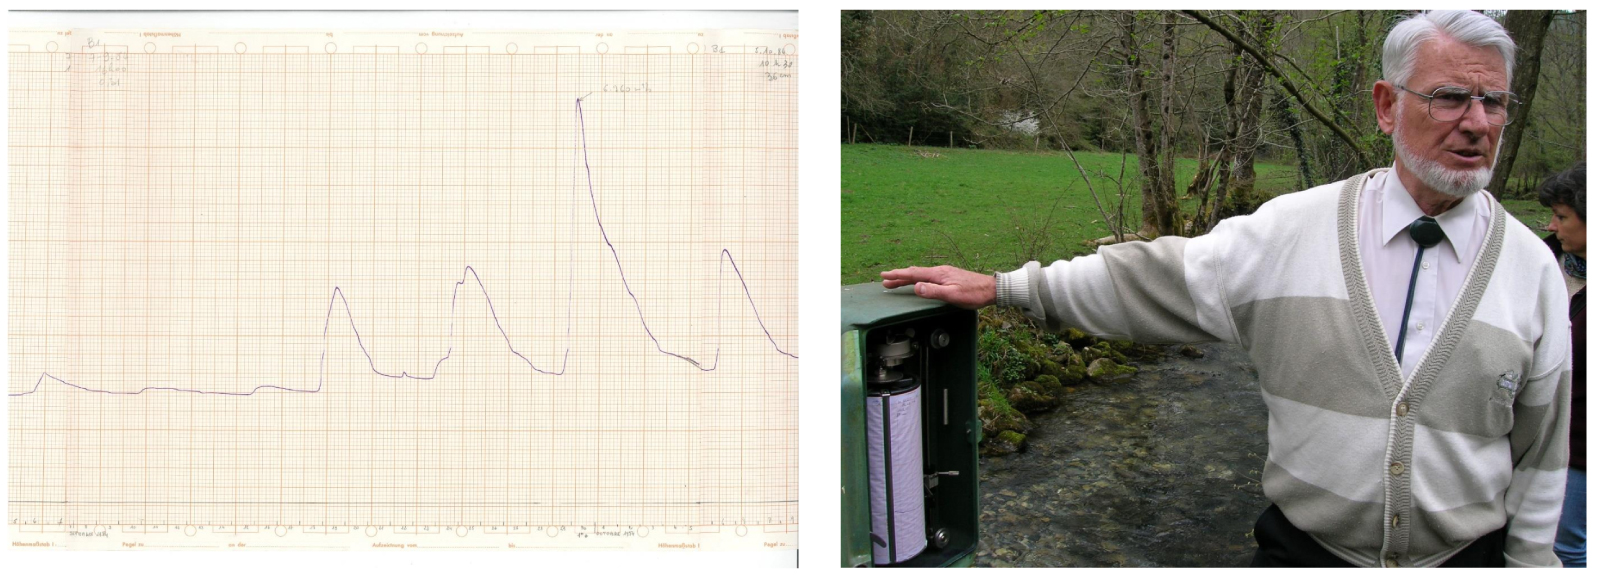
In conclusion, we already have at our disposal the daily discharge estimates from 1969 for the Baget system. Thanks to the digitization of the limnigraphs, we propose to estimate discharge at a mean sampling rate of about 3 h (depending on the hydrologic period) over the 1970–2008 time interval. The 2005–2008 time interval allows validation of the method based on a systematic comparison with in situ differential pressure sensor probe. Therefore, a linear interpolation of the digitized data permits continuous hourly estimation of the discharge data over the last fifty years.
5. Methods
Correlation and spectral analysis allow us to characterise the temporal structure of a hydrological signal [Mangin 1984; Padilla and Pulido-Bosch 1995; Larocque et al. 1998; Labat 2000]. The decay of the correlogram characterises the hydrodynamic response of the karst system to rainfall events. The shorter the decay, the more the system is characterised by high karstic conductivity. On the contrary, the longer the decay, the more the system is characterised by low karstic conductivity [Box et al. 2008]. Generally, the length of influence of an event corresponds to the memory effect with respect to the first time lag, where the correlogram reaches the value of 0.37 [Labat 2000]. The classical threshold value of 0.2 can only be applied to daily data where the decay of the autocorrelation function is sufficiently fast.
Spectral analysis constitutes another powerful statistical technique for analyzing the distribution (over frequency) of the power contained in a signal. This technique is widely used to identify patterns in data series [Box et al. 2008] and has been applied specifically in determining the presence and statistical significance of natural climate cycles in long-term series [Mathevet et al. 2004]. Thus, classical spectral analyses consist of studying the variance spectral density distribution S(f) and determining at which frequency f intervals the Fourier spectral density follows power-law behavior:
| (1) |
It is also possible to focus more specifically on the high-frequency behavior of the system to identify distinct power-law behaviors and characteristic cut-off scales.
Multifractal analysis is a method, which investigates the scale-invariance properties of a signal [Labat et al. 2002, 2013]. Multifractal analyses consist of looking more carefully and systematically at the distribution of the various empirical moments distribution function of the scale of observation. The spectral analysis only focuses on the distribution of the variance (i.e., the squared signal), whereas here we provide an insight of the time series on all q power. The dyadic discrete time series under study (rainfall or runoffs here) noted 𝜑(i) (with i = 1,…,2N) is differentiated and mean-normalized to get a new signal 𝜀1(i). This new signal 𝜀1(i) is then aggregated at intervals of increasing length 𝜆 = 2m, with m = 2,…,N, to get N discrete signals 𝜀𝜆(i), each one corresponding to a scale of observation. The next step consists in looking at the behavior of the generalized moment function M(𝜆,q) defined as the moment of the time series aggregated at a given scale 𝜆 and for a given power law q:
| (2) |
| (3) |
6. Results
The hourly discharge time series (Figure 3) represents a continuous series of more than 415,000 data points. It is possible to carry out two types of analyses: a global analysis of the series on the one hand, and an analysis of the flow series taken over disjointed two-year intervals on the other. The second analysis highlights potential non-stationarity of statistical characteristics over the period studied.
(a) Estimation of hourly water levels at the Baget outlet station and (b) estimation of discharge time series at the Baget station.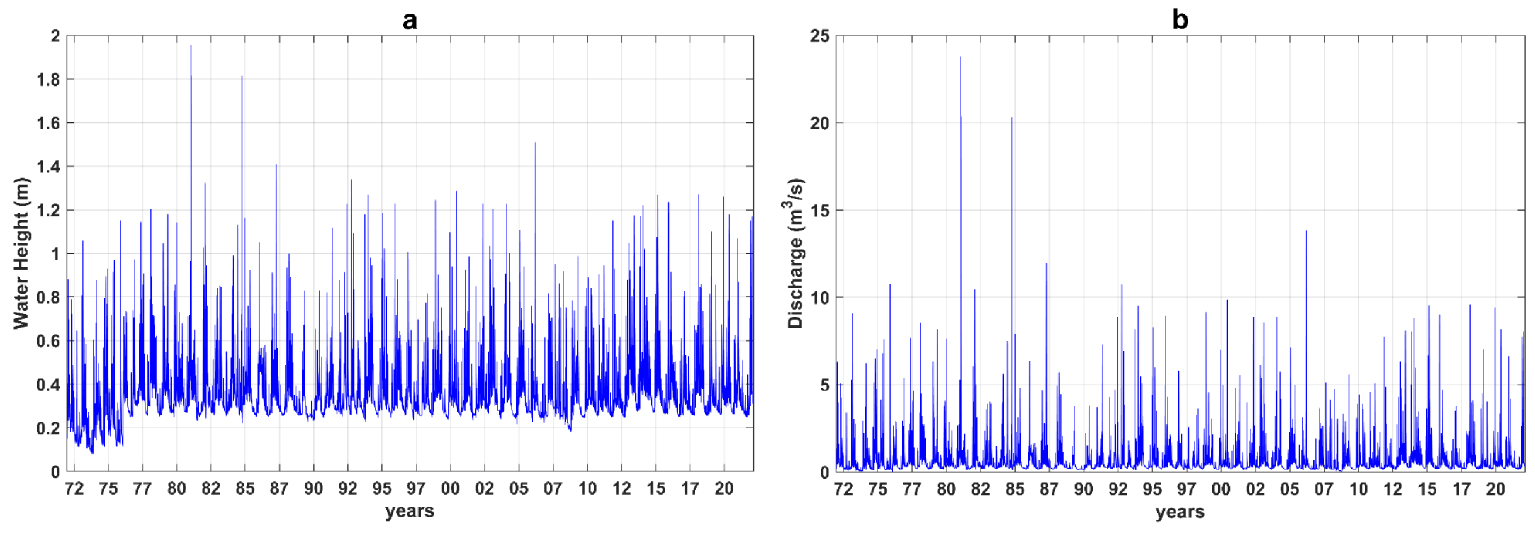
The correlation analysis of the hourly discharge estimations over the 1970–2022 period (Figure 4) shows a global memory effect of around 110 h. Previous results based on daily data indicate a large value of around 8 days [Labat 2000]. We also calculate the envelope curve of the auto correlation function corresponding for each delay time to the lower and higher value obtained from the auto correlation calculated over the disjointed two-year intervals. The examination of the envelope curve of the autocorrelation functions puts in evidence a significant non-stationarity of the function when it is estimated over successive two-year periods. A significant variation of the memory effect is then highlighted with a global variation between 50 and 320 h.
Correlation analysis of the hourly discharge time series. The red line corresponds to the correlation function obtained over the entire time interval. The two black lines corresponds to each time delay for the minimum and maximum value of the autocorrelation obtained over 25 intervals of 2 years. The memory effect obtained in these intervals is also depicted in order to highlight its variability over the last 50 years.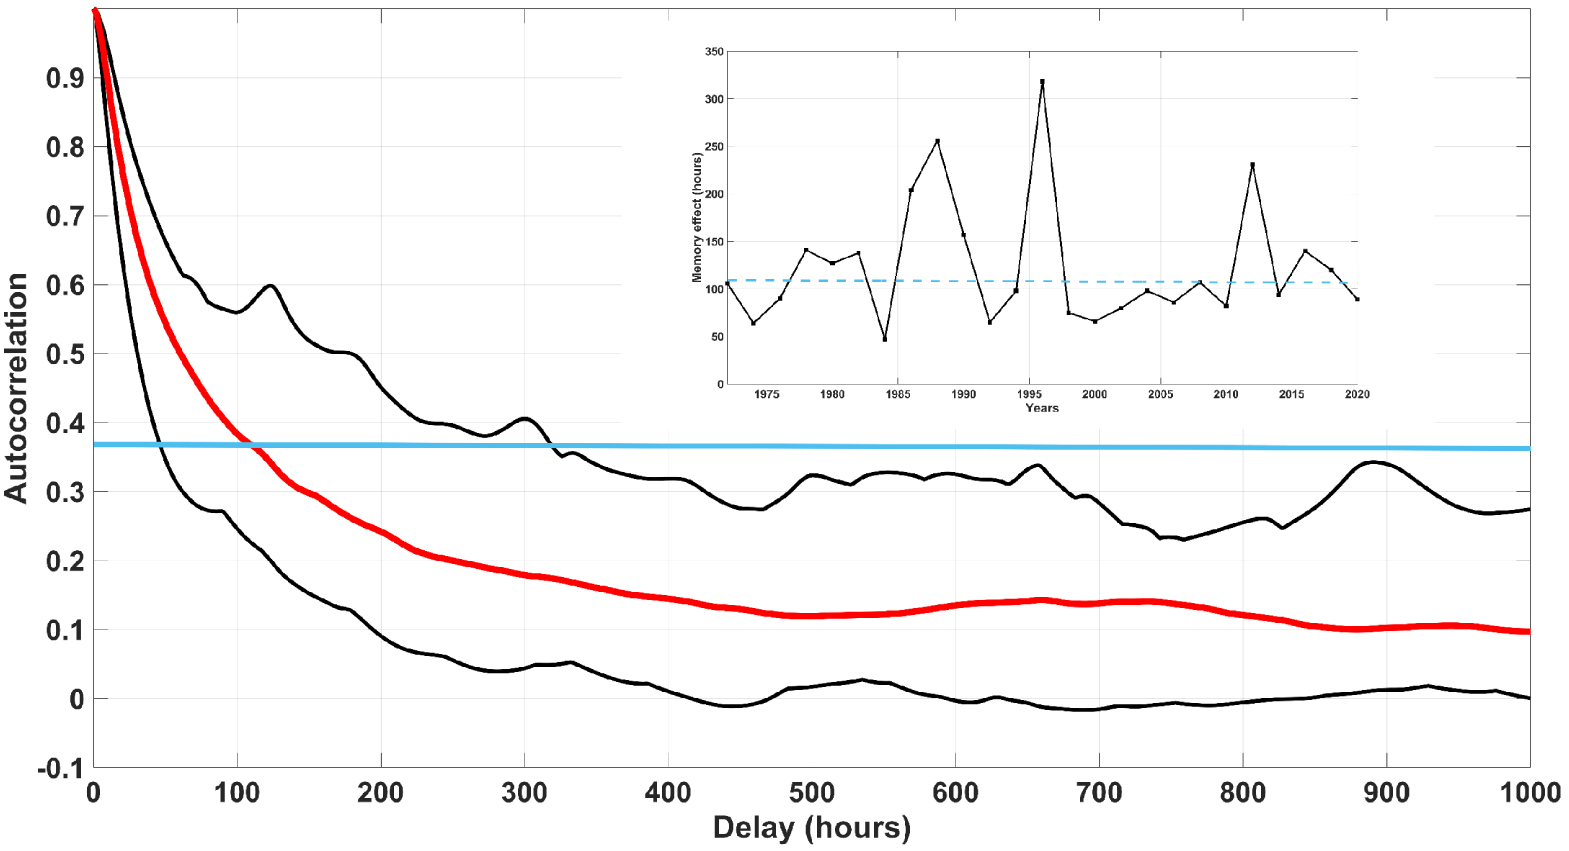
The spectral analysis (Figure 5) of the hourly discharge estimations over the 1970–2022 period shows several power-law behaviours of the variance density spectrum. Due to the size of the time series, two spectral estimates are available: an estimation of the spectrum obtained from the whole available series with a maximum truncation equal to the length of the series divided by 3 [Mangin 1984], and an estimation of the spectrum obtained by considering two-years series and thus a truncation of the order of 8 months. The first estimate correctly accounts for the annual hydrological cycle and the second estimate allows for identifying two power-law behaviours. Three intervals are highlighted on the variance density spectrum. For time scales of less than 2.5 h (i.e., a normalised frequency of 0.4 h−1), the spectrum is globally flat. This cut-off frequency is a little higher than the 30 min frequency previously highlighted, which is explained by the linear interpolation operations carried out on the first part of the chronicle where only the limnigraph was available. Thus, a power-law behaviour is visible between 4 h and 60 h (i.e. a normalised frequency of 0.015 h−1) followed by a second power-law behaviour over the interval from 60 h to 15 days (i.e., a normalised frequency of 0.0025 h−1). The high-frequency behaviour is characterised by a slope of 3.2, whereas the medium-frequency behaviour is characterised by a weaker slope of around 1.5. Finally, two peaks corresponding to scales of the order of 6 months and one year are visible, classically corresponding to the influence of snow and the annual hydrological cycle. The multifractal analysis also shows a power-law behaviour (Figure 6) over all the scales from 4 h to 2 years. It is interesting to note that in previous studies [Labat et al. 2002], a cut-off scale of around 8 days was posited. This difference is probably related to the size of the time interval. Thus, we are now able to propose a unique K(q) function for the Baget watershed and the corresponding multifractal parameters [Labat et al. 2013] are now C1 = 0.23 and 𝛼 = 1.6. These two parameters are different from previous estimations. All spectral or multifractal parameters appear to be highly dependent on the length of the time series under consideration.
Spectral analysis applied to the entire interval (black) and at 2-years intervals (blue). The different power-law behaviors are put in evidence (red) together with the different scales of cut-off.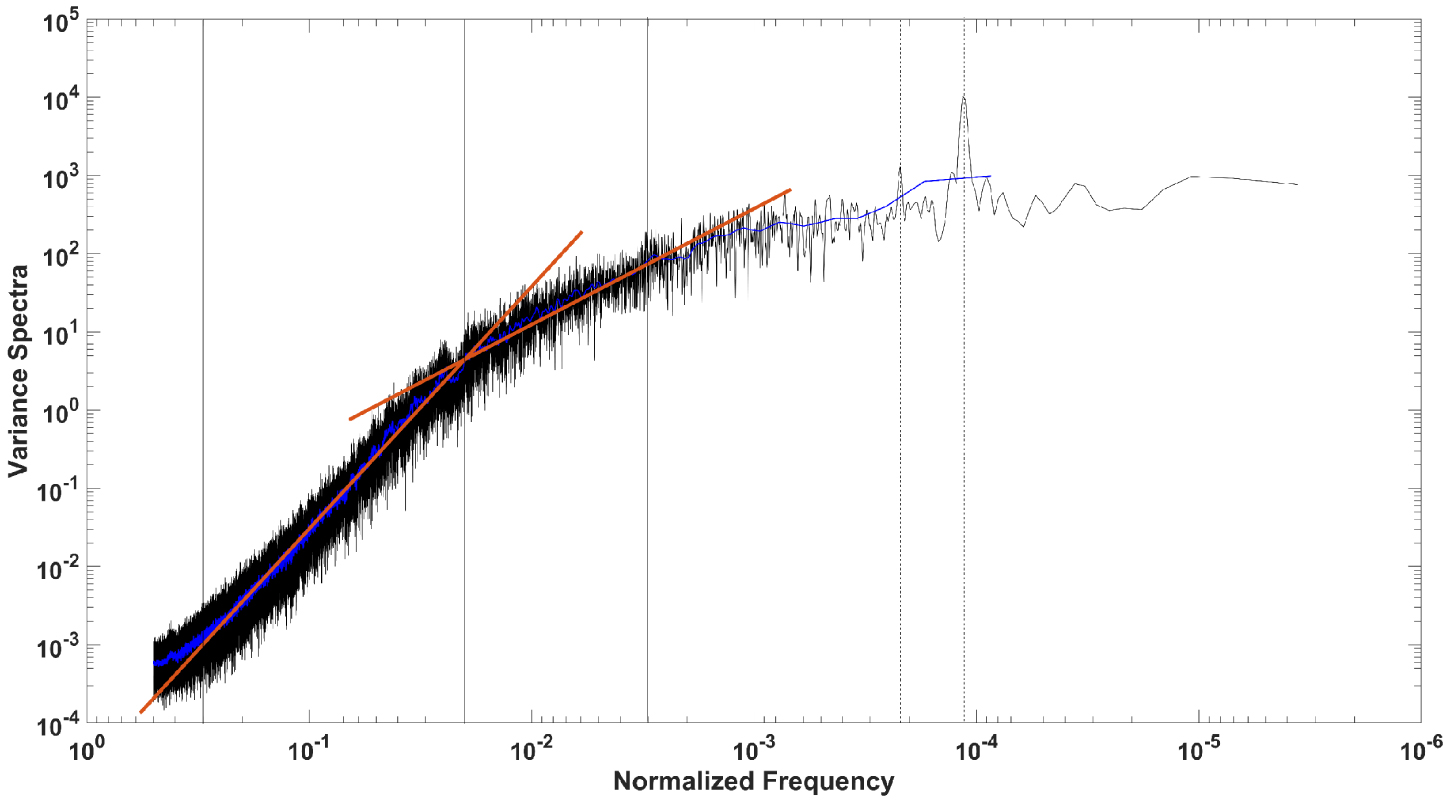
Multifractal analyses of the hourly discharge time series with the different power-law behavior of the empirical moments function and the corresponding K(q) function with the theoretical calibrated model.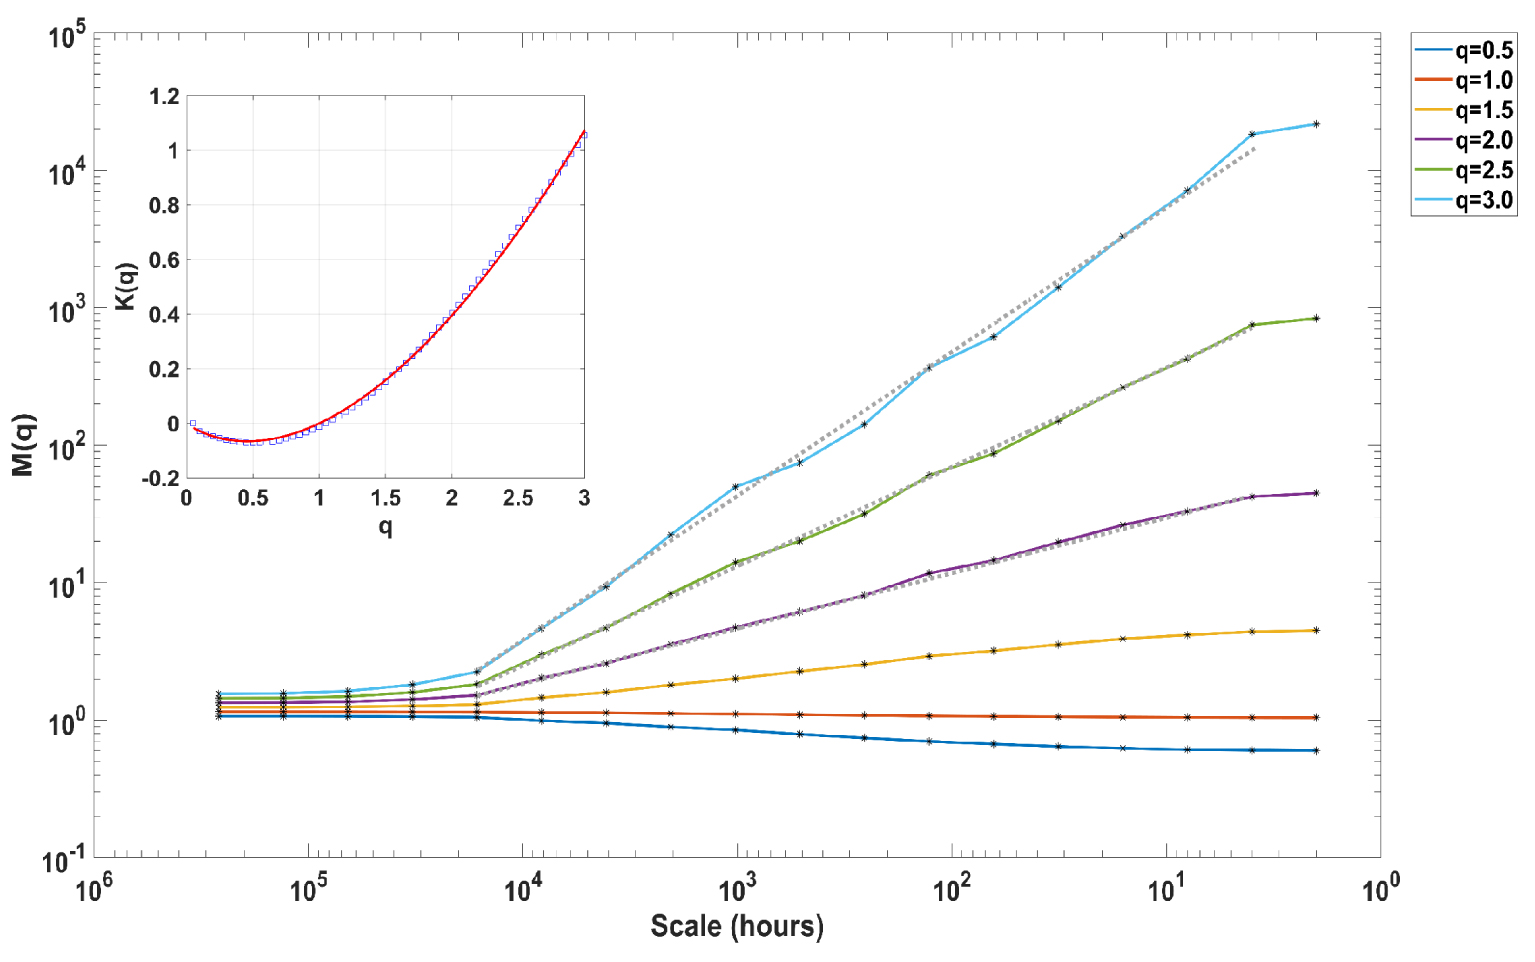
7. Conclusions and perspectives
The long-term analysis of time series is an essential step towards a better understanding of the changes occurring in hydrological systems under the simultaneous influence of climate change and various anthropogenic changes, particularly on land use. For highly reactive systems such as karst systems, the data usually available on a daily scale do not allow a high-resolution study of flood phenomena in particular. Within the framework of this study, we have proposed a method for digitising the limnigraphs, which often lie dormant in our archives. At the Baget site, it was possible to digitise these archives and thus propose an estimate of the hourly discharge time series fluctuations in this watershed over the last 50 years. The correlation, spectral and multifractal analyses applied to this series confirm and specify the multi-scale and non-stationary nature of the hydrometric series. Other water level gauges at strategic points of the basin (overflow, intermediate stations) are available and will soon be digitised to better understand the internal behaviour of the Baget basin, thanks to these archives of the past.
Conflicts of interest
Authors have no conflict of interest to declare.
Acknowledgements
The authors would like to thank the French Karst National Observatory Service (SNO KARST) initiative at the INSU/CNRS that aims to strengthen dissemination of knowledge and promotes cross-disciplinarily research on karst systems at the national scale.