


 CC-BY 4.0
1. Introduction
Seismic activity in the Lesser Antilles is recorded separately by five regional institutes (PRSN, FUNVISIS, KNMI, SRC-UWI, and IPGP), which operated 14 seismic networks during the period of study (Figure 1). The Puerto Rico Seismic Network (PRSN) operates seismic networks in Puerto Rico and in the US and the Virgin Islands, which represent the northern limit of the Lesser Antilles. The Lesser Antilles southern limit, restricted to the active volcanic arc, is monitored by the Venezuelan Foundation for Seismological Research (Funvisis), which operates seismic networks in Venezuela. Along the Lesser Antilles Arc, three seismic operators are in charge of volcanological and seismological networks in the islands. For the Netherlands Antilles, namely Saba, Sint Eustatius and Sint Marteen, seismic networks are operated by the Royal Netherlands Meteorological Institute (KNMI). In the English-speaking islands, the Seismic Research Centre of the University of the West Indies (hereafter SRC-UWI) has been operating volcanological and seismological monitoring networks since 1953 [Dondin et al. 2019]. In the French islands, the Institut de Physique du Globe de Paris (IPGP) manages two volcanological and seismological observatories (OVS-IPGP), one in Martinique (OVSM), and one based in Guadeloupe (OVSG) for the Guadeloupe archipelago as well as the French northern islands of Saint-Martin and Saint-Barthélemy. The seismic networks operated by the OVS-IPGP include both seismometer and strong motion accelerometer networks, the latter belonging to the French Réseau Accelérometrique Permanent [RESIF 1995a]. During tens of years, when data communications were not good enough to enable real-time data sharing, each of these institutions was producing its own seismic data and catalogue [Figure 1 in Bengoubou-Valérius et al. 2008]. However, between 2008 and 2013, the OVS-IPGP and the SRC-UWI have built the West Indies broadband network [network code WI, Clouard et al. 2009; Anglade et al. 2015] as the first shared high quality broadband regional seismic network. This network has been designed with two main purposes: to improve the characterization of the regional seismicity related to the subduction processes at the scale of the Lesser Antilles active volcanic arc, and to contribute to the Caribbean Tsunami Early Warning System, which has been developing since 2005, under the auspices of the Intergovernmental Oceanographic Commission of the UNESCO. While a common Lesser Antilles catalogue is not yet being produced, it should be now possible with the WI network as these data are available on international seismic data centres (such as the French seismological and geodetic network—Résif, the European Integrated Data Archive (EIDA), or Incorporated Research Institutions for Seismology (IRIS)).
Map of the seismometer stations for the arrival time datasets used in this study for earthquake locations. Stations are coloured as a function of their respective network in the International Federation of Digital Seismograph Networks convention. Convergence velocity (red arrow) between the Caribbean and the American plates comes from Symithe et al. [2015]. We limit our catalogue to the red area.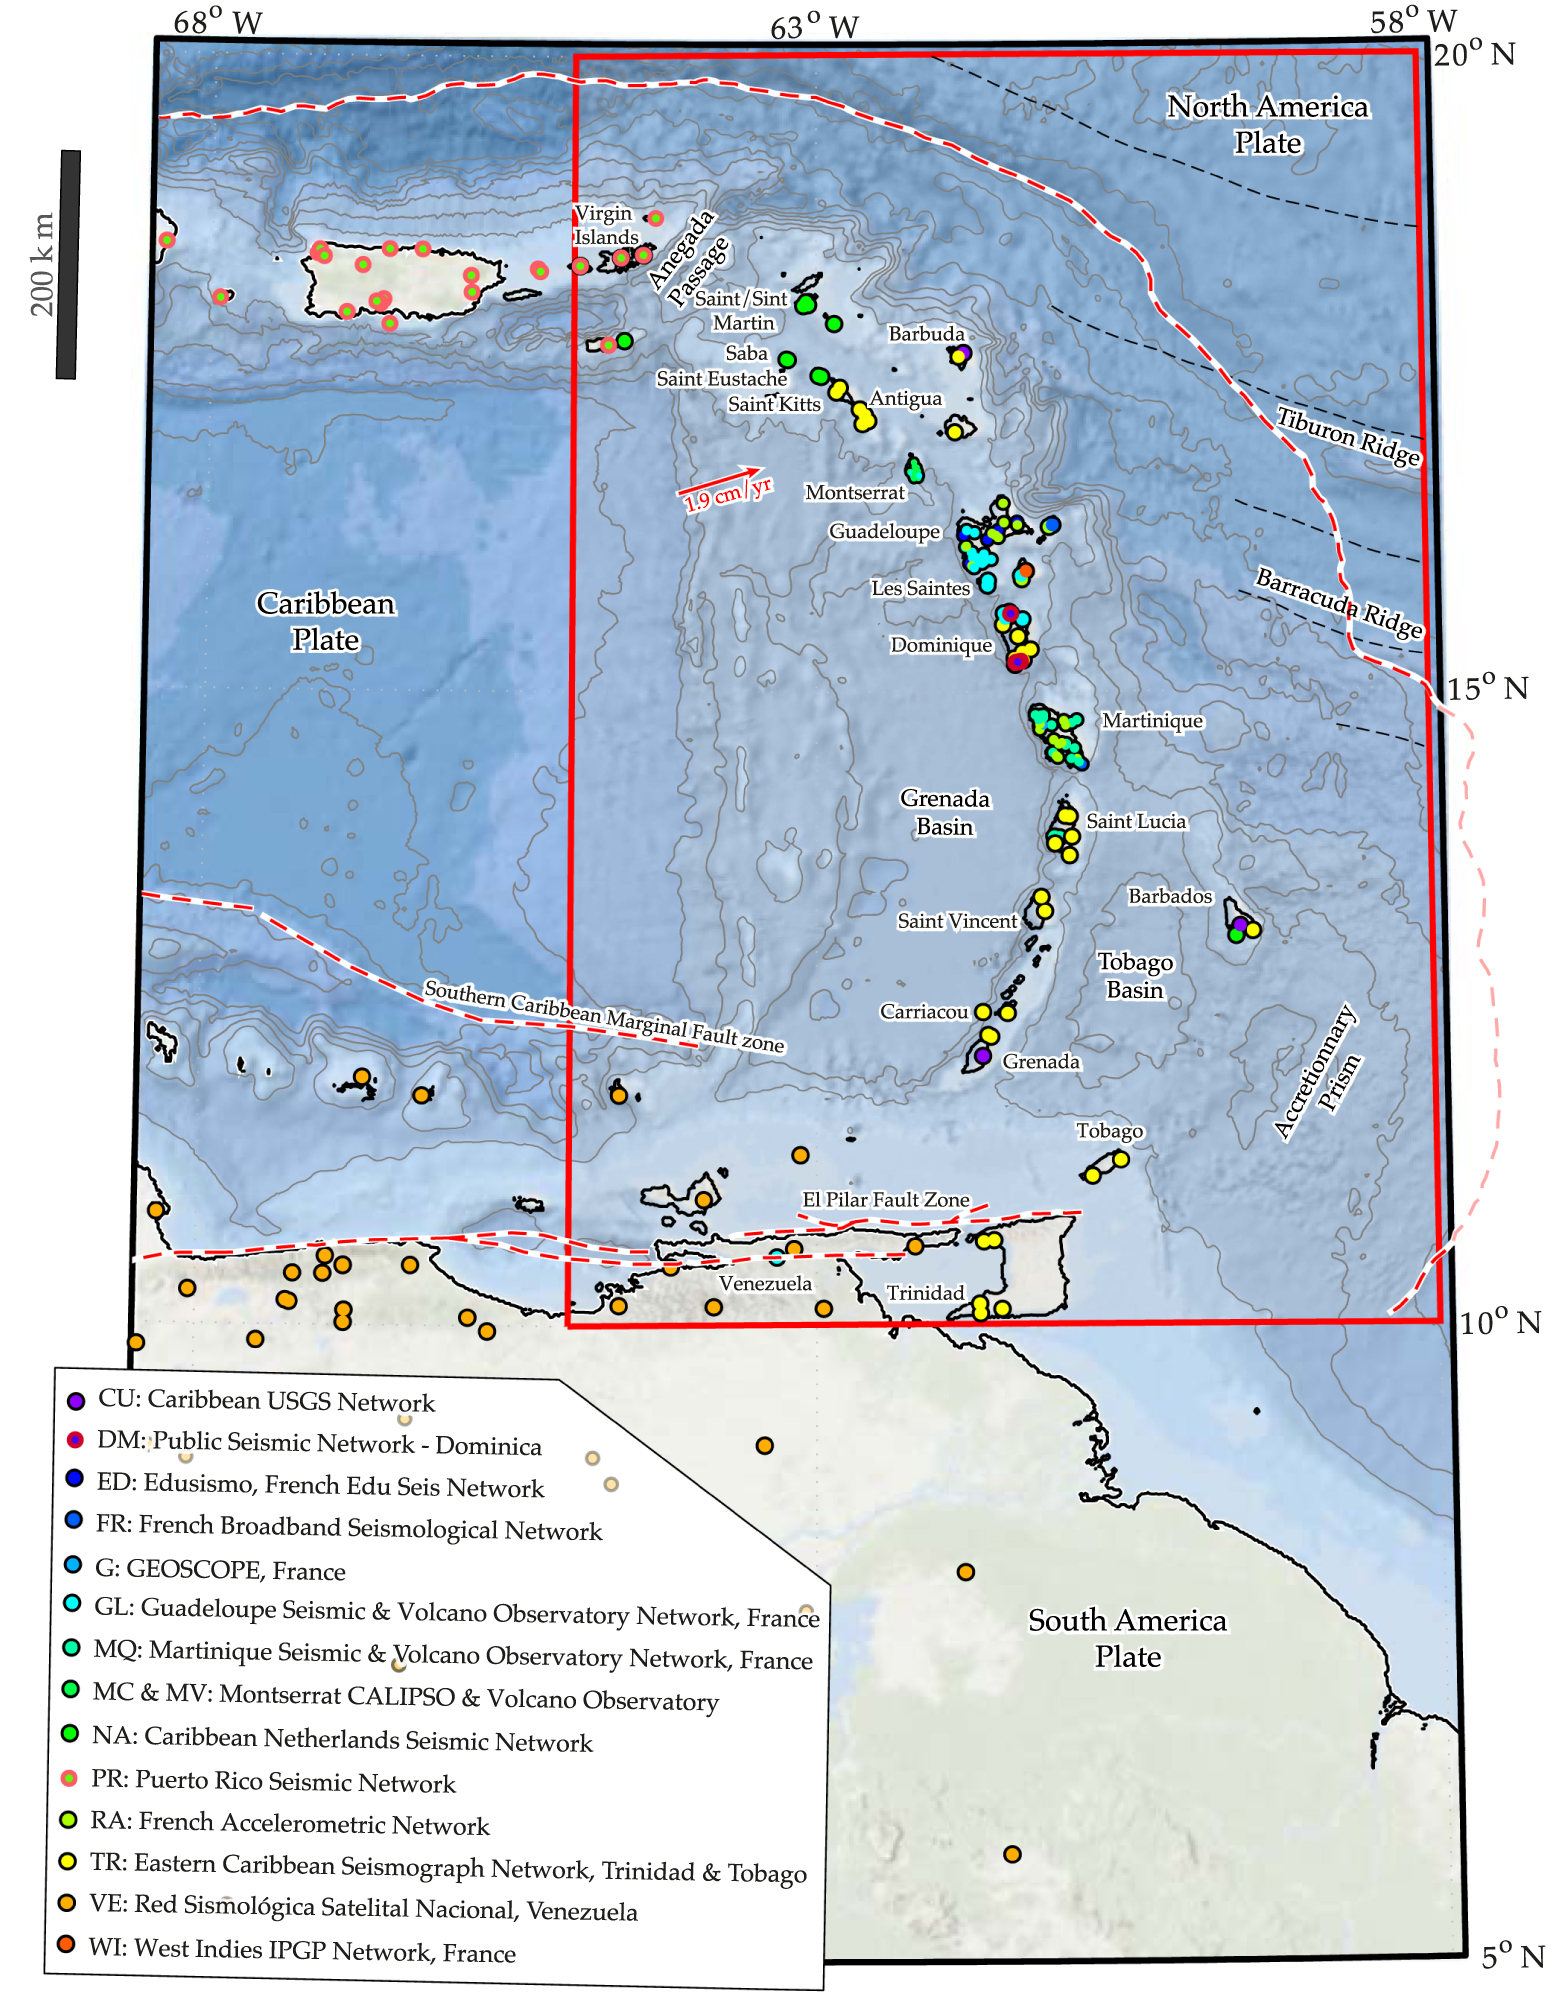
However, the building of a single common regional catalogue in the Lesser Antilles for the years before 2013 is challenging. It requires us to merge seismic phase data from the five regional institutes described previously in a complete and consistent dataset. Complete earthquake catalogues in the Lesser Antilles exist only for magnitude over 4 to 4.5 earthquakes. Such catalogues are produced by the International Seismic Centre [ISC, Bondár and Storchak 2011] and by the U.S. Geological Survey [Benz et al. 2010], and their completeness and precision are limited by the use of global seismic networks and very few regional data. The Antilles Seismological Data Centre (CDSA) project has been implemented to face this problem and to produce a regional seismic catalogue as homogeneous and complete as possible. The first phase of CDSA project took place between 2000 and 2006 [Bengoubou-Valérius et al. 2008] as a collaboration between IPGP, the French geological survey (BRGM, Bureau de Recherche Geologiques et Minières), and the University of the French West Indies (UA, Université des Antilles). The CDSA infrastructure is maintained by the OVSG-IPGP and provides an open access to the resulting catalogue (including seismic station metadata, waveform data, phase arrivals time, and earthquake locations) using standard web services as defined by the International Federation of Digital Seismograph Networks (FDSN). Table 3 summarizes the content of the CDSA catalogue.
A first single common regional catalogue covering a period from 2001 to 2005 has been done by Bengoubou-Valérius et al. [2008] merging the data from the five regional operators for 11,860 events among which 4967 have been relocated by phase merging. However, a regional seismic catalogue over a wider period is necessary to better understand the Antilles subduction. For example, to study the variation of the b-value along the Lesser Antilles subduction, Schlaphorst et al. [2016] used two separate catalogues, one from SRC-UWI between 2008 and 2013 and one from the OVS-IPGP between 1996 and 2012. Even if relative variations between both catalogues compare well, no quantitative estimates of the b-value can be obtained in the area. To determine the completeness magnitude in the central Lesser Antilles, Vorobieva et al. [2013] have chosen to combine the Martinique and Guadeloupe OVS-IPGP catalogues, by simply joining them at latitude 15.5° N. Because of the homogeneity of OVS-IPGP catalogues, these methods provided a correct common catalogue. However, in general, producing a single catalogue with data coming from different seismic operators is not straightforward: Some operators do not keep all phases not being associated with an event origin location (e.g., outside of their velocity model application range), some operators do not keep events outside their region of interest, and most importantly, magnitudes M < 6 can be either duration or local magnitude (using customized parameters) while moment magnitudes from global seismological services are often adopted for events of magnitudes M > 6.
In this study, our goal is to produce a single common regional earthquake location catalogue for the Lesser Antilles subduction zone and for the period before the WI seismic network. Because seismic catalogues are as complete as possible around Puerto Rico to the North and in Venezuela to the South, we limit our catalogue to the Lesser Antilles subduction zone from 10° N to 20° N and from 1972 to 2012 (red area in Figure 1). We use phase data coming from the 14 available regional and local seismic networks, most of which have never been merged, and we include automatic phase data from the RA strong motion network using an high-precision picking algorithm.
2. Regional settings
From the eastern limit of the Greater Antilles, marked by the Anegada Passage, to the South American continent to the South, the Lesser Antilles subduction zone is about 1000 km long (Figure 1). It results from the subduction of the North and South American plates beneath the Caribbean plate [Wadge 1984; Bouysse 1984] since the Early Eocene [Nagle et al. 1976]. The boundary between the American plates is diffuse: The outer-rise boundary has been evidenced in the area between the Tiburon and the Barracuda ridges [Patriat et al. 2011], and below the volcanic arc, it has been identified between 15° N and 13° N by P-wave tomographic images [Van Benthem et al. 2013] and seismic anisotropy analysis [Schlaphorst et al. 2017], and potentially better constrained by receiver function analysis between south of Dominica and Martinique, at latitude 15° N [González et al. 2018]. The N72° trending relative motion between the Caribbean and the American plates, occurring at a lower rate of 19 mm per year [Symithe et al. 2015], produces an almost frontal subduction in the central Lesser Antilles, transitioning from oblique sinistral subduction in the northern arc to oblique dextral subduction in the southern arc. The El Pilar fault zone represents the southern limit of the Lesser Antilles Arc, accommodating the Caribbean South America strike-slip motion [Audemard et al. 2005] along with several fault systems, with relatively little contribution to regional earthquake catalogues.
While the major part of the global seismic moment release occurs at subduction zone interfaces [e.g., Scholz 2002], the instrumental Lesser Antilles seismicity mostly occurs in the Caribbean plate, where normal faulting is dominant [Feuillet et al. 2011; González et al. 2017]. The lack of thrust earthquakes at the interface might be related to the low inter-seismic coupling deduced from geodetic models [Manaker et al. 2008; Symithe et al. 2015; van Rijsingen et al. 2021], indicating that the plate motion only partially accumulates elastic strain susceptible of being released during earthquakes. This can be due to lubrication processes at the interface: a potential lubricant for the slab interface can be the water contended in the sediments of the incoming plates, which is released when entering the subduction, and to the occurrence of hydrated minerals in the slab, such as serpentine, which contributes to lubricating the tectonic contact between the plates [e.g., Rüpke et al. 2004]. Actually, to the south of Tiburon ridge, a large accretionary prism is alimented by the accretion of Orinoco sediments [Westbrook 1975; Pichot et al. 2012]. An important part of these sediments enters the subduction in the southern Lesser Antilles [Le Pichon et al. 1990], while only a small part is transported to the north of Tiburon ridge [Deville et al. 2015].
The lack of large earthquakes at the interface can also be simply related to the short period of instrumental records. During historical times, only two large earthquakes have occurred trenchward with respect to the island arc: on January 11, 1839, in front of Martinique and on February 8, 1843, between Guadeloupe and Antigua [Bernard and Lambert 1988; Feuillet et al. 2011]. The 1843 earthquake has been re-evaluated by Hough [2013], adding felt reports from North America, and its magnitude should exceed M8.5, but the lack of observed tsunami does not favour the scenario of a thrust earthquake. The seismicity rate in the Lesser Antilles has generally been estimated to be relatively low [Bouysse and Westercamp 1990; Stein et al. 1982] as seen from global catalogues. As the lack of large earthquakes could be related to the short observational time frame, the measure of the b-value in the Gutenberg–Richter power law, relating earthquake magnitude and distribution [Gutenberg and Richter 1954] enables to estimate the abundance of smaller earthquakes in comparison to larger events. Several b-value analyses exist for the Lesser Antilles, made with different catalogues, spanning different periods or areas. Bengoubou-Valérius et al. [2008] used the first common catalogue produced for the CDSA between 2001 and 2005 to estimate b in the central Lesser Antilles for shallow (<30 km) seismicity and obtained a b-value of 1.38, while for intraslab seismicity, they obtained 1.13. With the OVS-IPGP catalogue from 1996 to 2012 and the SRC-UWI catalogue from 2008 to 2013, Schlaphorst et al. [2016] inferred large regional variations of the b-value between 0.6 to 2, with increases that correlate to the presence of subducted fracture zones: The fracture zones enhance the supply of water and high water content increases the number of small earthquakes by raising the pore pressure and lowering the effective stress [Wiemer and Benoit 1996], contributing to the lubrication of the subduction zone.
3. Data and method
Our goal is to build a single common regional homogeneous and complete catalogue for the Lesser Antilles, to improve existing earthquake locations, and to estimate the improvements. For that, we follow a conventional four steps approach: arrival time picking, arrival time aggregation, origin locations, and completeness analysis. First, we use the waveforms that have not yet been used in existing catalogues to produce new P- and S-wave arrival time estimates, with an evaluation of picking errors. These waveforms come from the Resif-RAP strong motion network [network code RA - RESIF 1995a]. Second, we aggregate all the arrival times available initially for each event into a single event dataset, making up the CDSA tectonic earthquake catalogue. The arrival times come from the previous Resif-RAP data, the OVS-IPGP catalogue [including networks GL, MQ, ED, FR - RESIF 1995b, G - IPGP and EOST 1982, and WI - IPGP 2008], as well as the ISC database which includes arrivals from the Puerto Rico Seismic Network [PR - UPR 1986, Figure 1], the KNMI [network NA - KNMI 2006], the SRC-UWI [networks TR, DM - PSN 2000, MC and WI], the Funvisis [network VE - FUNVISIS 2000], and from the USGS [network CU - ASL/USGS 2006]. Third, we re-evaluate the origin location for each earthquake using the aggregated arrival times. Since we test two location methods, we also recompute location with initial seismic phase catalogues, and a systematic comparative analysis is established for evaluating quality improvement and for selecting the preferred origin of each earthquake. Finally, in the discussion, we control our observational limits with a re-evaluation of the magnitude of completeness following the same approach than Vorobieva et al. [2013], using our catalogue of preferred origin.
3.1. Initial arrival time data
ISC is in charge of collecting, archiving, and processing seismic station metadata and events parameters, and of preparing and distributing the definitive summary of world seismicity. ISC provides P- and S-waves arrival time data for 17,405 tectonic earthquakes (10 in median) in the time-lapse of our study of magnitudes ranging from 1.4 to 6.4. These phases arrival data come from the Porto Rico Seismic Network (PR and NA), the SRC-UWI (TR, DM, MC and WI), from Funvisis (VE), and from USGS (CU). As IPGP does not currently send data to ISC, most of the IPGP phase data are not included in the ISC dataset. However, the data sent to ISC by SRC-UWI eventually contain some IPGP phase data, as SRC-UWI and IPGP have been sharing their phase bulletins since the early eighties. In addition, the recent WI network is used both by SRC-UWI and IPGP as well as several seismic stations in the GL, MQ, and TR networks. Consequently, there are redundant stations in the arrival time datasets in between the ISC and IPGP catalogues that we shall take advantage of for data aggregation thereafter. As ISC merges data from local and global networks, it leads to arrival times dataset of over 100 arrival times per event for 394 earthquakes.
The OVS-IPGP data come from the two French observatories, for which digital catalogues exist since 1972 in Martinique and since 1981 in Guadeloupe. These observatories operate a mixture of short period and broadband seismometers from the networks GL, MQ, ED, FR, G, and WI (Figure 1). We ignored all the non-tectonic events, that is, landslide and rockslide, quarry blast, and volcano–tectonic events, which are clearly identified in the OVS-IPGP catalogues. We get 32,861 tectonic earthquakes from OVSG (with a median number of eight arrival times together for P and S) and 23,443 from OVSM (with a median number of eight arrival times together for P and S). As a preview of the next section on data aggregation, these IPGP catalogues end up providing arrival time data for 38,653 unique tectonic earthquakes of a magnitude range between 0.1 and 7.5. Additional manual reviews have been required to get rid of the volcanic events, which have been erroneously catalogued as conventional tectonic earthquakes. This work included detection and removal of events with misformatted event type codes corresponding to volcanic events. Finally, we also removed events with the first phase arrival within the groups of stations located directly on top of the volcanic edifices, as well as all events with origins located in the close vicinity of the volcanic edifices. These corrections excluded 110 events.
3.2. Picking automation of strong motion data
The OVS-IPGP maintains the RA accelerometer network (Figure 1) in the Lesser Antilles since 2002, and it must be integrated into our analysis for arrival time data completeness. Stations of this network store on-site the waveforms detected using a standard short-term average over long-term average trigger as SAC files each including two minutes of data. Daily data transfer to the OVS-IPGP is made through a standard switched network telephone system and only triggered events with a corresponding event within the OVS-IPGP daily catalogues are uploaded for long-term storage. However, while these waveform data are all bound to specific events within the OVS-IPGP catalogues, they have never been processed for routine earthquakes location. To determine P- and S-wave arrival times (and their uncertainties), we apply the Component Energy Correlation Method [CECM, Nagano et al. 1989; Zhizhin et al. 2006]. This high-precision method is described in detail in Zhizhin et al. [2006] and Massin et al. [2009] and developed furthermore using multi-band filtering in Massin and Malcolm [2016]. It is based on the idea that seismic noise is a stochastic signal for which the energy dissipation eX(t) (defined by (1) for a channel X over a time interval Tr at the time t) is correlated between the three channels of a given seismometer [Wentzell 1981].
| (1) |
Consequently, the cross-channel correlation functions () between the energy dissipation on the vertical component (Z) and horizontal channels (E and N) will temporarily decrease during P-wave arrival onsets. The two cross-channel correlation coefficients (CZE and CZN) are given by (2), where Tc is the correlation time window. Thus P-wave arrival that can be characterized by a local minimum in CZ is defined as the product of the energy correlation coefficients (CZE and CZN) as in (3).
| (2) |
| (3) |
The length of the signal window used for calculation of the correlation () corresponds to the fundamental period of the P-waves [Nagano et al. 1989]. For adapting to multiple earthquake magnitudes and distances and to reduce the number of false detections, we introduce a multi-scale CECM calculation as the product of three correlation coefficients using three pairs of energy (Tr) and correlation (Tc) time windows following Massin and Malcolm [2016]. Our fundamental Tr and Tc values are 6 s and 0.2 s, the two other pairs are the double- and half-values. CZ is used as a P-wave characteristic function and the single coefficients CZE and CZN are used as S-wave characteristic functions (Figure 2).
Principle and error estimation of automatic picking of the waveforms from network RA using the component energy correlation method (CECM). Left: principle of the CECM illustrated with an example of earthquake waveforms (thin lines), their RMS (dash lines, largest scales have flatter slopes), and the resulting CECM coefficients (CZ, CZE, and CZN). Right: differences between 4083 manual arrival time estimations [Bengoubou-Valérius et al. 2008] (tman) and their corresponding CECM picks as a function of the related CECM coefficients (CZX), colour-coded as function of signal to noise ratio (SNR), and scaled by manual observation weight (normalized from 0, for best, to 4 for worst, using the visual uncertainty-weight conversion scale shown on bottom axis). There is no clear relation between the CECM picking error and the SNR. But there is a relationship between CECM picking error and the CZ coefficient. We provide best-fitting relationships for P and S picks allowing to estimate CECM picking errors, and to convert them to normalized weights on the same scale than manual picks.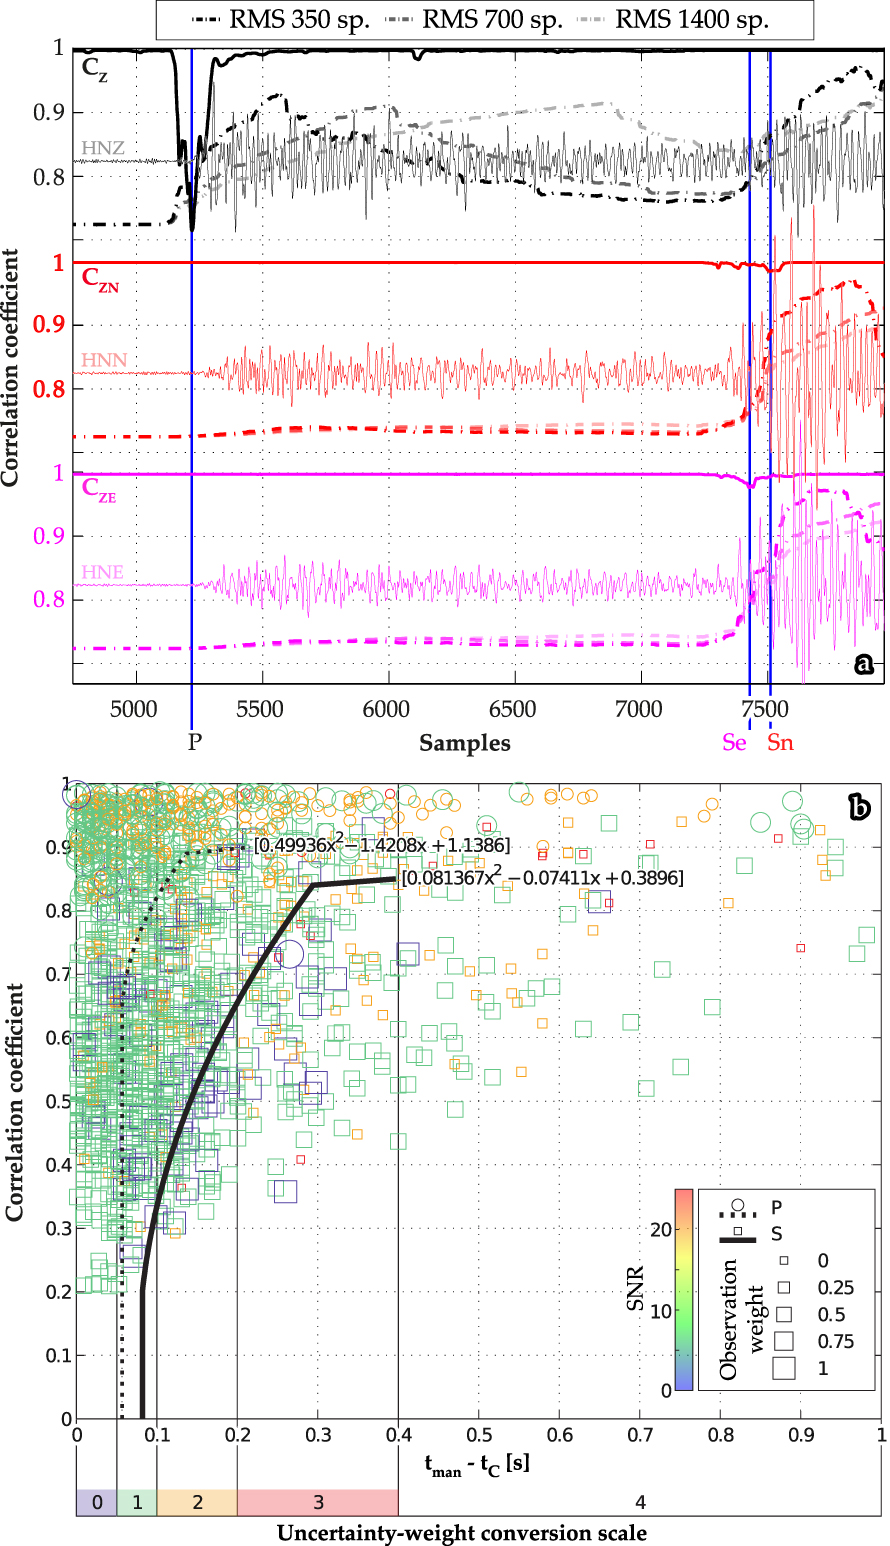
3.3. Error estimation for automatic picking
By definition, 1 − CZ is a proxy of the probability of P-waves arrival at the time t on component Z, and 1 − CZH is a proxy of the probability of S-waves arrival on horizontal component H. We compared CZ and CZH to arrival amplitudes (A) and signal to noise ratio (SNR) on corresponding components to find a reliable proxy for picking error estimation. Such an error estimator can then be used to integrate CECM-automatic picks with manual picks, that are weighted as a function of time uncertainty. Automatic CECM arrival time errors have been estimated on a subsample of 4083 automatic picks from 2000 to 2004 (tC) for which the P- and S-wave arrival times have also been estimated manually in Bengoubou-Valérius et al. [2008] (tman). The differences between our automatic CECM picks and the manual picks from Bengoubou-Valérius et al. [2008] are assumed to be picking error introduced by the CECM. CZH and SNR are represented on Figure 2 as a function of arrival time errors (tman − tC). The correlation coefficients show a better dependence with automatic picking errors than the SNR parameters. We use the best-fitting relationships between the correlation coefficients and the picking error on the manual dataset, established separately for P- and S-waves, as estimators of picking errors in our entire CECM dataset. The calculated errors of the CECM picks have an average value of 0.177 ± 1.508 s for P-wave arrival estimations and 0.138 ± 1.313 s for S-waves. Errors are converted to normalized pick weights, assuming that the observational pick weight established with manual picks in Bengoubou-Valérius et al. [2008], at OVS-IPGP and at ISC follow the same criterion defined in Lee and Lahr [1972] (Figure 2 lower right). The weight of our S-waves picks has been adjusted to be systematically lower than the weight of their associated P-wave picks. Using our new resulting phase dataset, we add an average of 3 P-wave arrivals and 2 S-wave arrivals to 3846 earthquakes (with 23 and 7 P- and S-wave arrival in total).
3.4. Arrival time data aggregation
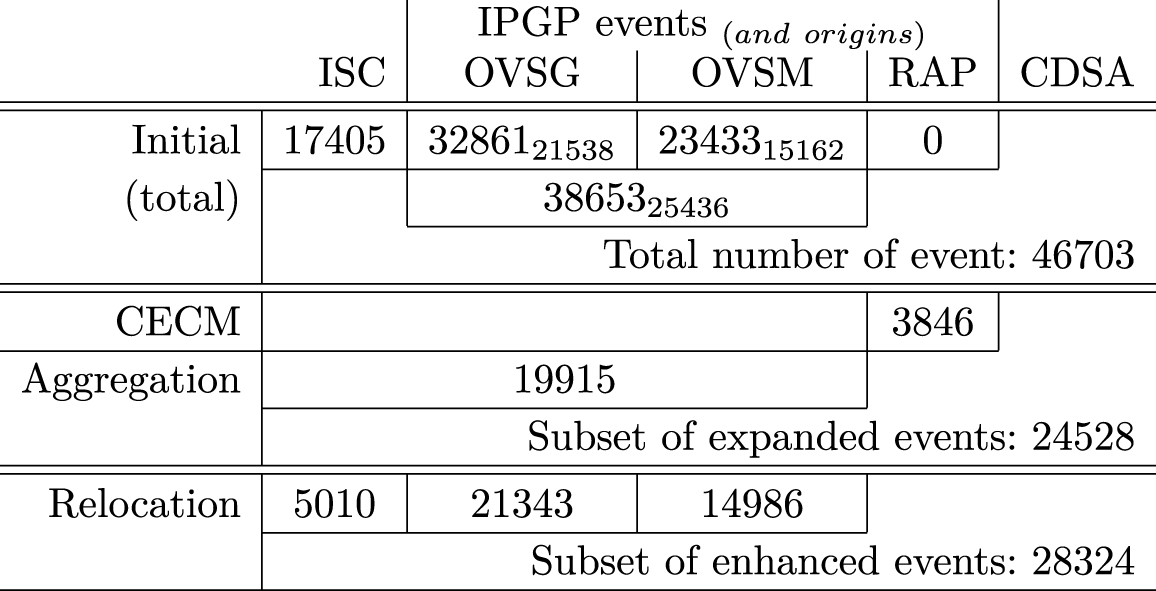
The initial location and phase catalogues from IPGP and ISC span 40 years between 1972 and 2012. We aggregate all the data available for all tectonic earthquakes recorded with at least four P-phases arrival times, excluding volcanic, gravitary, antropic or teleseismic events. The data of each earthquake are aggregated in two steps. In a first step, ISC and IPGP datasets are merged for a given earthquake when the two datasets include a common arrival time with a difference inferior to ±2 s. When hypocentre parameters are available, ISC and IPGP datasets are also merged if their origins (time and location) are close enough (±10 km and ±10 s). Due to variable arrival time precision in ISC bulletin (since ISC merges arrival time from various institutes each with their own picking rules), IPGP data are considered in priority. Using this aggregation scheme, the phases datasets from 19,915 events now include arrival time from both IPGP and ISC catalogues. In final, our aggregated CDSA catalogue includes 46,703 earthquakes between 1972 and 2012, and we improved the phases bulletin of 24,528 earthquakes, 19,915 of which by pick aggregation and 3846 by the CECM method.
4. Earthquake locations
With the inclusion of the automatic picks from the RA network and the merging of OVS-IPGP and ISC phases in the CDSA catalogue, earthquake location needs to be recomputed. We also evaluate two different location methods, so we recompute location from aggregated and initial seismic phase datasets for a complete comparison of the results. Locating earthquakes in the Lesser Antilles is particularly difficult. 95% of the seismicity occurs offshore [Beauducel et al. 2011], far from the volcanic arc, several tens of kilometres east of the closest seismic station, and that translates into high depth uncertainties. It is why we evaluated the contribution from another location method in addition to the standard method used in OVS-IPGP. For both methods, we use the same Dorel et al. [1979] velocity model and VP∕Vs ratio for earthquake location in the lesser Antilles, outside of Les Saintes area where we use the model from Bazin et al. [2010] (Table 2). We first use Hypo71 [Lee and Lahr 1972] separately with all arrival time catalogues (OVSG, OVSM, ISC, and CDSA). Hypo71 is used routinely in the OVS-IPGP observatories. It internally selects the origin hypocentre as the solution that minimizes the root mean square (RMS) of the residual times at origin. We then attempt to improve the origin locations, in particular for events located at more than 100 km from the network, by using the NonLinLoc probabilistic location program [Lomax et al. 2001] separately with all arrival time catalogues (OVSG, OVSM, ISC, and CDSA). NonLinLoc internally selects the origin hypocentre as the barycentre of the location probability density function (PDF). Finally, we compare the results from the two methods to select the best origin of each earthquake.
Earthquake catalogues in the Lesser Antilles area (10–20° N, 65–58° W) between 1972 and 2012 and earthquake catalogues provided by our study, exposed via the CDSA open-access web services (www.seismes-antilles.fr). Initial: numbers of earthquakes in initially available catalogues provided by ISC and IPGP. Note that not all earthquakes in initial catalogues have an origin and phase data, the number of origins are provided as index. CECM: number of earthquakes with automatic picks using data from the RAP-GIS provided by IPGP. Aggregation: numbers of earthquakes with expanded arrival times dataset using aggregation. Relocation: Numbers of earthquakes with improved location results. Earthquakes are the only event type considered, volcanic and other event types are not included
 |
P- and S-wave velocity models used for earthquake location in the Lesser Antilles [Dorel et al. 1979; Bazin et al. 2010]
| Lesser Antilles [Dorel et al. 1979] | Les Saintes [Bazin et al. 2010] | ||||
|---|---|---|---|---|---|
| Depth | VP | VS | Depth | VP | VS |
| 0.0 | 3.5 | 1.98 | 0.0 | 1.225 | 0.625 |
| 0.6 | 3.63 | 2.04 | |||
| 1.0 | 3.81 | 2.14 | |||
| 1.0 | 3.81 | 2.14 | |||
| 2.0 | 4.29 | 2.41 | |||
| 3.0 | 6.0 | 3.40 | 3.0 | 5.34 | 3.00 |
| 5.0 | 5.68 | 3.19 | |||
| 11.0 | 5.90 | 3.32 | |||
| 13.0 | 6.09 | 3.42 | |||
| 15.0 | 7.0 | 3.97 | 15.0 | 7.09 | 3.98 |
| 30.0 | 8.0 | 4.54 | 30.0 | 8.09 | 4.54 |
Description of the CSDA datasets exposed via the CDSA open-access web services (www.seismes-antilles.fr)
| Catalogue type | Data included | Formats |
|---|---|---|
| Events | - Origins, | - Text, |
| - magnitudes, | - QuakeML, | |
| - arrivals, | - SeisComP XML. | |
| - durations. | ||
| Inventory | - Networks, | - Text, |
| - stations, | - Station XML, | |
| - channels, | - SeisComP XML. | |
| - responses. | ||
| Event | - Traces, | MiniSeed. |
| Stream | - Responses. | |
4.1. Hypo71
The OVS-IPGP have implemented a modified version [Nercessian et al. 1996] of Hypo71, which takes into account station elevations using a ray correction. This algorithm is used to lead a systematic exploration of several trial depths as starting points for the earthquake location. For each trial depth, a decision is made on the hypocentre with the best RMS and constrain, and a final run is made with the best resulting depth as a trial depth. A disadvantage of Hypo71 is the unrealistic estimation of uncertainties because it is based on the derivative of the misfit function in the vicinity of the solution of minimum misfit selected for hypocentre location [Lee and Lahr 1972]. To check the consistency of our re-localization, the initial OVSG, OVSM, and ISC arrival time dataset are relocated with Hypo71. Figure 4 shows the quality of our Hypo71 origin locations compared with the OVSG, OVSM, and ISC initial origin catalogues. We obtain a similar distribution of RMS and number of phase compared to initial origins, which validates our hypo71 location procedure that we then apply to the CDSA phase catalogue.
We then relocate the complete CDSA earthquake catalogue with Hypo71. We analyse the self-consistency of the origin location inversion method by studying the distribution of the arrival time residuals in terms of hypocentral distance and weights (Figure 3 left). The a posteriori weights (weights being inverted by the location program while iteratively re-weighting data based on the residuals of trial locations) indicate the contribution of the related data into the location results, and we expect lower a posteriori weights for data at higher distances or residuals. Our results show that the distribution of the arrival time residuals is consistent with increasing travel time residuals as a function of distance and systematic decrease of a posteriori weights for data at distances over 200 km which is imposed arbitrarily within the configuration. However, there is no consistency between residual values and their a posteriori weights, even for residuals over 0.5 s at distance over 100 km. This bias is problematic for hypocentre inversion, it implies increased location uncertainties when using data further than 100 km.
Residuals of Hypo71 (left) and NonLinLoc (right) locations according to the distance to the closest station. The residuals between observed (obs) and calculated (calc) travel times (TT) are depicted for P-waves (top) and for S-waves (bottom). Arrival times are represented with their a priori weight (w, manually provided in input of the location method) and a posteriori weights (Wpost, indicating data re-weighting inverted by location method). Hypo71 poorly identifies the data at the closest distance as the most important, there is no clear pattern in the related a posteriori weights. NonLinLoc results compile the best residual distribution in the domains of a posteriori weight and hypocentral distance. Our NonLinLoc residuals have an average of 0.004 ± 0.689 s on P-waves and −0.112 ± 1.095 s on S-waves.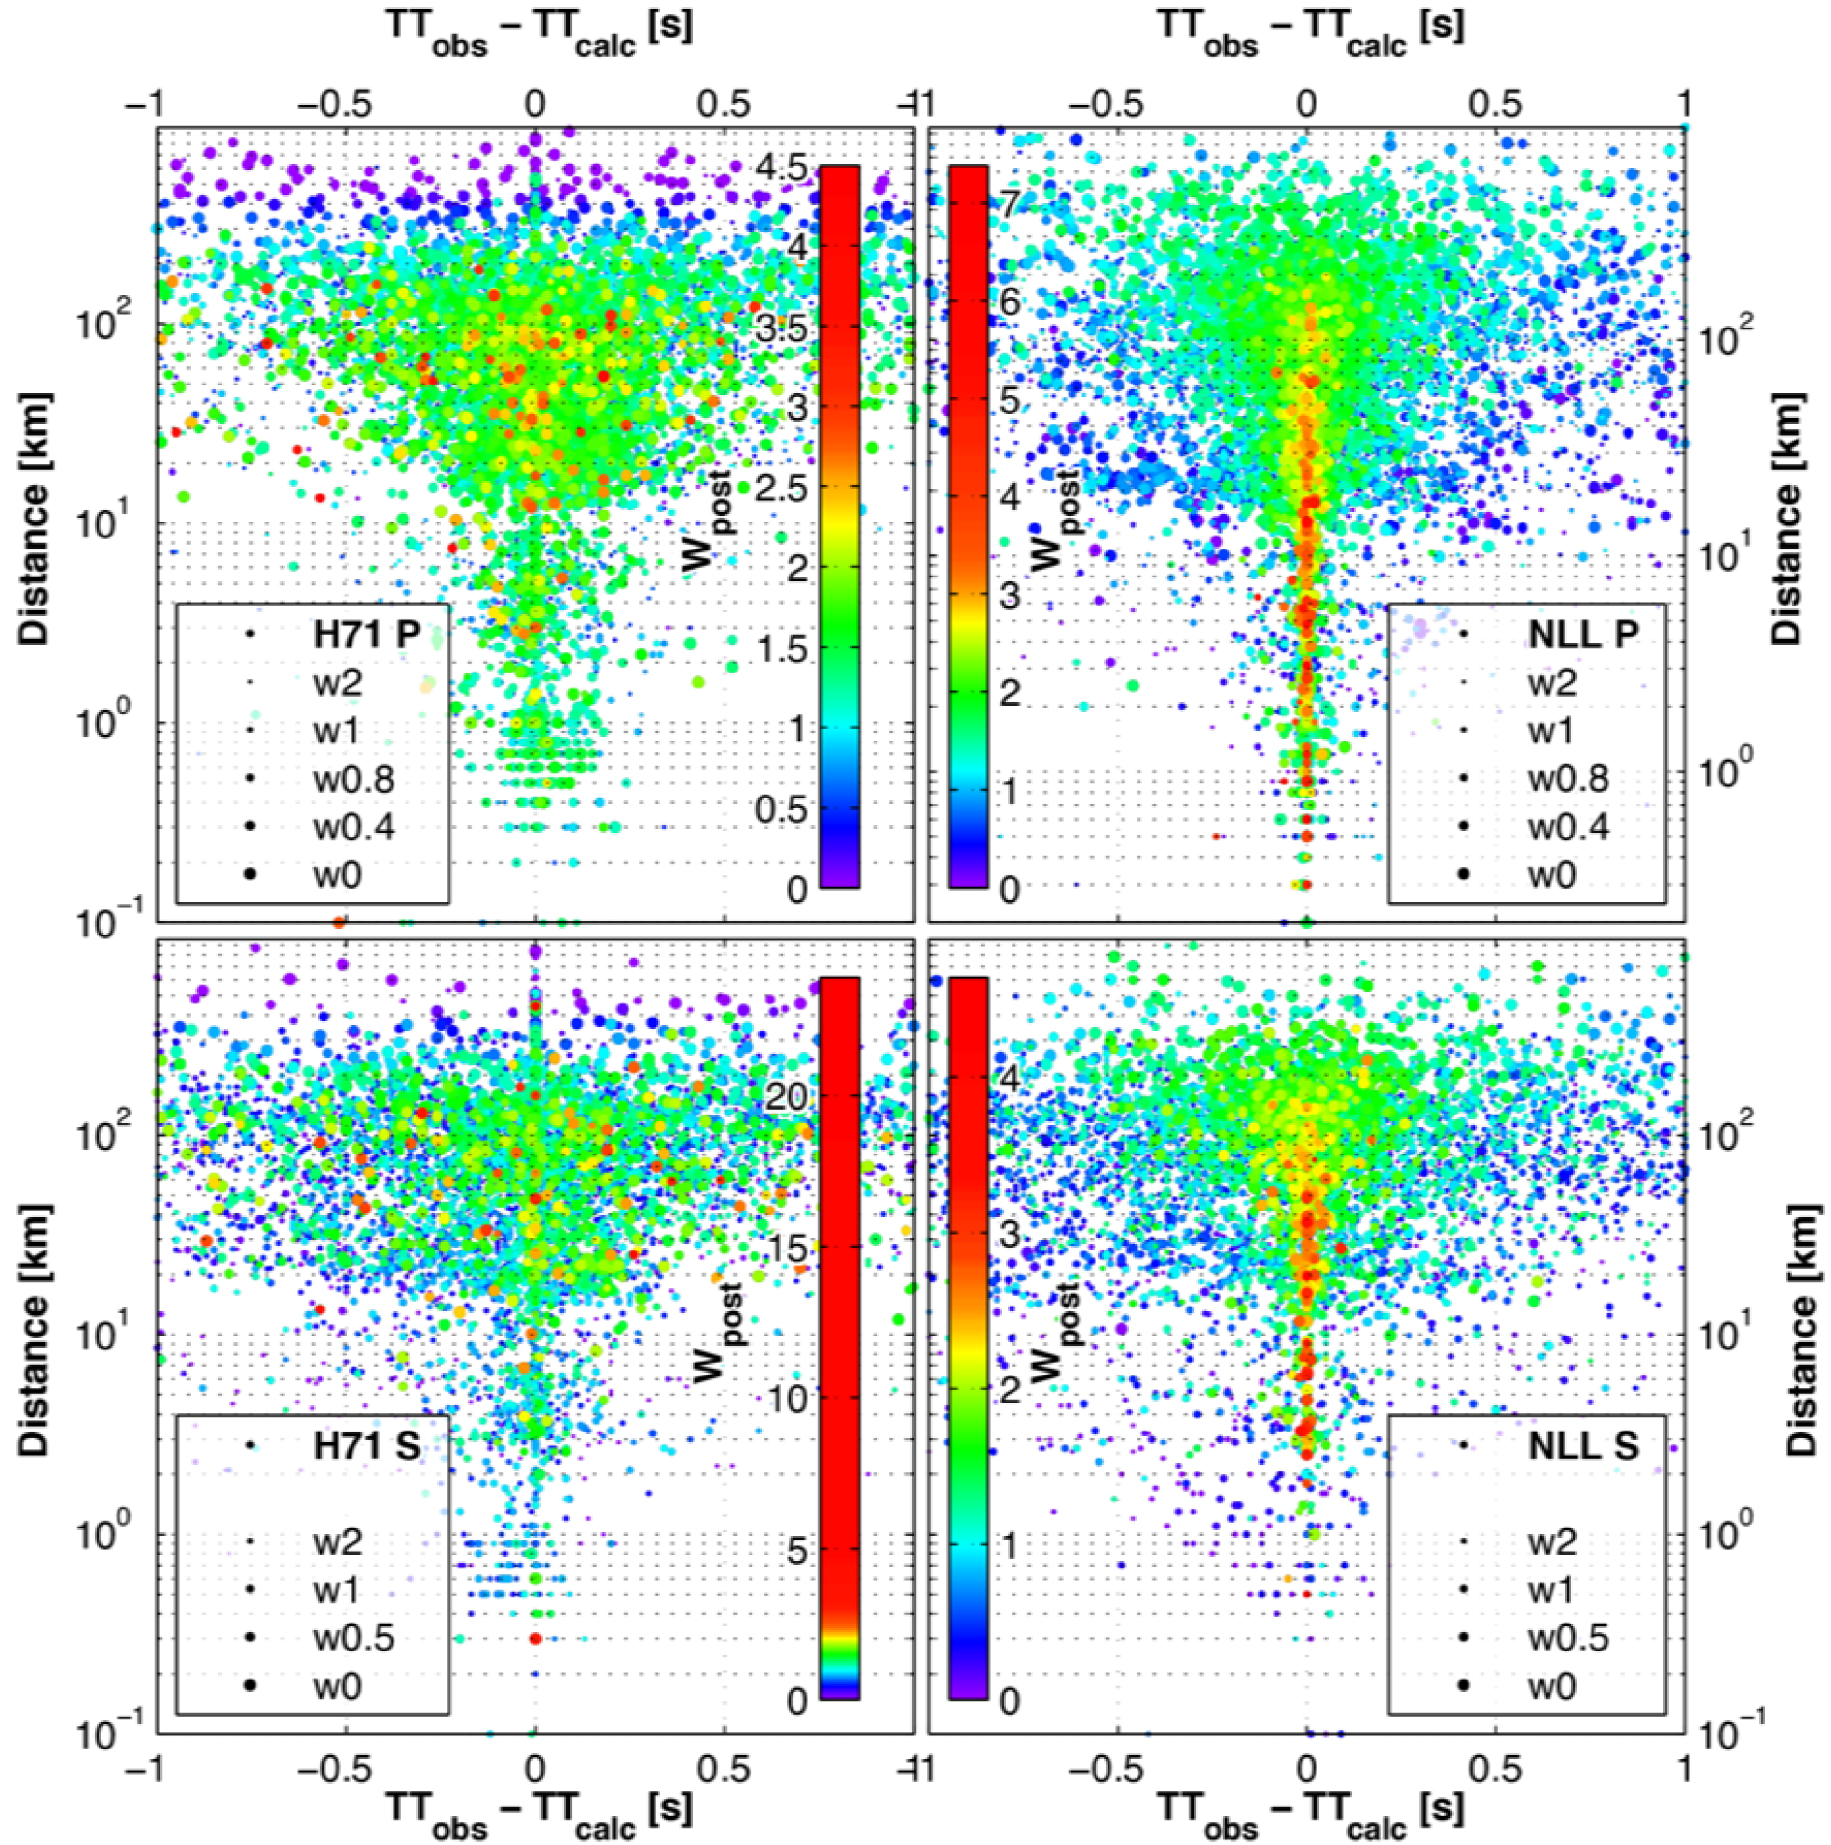
Error estimation on initial locations (a–c), locations made in this study (h–k) and overall preferred origins (x). Each histogram represent the location RMS as a function of the number of P- and S-wave arrivals. Note that not all events have an origin and phase data in initial catalogue. Each histogram cell is coloured as a function of the number of included origins. There is an histogram for each location method and each dataset. The bottom two lines (i–s) give the error estimation on best origins considering individual datasets using the lower RMS/N origins (i–o) and using the strategy of Bengoubou-Valérius et al. [2008] (p–s). The two columns on the right side give the error estimation on best origins considering the individual location methods hypo71 (t, u) and NonLinLoc (v, w), using the lower RMS/N origins (t, v) and using the strategy of Bengoubou-Valérius et al. [2008] (u, w). The best origins overall location method and datasets are selected as preferred origins within the CDSA catalogue (x). Pink: 68% reduced ensemble (i.e., ensemble of densest cells that include 68% of the origins). Red: slope of average RMS/N estimated in the 68% reduced ensemble (also given in annotation). The annotation provided the average RMS/N, the median and standard deviation for RMS and phase number, number of origins within (h) and outside (f) the histogram.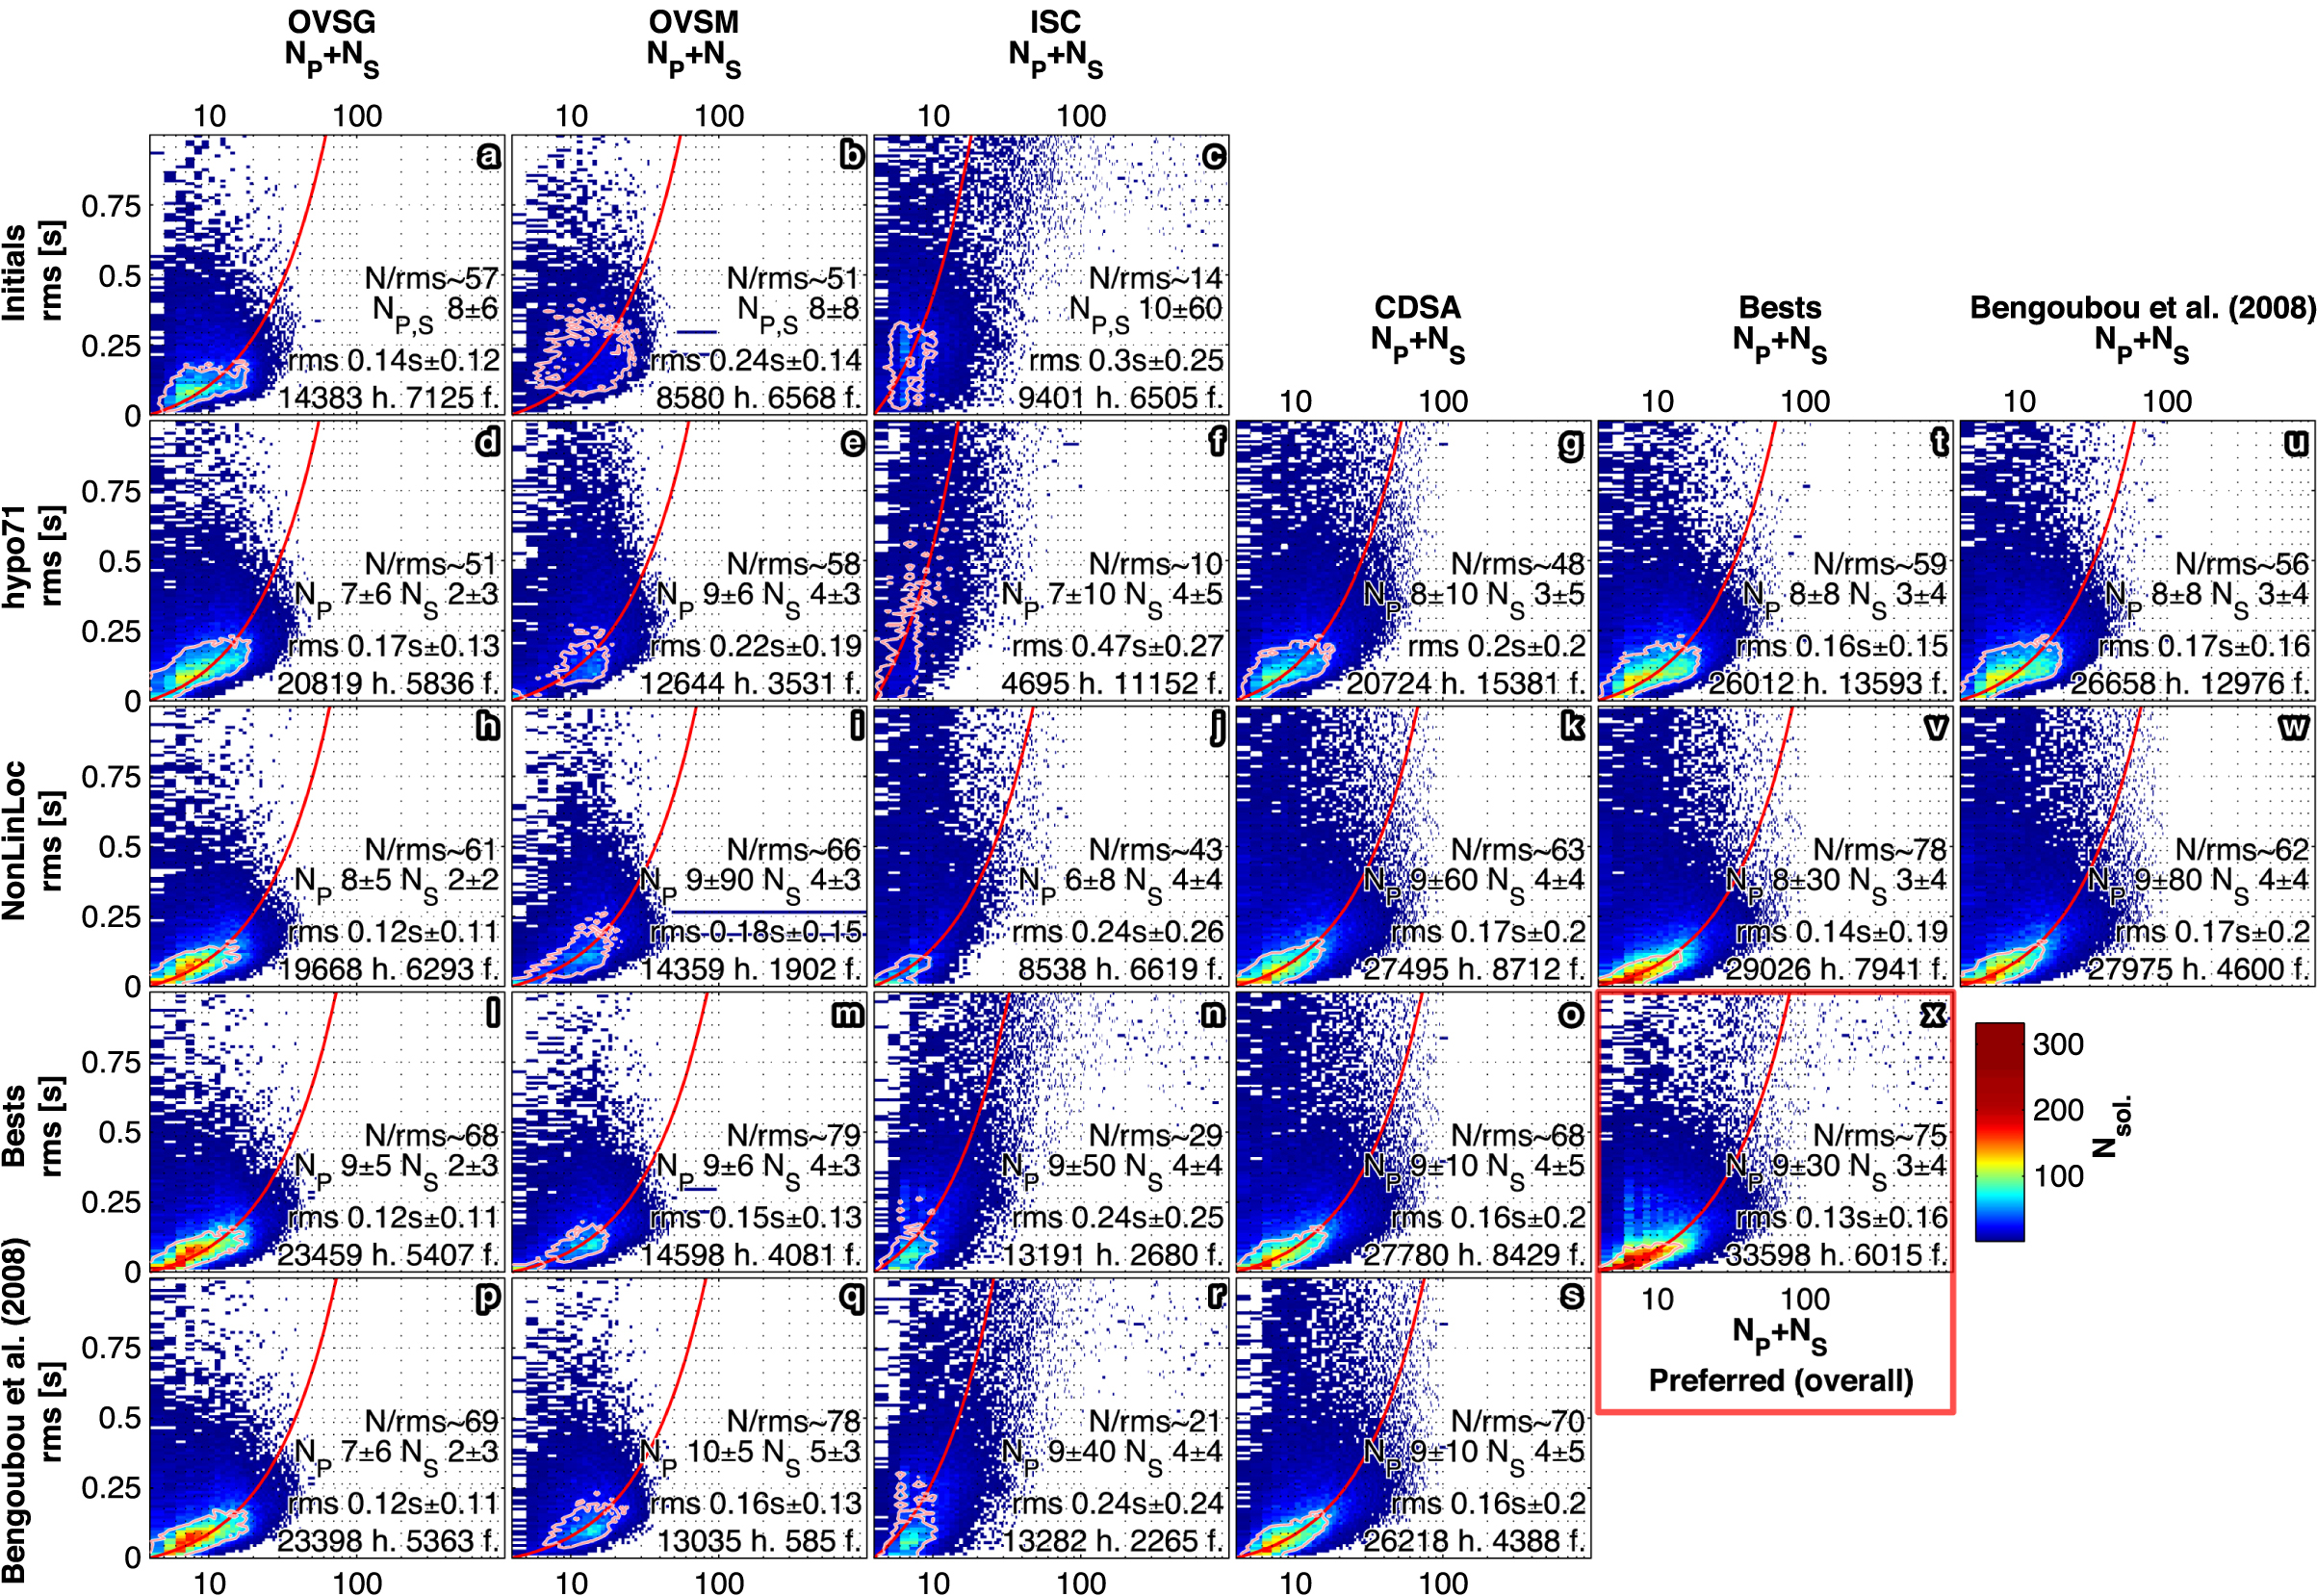
4.2. NonLinLoc
We use the NonLinLoc location program to improve the origin location quality for earthquakes with challenging data distribution (e.g., located far offshore). Unlike Hypo71, NonLinLoc produces an estimate of the hypocentre PDF using the probabilistic origin location methods of Tarantola and Valette [1982a]. We use the equal differential time (EDT) formulation of Zhou [1994] for a robust estimation of the PDF rejecting data outliers. Each three-dimensional point of the PDF has a probability given by the EDT formulation, as a function of the observed arrival times and the calculated travel times. The EDT formulation attributes the highest weight to the pairs of data with equal observed and calculated differences in travel time. The PDF from EDT has its hypocentre solution of highest likelihood where satisfying the more pairs of observations, thus the hypocentre resolution is not affected by outlier data, and it is independent of the resolution of the origin time. Using this approach, the residuals of the NonLinLoc origins presented in Figure 3 (right) are generally improved compared to Hypo71 (left). Figure 3 shows that NonLinLoc optimizes a posteriori weights with a distribution centred on the lesser residuals and at close distances to the hypocentre location. This is an important advantage compared to Hypo71, which is only able to downweight the furthermost data over a user-defined distance threshold, inconsistently with residuals. As a result, the earthquake origin locations including data from a broad distance range are generally better resolved using NonLinLoc than Hypo71.
4.3. Preferred origins selection
We produce a catalogue of Hypo71 origins and a catalogue of NonLinLoc origins for each arrival time dataset (i.e., ISC, OVSG, OVSM, and CDSA). Location results using ISC, OSVG, and OVSM arrival time datasets separately demonstrate and quantify the improvement using the CDSA arrival time dataset, while Hypo71 location results demonstrate and quantify the improvement using NonLinLoc. To establish a catalogue of preferred origins including only the most accurate origin for each earthquake, there are two possible strategies depending on the usage of the final catalogue. For analysis relying on consistent location residuals (e.g., velocity analysis), it is preferable to select the preferred origins of each earthquake over all available datasets of a given location program. For other applications relying on the location completeness and precision (e.g., fault mapping or statistical seismology), it is preferable to select the preferred origin of each earthquake over all available datasets and all location programs. However, comparing the quality of the location obtained with Hypo71 to the one from NonLinLoc remains a problem for selecting the preferred origin of each earthquake. We need a metric for location quality comparison which does not rely on location uncertainties because they do not compare between locations programs. In NonLinLoc, the uncertainties are estimated with the three-dimensional geometry of the PDF which is obtained from a systematic exploration of the cost function in the region of interest. In Hypo71, uncertainties are derived from a minimal-cost excursion in the solution space.
We evaluate origins quality estimators based on the multi-parameter method of Bengoubou-Valérius et al. [2008] and on the simplified method employed by OVS-IPGP for routine earthquake location. The method from Bengoubou-Valérius et al. [2008] selects the best origin as the best compromise in RMS, the epicentral distance to the closest station (Dmin), and average uncertainties with arbitrary thresholds for each parameter. The location routine used by IPGP-OVS iterates over several Hypo71 runs, each starting from a different trial depth and outputs the best origin as the origin with the lowest RMS/NP+S ratio (NP+S being the number of body wave phase arrivals). Figure 4 represents RMS as a function of NP+S for each catalogue. We select the origins with lowest RMS/NP+S ratio for each data source (Figure 4, bottom) and for each location method (Figure 4, second last column and line). These latter catalogues can be compared with the selection of the best origin using the method of Bengoubou-Valérius et al. [2008] (Figure 4, last column and line). The method from Bengoubou-Valérius et al. [2008] selects origins with low RMS/NP+S ratio for every catalogue. In other words, the origins selected using the lowest RMS/NP+S ratios can be preferred based on the conditions of Bengoubou-Valérius et al. [2008]. As it is the most simple method, we proposed a preferred origin catalogue by selecting the origins with the lowest RMS/NP+S ratios over any location method and phase arrival catalogue (Figure 4 subplot x).
The catalogue produced by the CDSA by aggregation and relocation includes 28,324 tectonic earthquakes with improvements in RMS and NP+S compared to their initial origins. This sub-catalogue of improved origins include 21,343 origins with data from OVSG, 14,986 with data from OVSM, and 5010 with data from ISC. This means that the rest of the 46,703 earthquakes in the CDSA catalogue could not be improved by adding data nor by using another location method, and their preferred origins are kept as provided initially. The preferred magnitude for each preferred origin has been selected from the initial catalogues, either from the closest OVS-IPGP solution if available, or from the ISC. All the origins of each earthquake catalogue can be specifically requested on the CDSA website through the FDSN web services, and the preferred origin catalogue is provided by default. Figure 5 compares the catalogues subsets for the 28,324 preferred origins enhanced by our study and Figure 6 shows the same enhanced preferred origins catalogue in cross-sections in the dip direction of the slab as explained in the next section.
Comparison of the 28,324 enhanced CDSA preferred origins (a) to the corresponding NonLinLoc-only (b) and hypo71-only (c) location results and the corresponding initial origins (d–f). The rest of the 46,703 earthquakes in the CDSA catalogue could not be improved by adding data nor by using another location method, and their preferred origins are kept as provided initially (not represented).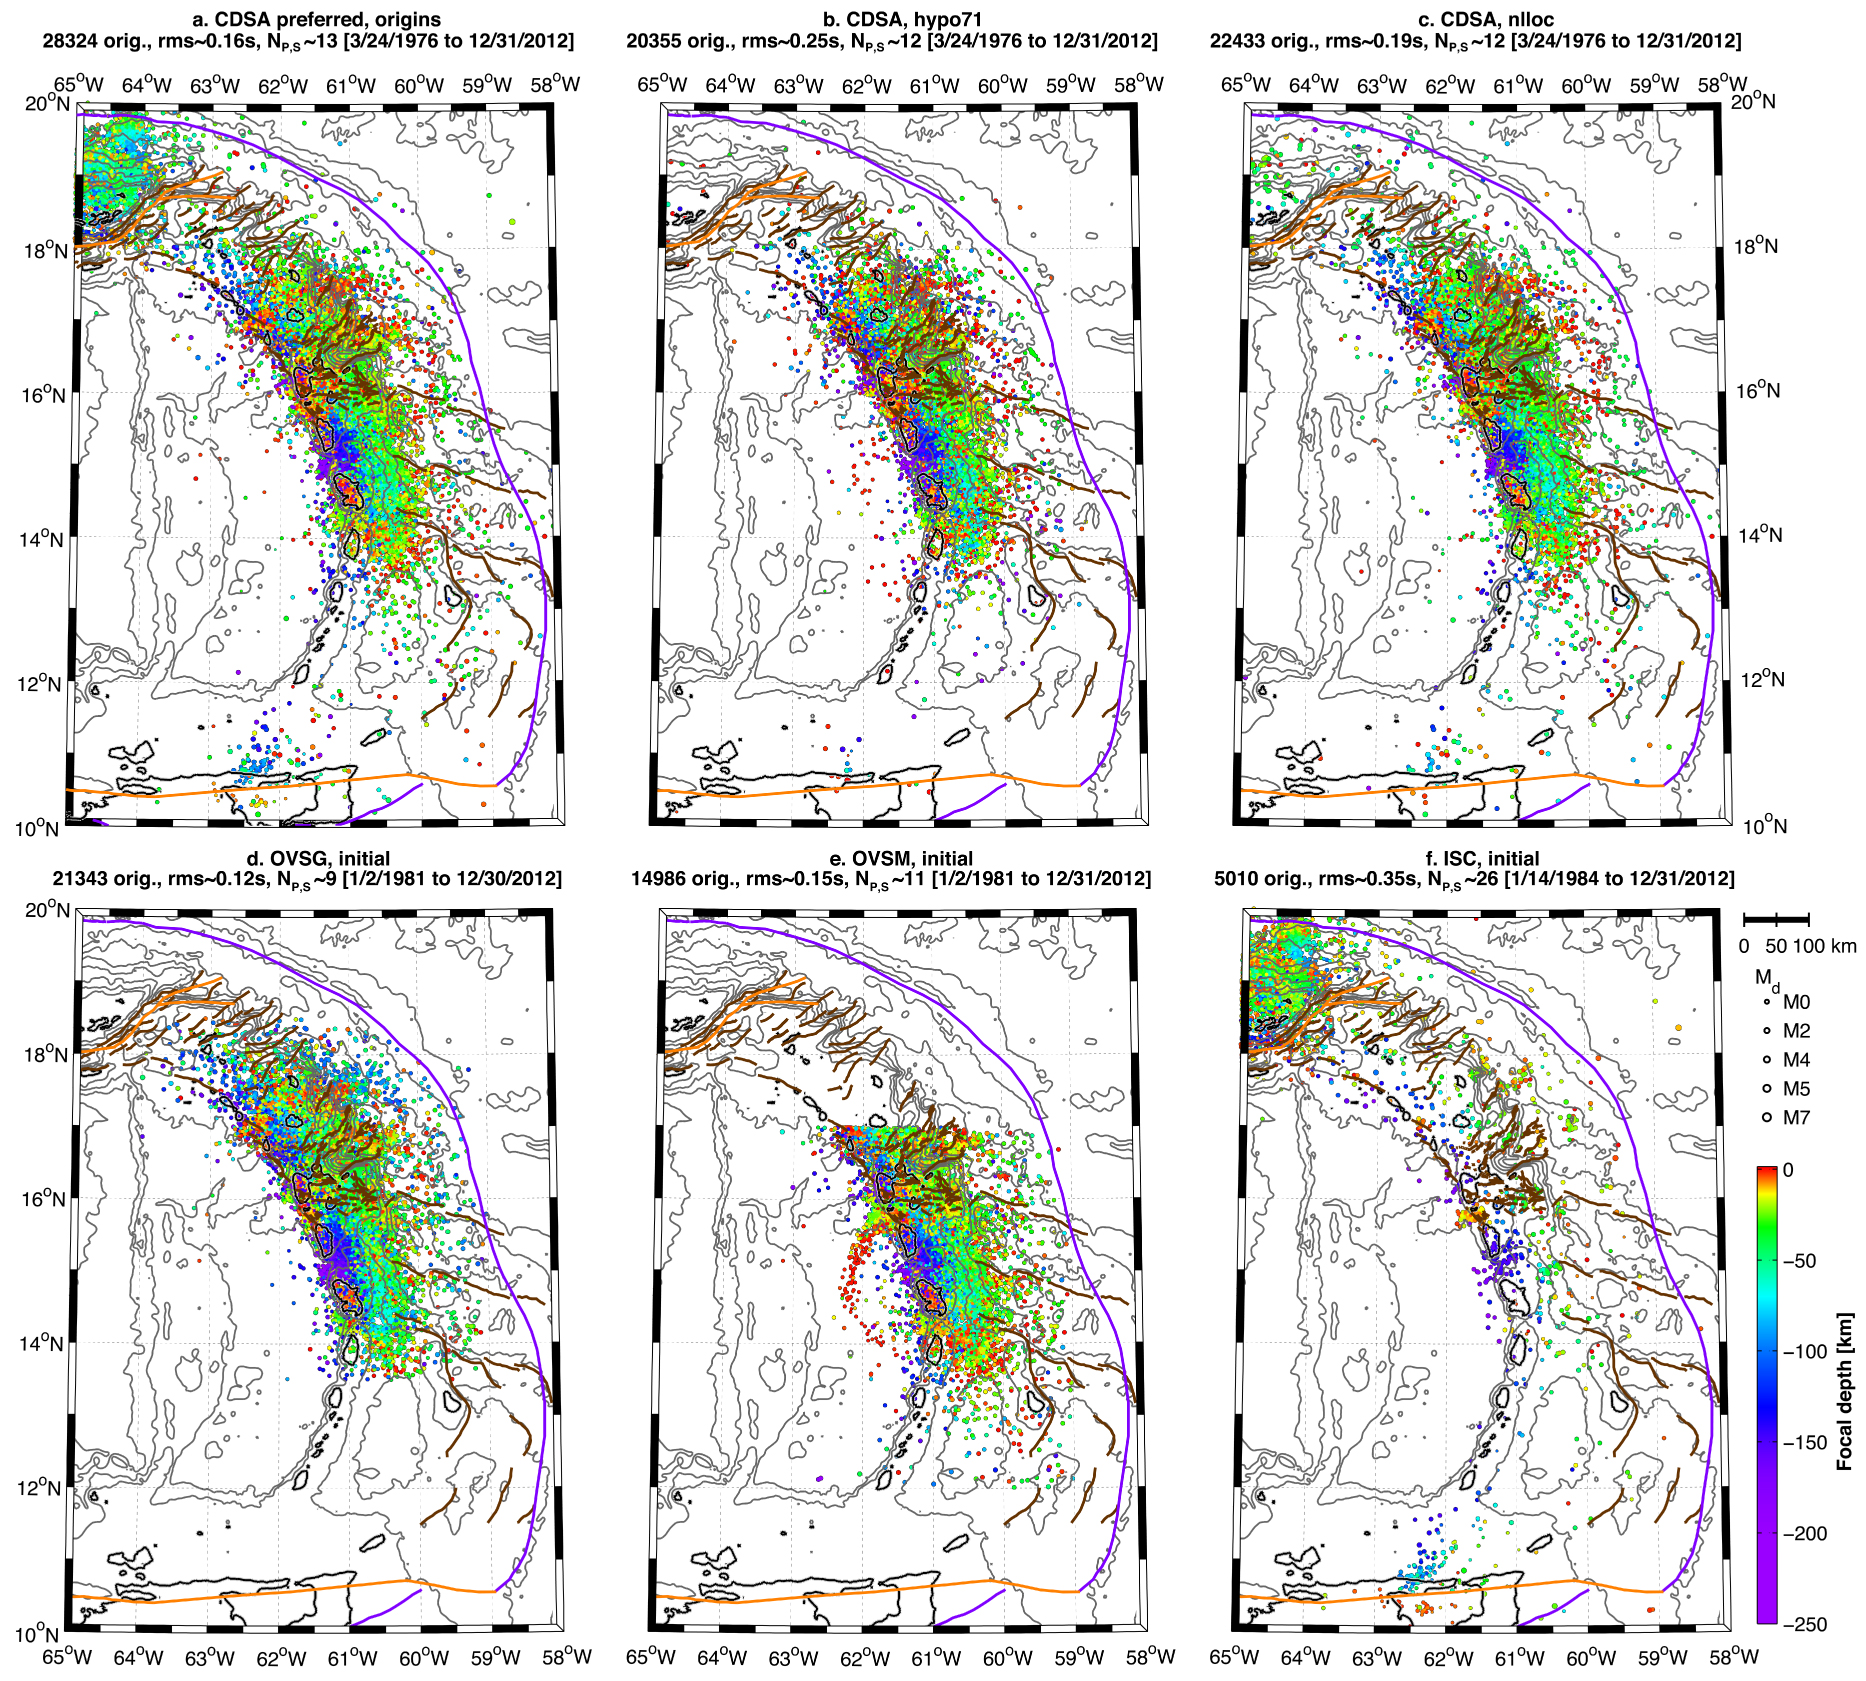
Cross-sections of the 28,324 enhanced CDSA preferred origins colour-coded as a function of time, labelled with section direction and centre latitude. The selection area of each cross-section is indicated on the upper left map (black box, view angle, and distance origin in pink). Blue dashed curves represent the slab model generated in Bie et al. [2019], whereas the red dashed curves are from Slab2.0 [Hayes et al. 2018].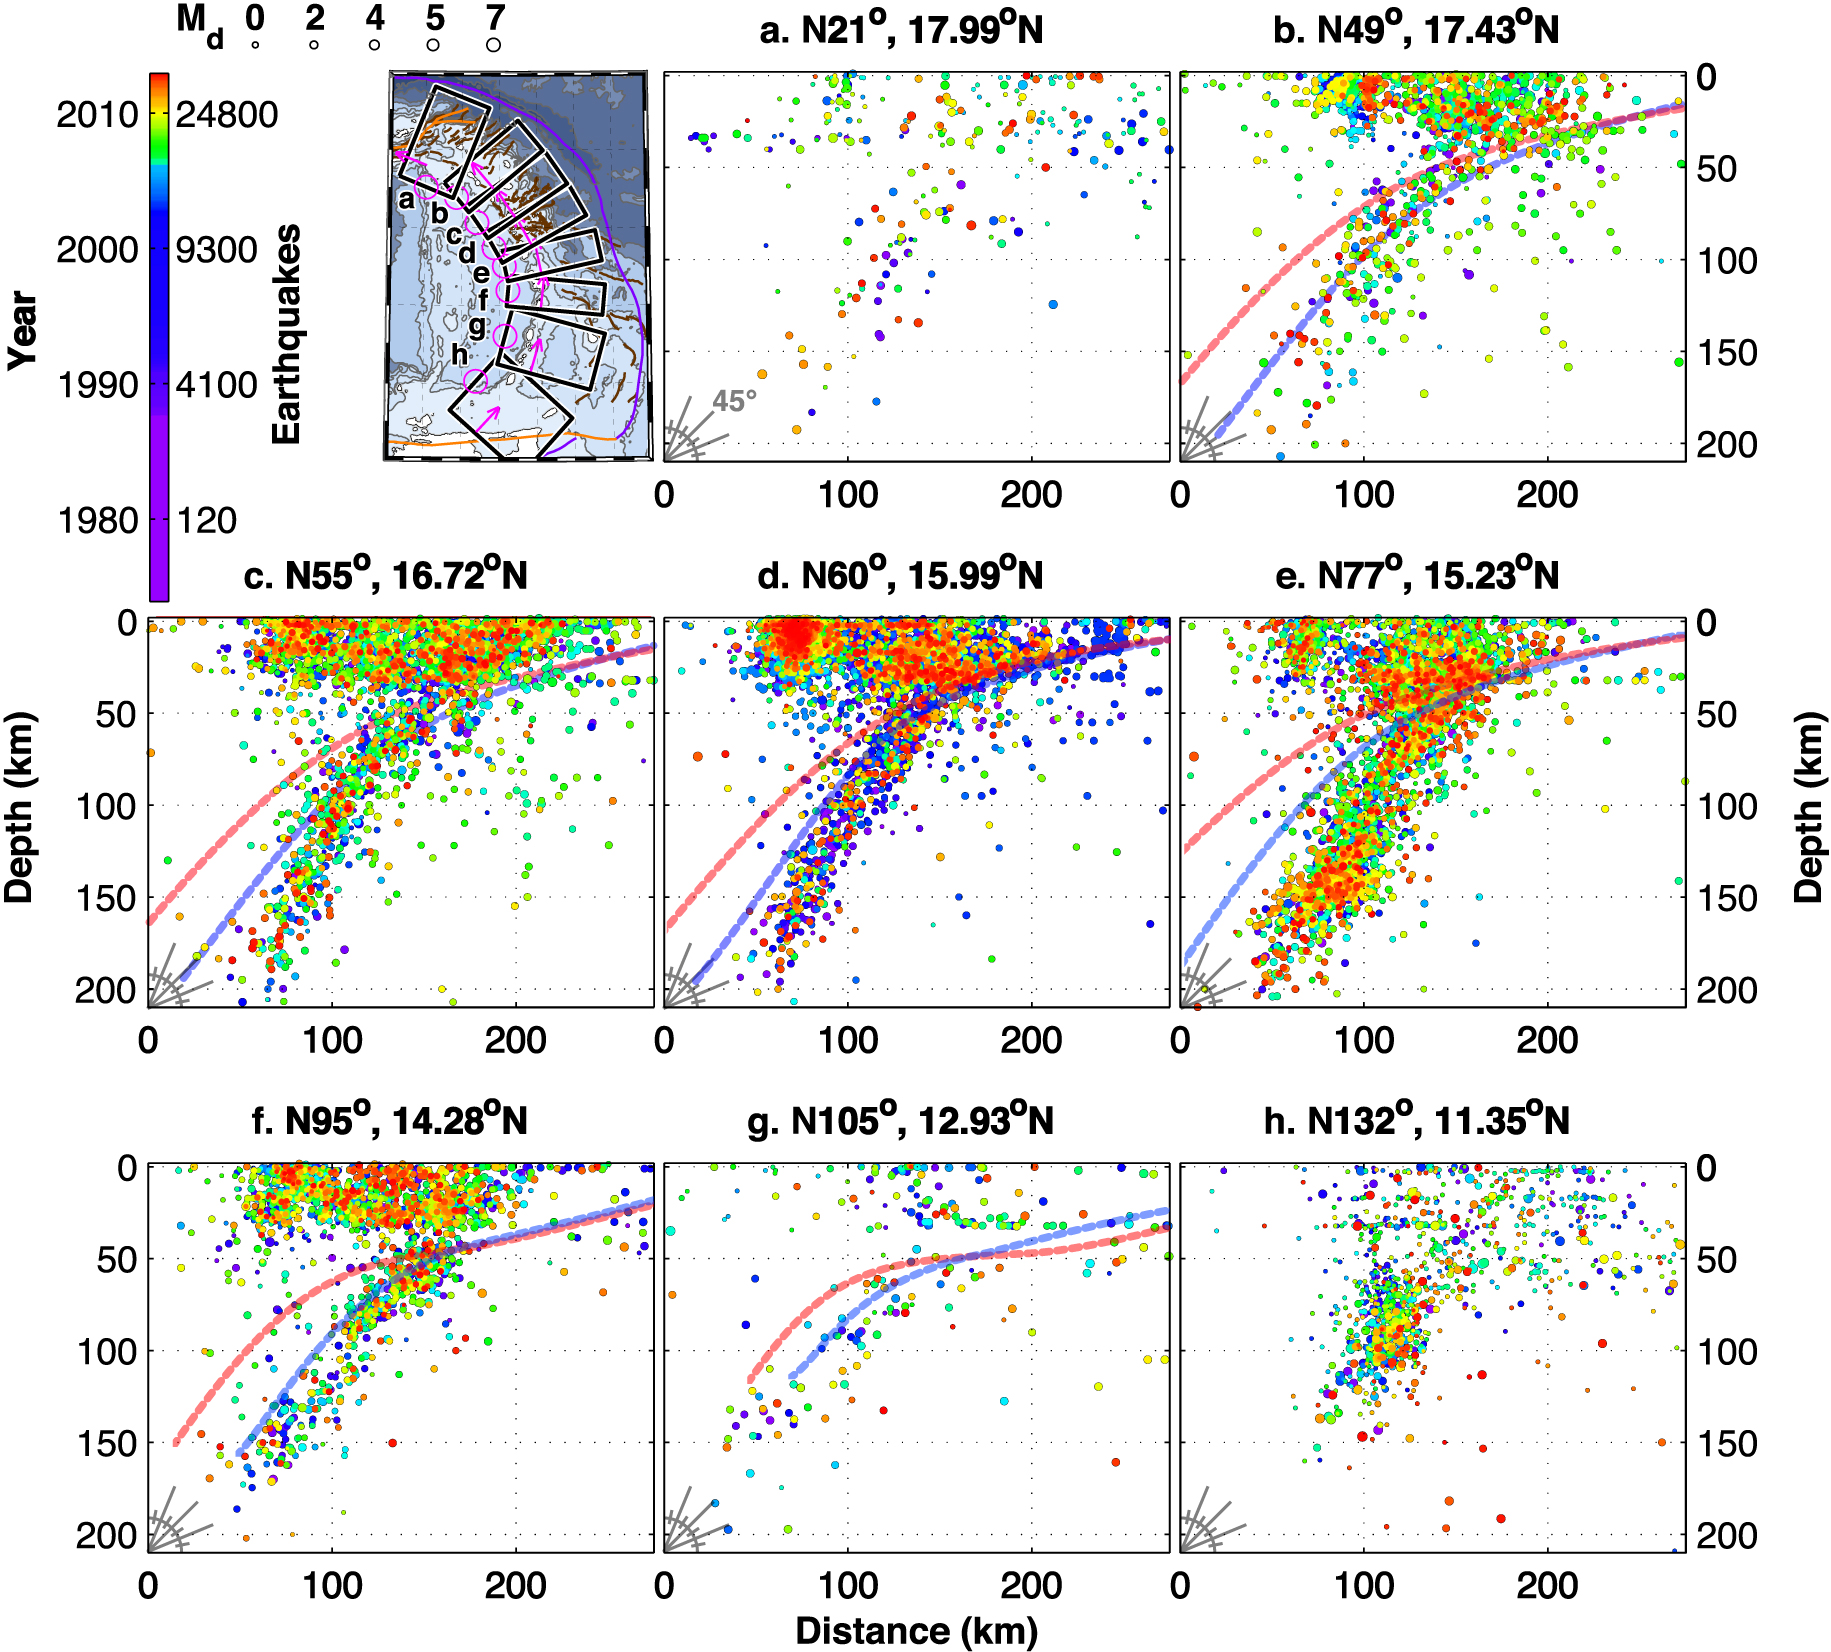
5. Discussion
The complete catalogue of preferred origin, which we name the CDSA catalogue, is analysed to infer the domain of its validity and to estimate the proportion of missing earthquakes.
5.1. Preferred origins selection
The median number of P- and S-waves is increased respectively from 8 ± 8P and 3 ± 4S in the initial catalogues and to 9 ± 30P and 3 ± 4S in the preferred catalogue. The RMS decreased from 0.16 ± 0.15 s in the original catalogues to 0.13 ± 16 s in the preferred catalogue. The metric we choose to compare origin qualities is the RMS/NP+S ratio because it is a simple quality estimator independent to the location method, and it leads to the same result that the method used in Bengoubou-Valérius et al. [2008], which is based on several different parameters (Dmin, RMS, azimuthal gap and average uncertainties). Bengoubou-Valérius et al. [2008] followed a similar approach than Bondár and Storchak [2011] who introduced an empirical relationship based on Dmin, number of phases, azimuthal gap and average uncertainties. The RMS/NP+S ratio has been used in the OVS-IPGP observatory for routine origin classification, and has the advantage to be simpler and applicable with any location method, since it does not depends on location uncertainties. However a better approach for the preferred origin selection should be based on a quantitative estimation of the posterior probability of an origin location given by any location method as already available in NonLinLoc [Lomax et al. 2000; Tarantola and Valette 1982b; Tarantola 1987]. Further work in this matter should aim at developing such a capability and to test it with multiple location methods and a large earthquake sample.
5.2. Relocation uncertainties
The uncertainties on the locations of our final catalogue are related first, to the geometry of the Lesser Antilles subduction, where network coverage is inherently limited to the north–south oriented insular arc, and second, to the 1-D velocity models that we used. The lack of 3-D velocity model limits the precision and the quality of our locations. Preliminary tomographic analysis [Barnoud et al. 2015] and joint inversion of receptor function and dispersion curves [González et al. 2012, 2018] suggest the existence of seismic velocity anomalies of about 5% from the model of Dorel et al. [1979]. Thus the location uncertainties (in the order of several kilometres) provided within our catalogue are probably not underestimated considering the error due to our velocity model. It is crucial to integrate the location uncertainties within any use of the origin catalogue, and the error due to our velocity model is most probably inferior or equivalent to the location uncertainties.
Time sequences of the magnitudes of the complete preferred origins catalogue in the crust and slab. The magnitudes have been selected from the initial catalogue from the closest IPGP-OVS when available or ISC otherwise. The large amount of earthquakes that appears in B on November 2004 comes from the November 21, 2004, Mw 6.4 Les Saintes earthquake aftershock sequence. In D, the November 29, 2007, Mw 7.4 Martinique earthquake (at 150 km depth) also triggers an aftershock sequence.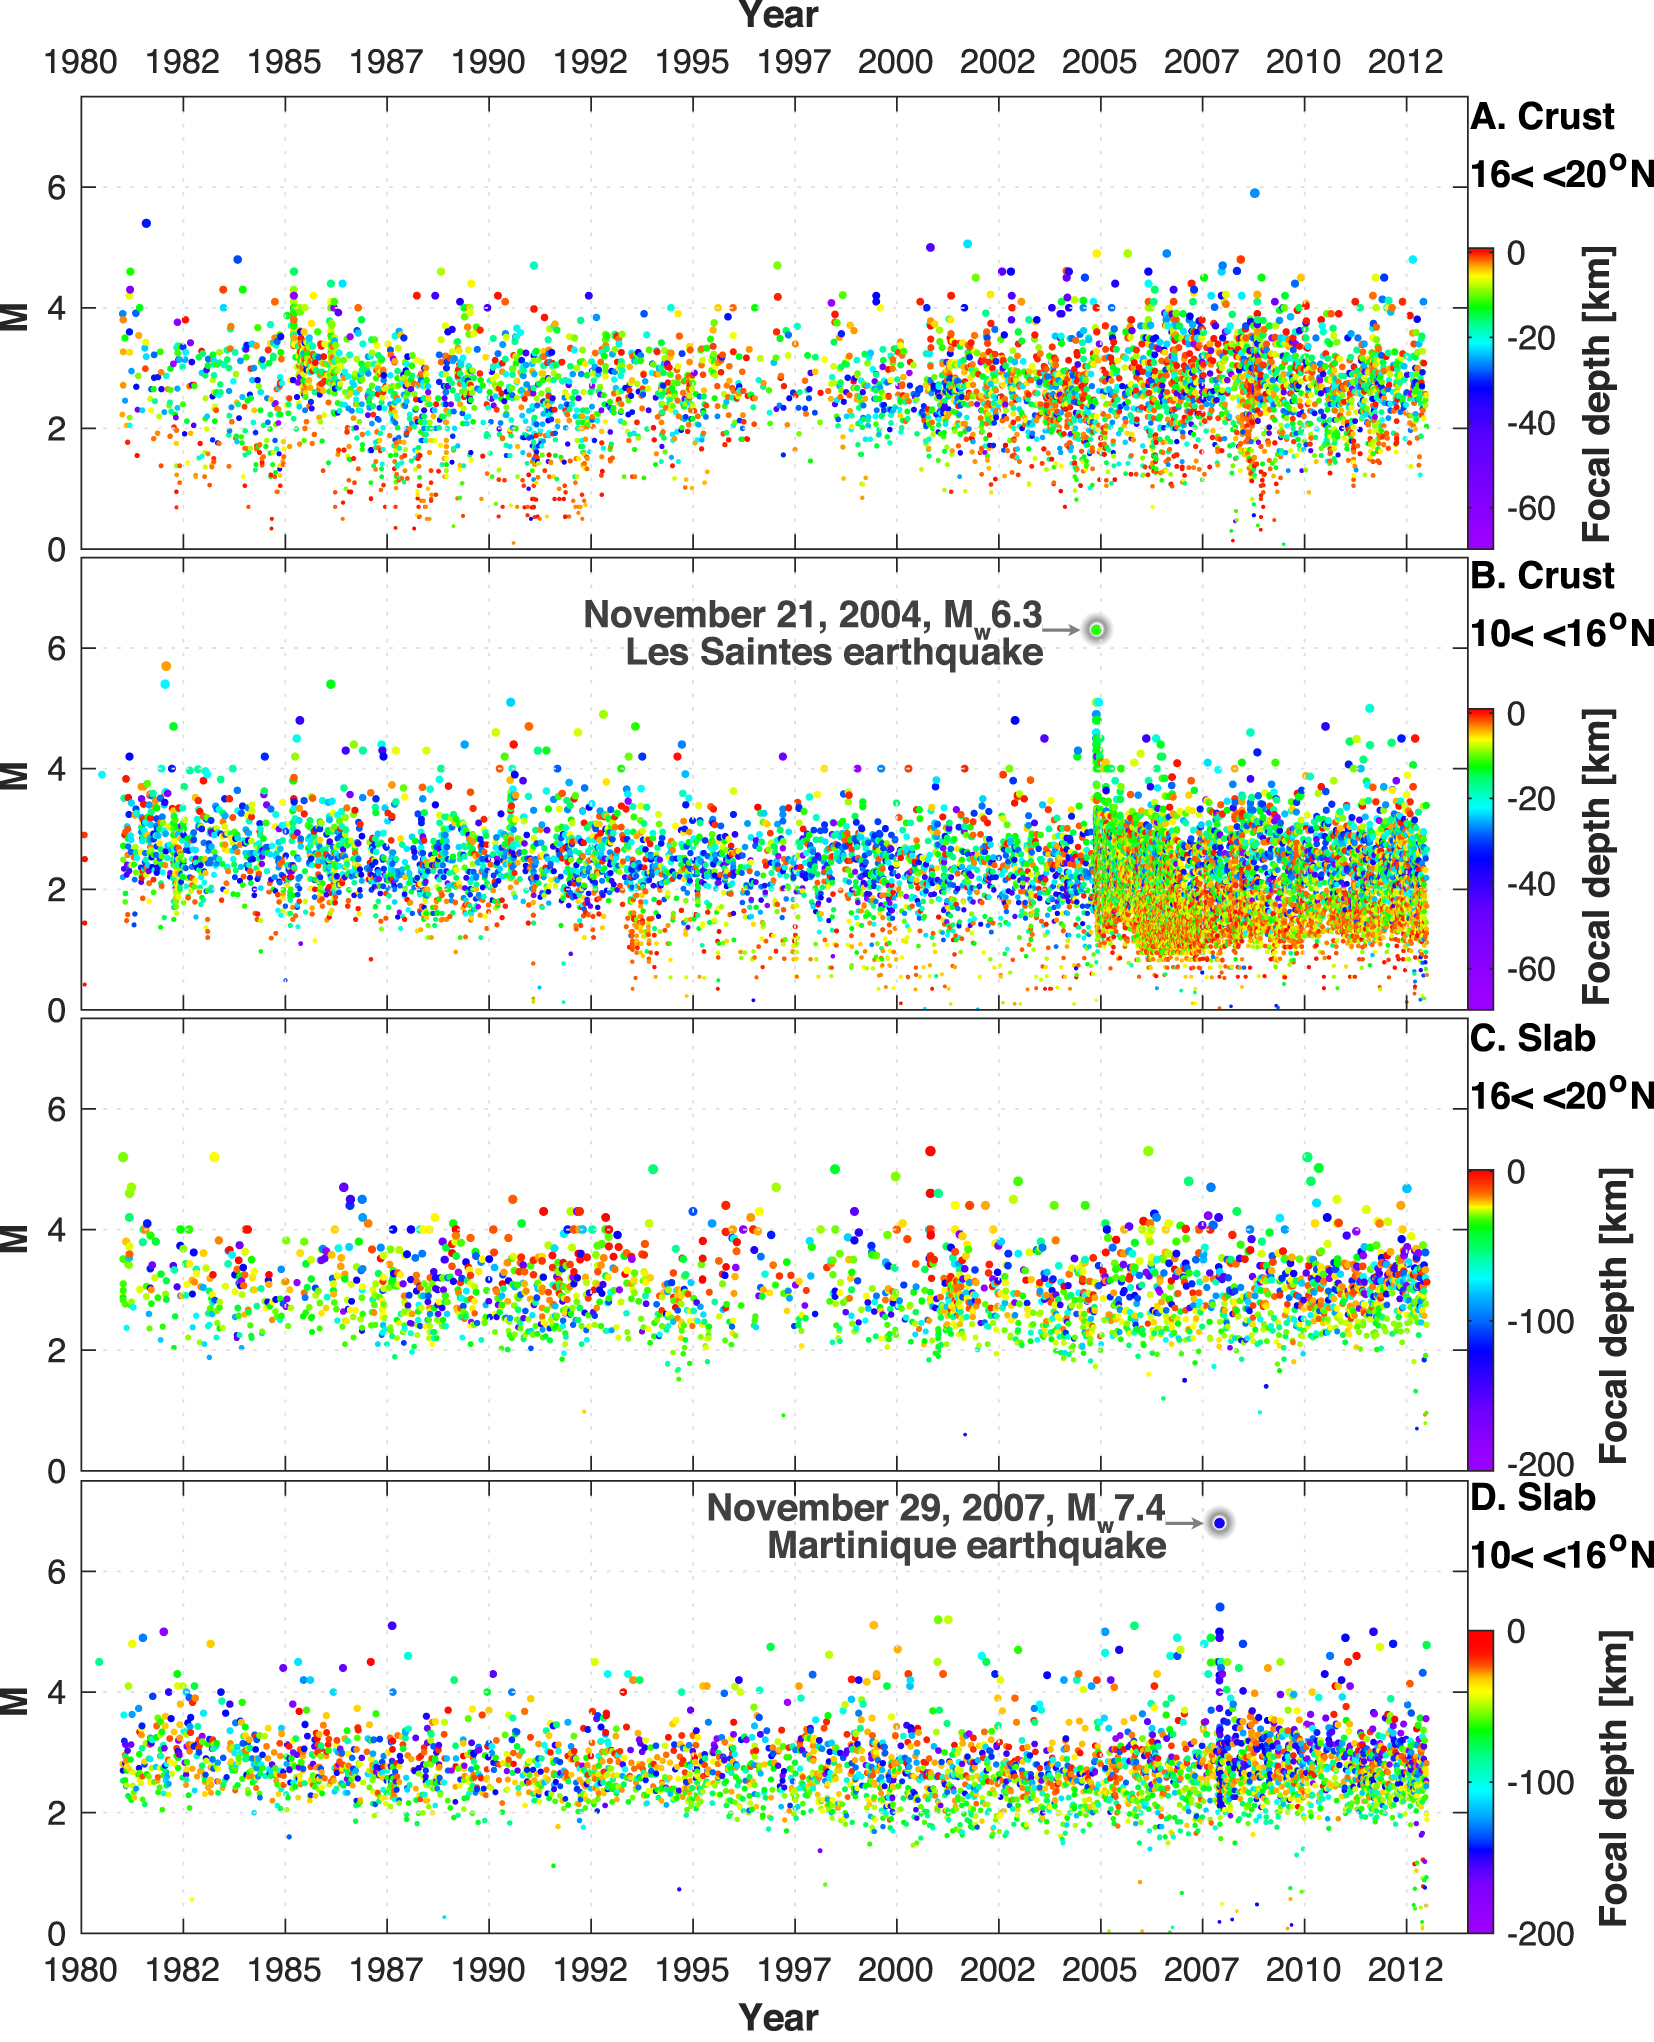
5.3. Distribution of the seismicity
The CDSA earthquake catalogue exhibits first-order features in its spatial (Figures 5 and 6) and temporal (Figure 7) earthquake distributions. The map of enhanced preferred origins in Figure 5 and cross-sections in Figure 6 show:
- a seismogenic thickness (approximated as the average thickness of the depth section including 95% of the seismicity) of about 35 km for the Caribbean crust, and 20 km for slab consistent with González et al. [2018],
- an increase of shallow earthquake density at a latitude between 18° N and 16° N,
- at a latitude between 16.8° N and 16° N, a dip angle of the slab of about 22° between 0 and 50 km deep, and 56° below 50 km deep,
- and elsewhere, a dip angle of the slab of about 45°.
The structural information provided by the dip angle can be compared with other analysis [e.g., Bengoubou-Valérius et al. 2008; Hayes et al. 2018; Bie et al. 2019]. Bie et al. [2019] appears to be more consistent with our results than Hayes et al. [2018] but this requires further work for interpretations and discussion. The time sequences and magnitudes in Figure 7 shows:
- a temporary deterioration of the registration magnitude in the northern panel of both the slab and the crust area between 1996 and 1999.
- an improvement of the registration of the crust seismicity after 1995 in the south of the Caribbean crust area.
- a slight improvement in the level of registration of the slab seismicity after 2000.
- the November 21, 2004, Mw 6.4 Les Saintes earthquake aftershock sequence (in Figure 7b) and the November 29, 2007, Mw 7.4 Martinique earthquake 150 km deep aftershock sequence (in Figure 7d).
More generally, fewer earthquakes are observed south of Martinique (below 14.5° N, Figure 6a) and north of Antigua (over 17° N, Figure 6g and h). These gaps in the seismicity have been identified previously [e.g., Schlaphorst et al. 2016; Feuillet et al. 2001] but their origin remains puzzling, as they could come either from a lack of instrumentation or from a real seismicity gap [an overview of their possible explanation is given in van Rijsingen et al. 2021]. We compute the magnitude completeness and the b-value to compare the relevance of our catalogue to those that already exist for studying these two hypothesis. However, this work is not a structural study, rather a comparative analysis of the content of the new catalogue.
5.4. Magnitude of completeness
We evaluate the variations of the magnitude of completeness (MC) with the same multi-scale approach than Vorobieva et al. [2013]. High resolution of the MC values is achieved through the determination of the smallest space-magnitude scale in which the Gutenberg–Richter law is verified. Vorobieva et al. [2013] used artificial and natural OVS-IPGP earthquake catalogues to demonstrate the efficiency of the method in our region of interest, with mixed types of seismicity, a variable density of epicentres and various levels of registration. We apply the same method with the same parameters and within the same central area of the Lesser Antilles as in Vorobieva et al. [2013]. Considering the significant heterogeneity of magnitude types and uncertainties outside the central area implied by the relatively higher contribution of ISC, we limit potential bias to what has been previously admitted by analysis of the same region than Vorobieva et al. [2013].
Magnitudes of completeness (MC, A–D) and related uncertainties (E–H) in two periods of time for the crust (upper panels) and slab (lower panels) catalogues.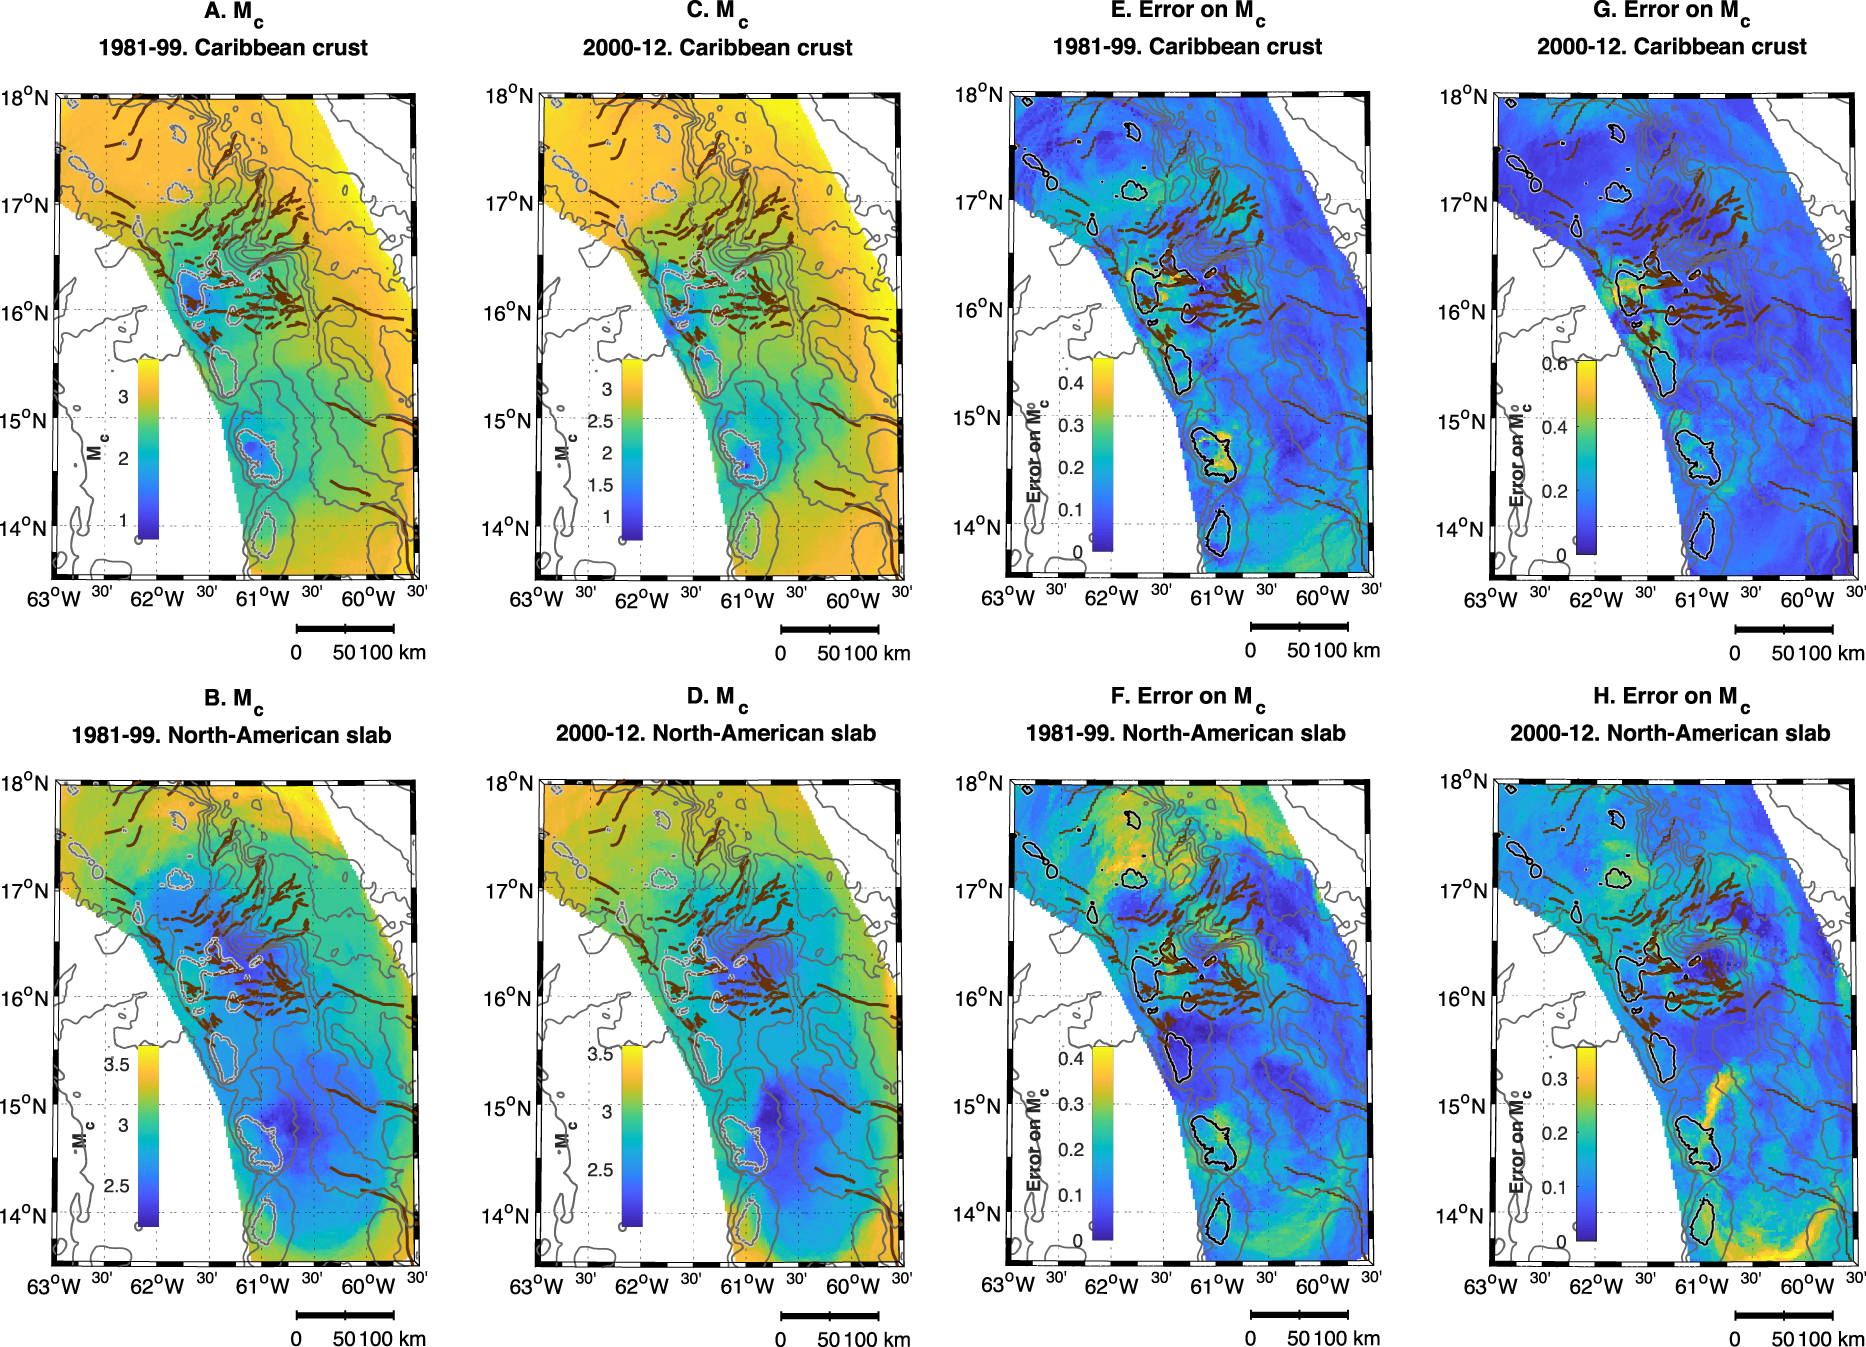
b-values (A–D) and related uncertainties (E–H) in two periods of time for the crust (upper panels) and slab (lower panels) catalogues.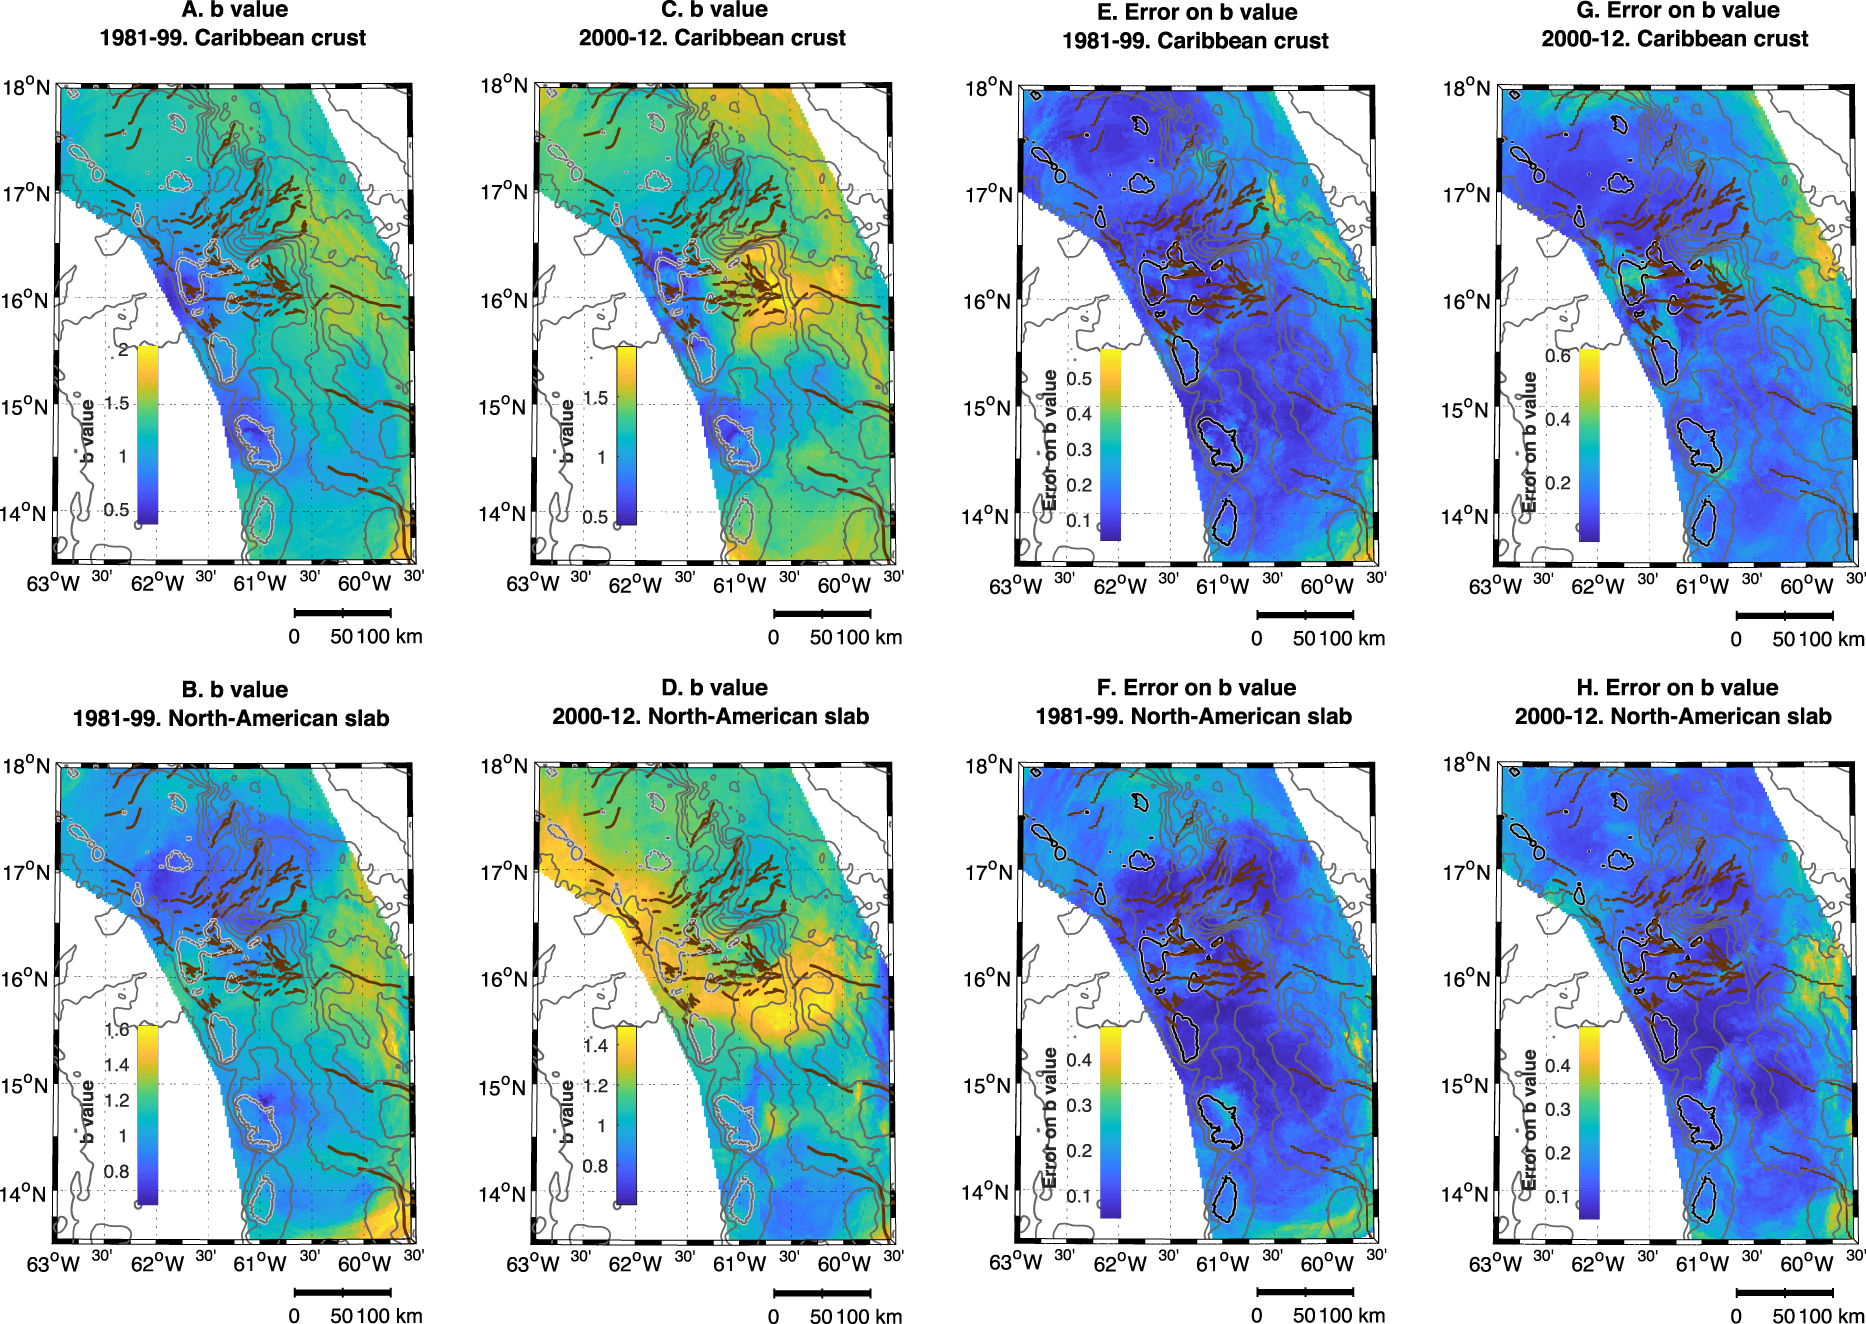
The complete preferred origins catalogue is tested between 1981 and 2012, between 13.5° N to 18° N, 59° W to 63° W. Note that, earthquakes from volcanic areas are not included in the catalogue and therefore not taken into account. The tectonic earthquakes are separated to the American slab (22%) and Caribbean crust events (65%) in between the Caribbean and American plates border for a better presentation of the features of each type of seismicity. Considering location uncertainties, the classification of 13.7% of events is not reliably determined, and they are included neither to slab nor to crust sub-catalogues. We compute MC separately for a slab and a crust sub-catalogue over two different periods: before and after 2000 in order to infer first-order temporal variations. The results of our statistical analysis of the four sub-catalogues are represented in Figure 8. Overall, in both sub-catalogues and in two periods, MC are smooth, without discontinuities. The zone of MC 3.2 (Figure 8) almost completely covers seismically active territory for crust seismicity. The comparison with the results obtained with only the OVS-IPGP catalogues [Vorobieva et al. 2013] clearly shows the improvement using the new CDSA catalogue: Zones of the reliable detection of MC 2.7 and MC 3.2 are significantly extended. Only onshore Guadeloupe and Martinique, we get an increased MC, but it is simply due to the fact that we removed the volcanic events of very low magnitude. However, the onshore seismicity shows a lower value of MC in 1981–1991. This could be due to the inclusion in our CDSA catalogue of volcanic earthquakes both misclassified and mislocated outside of the volcanic edifice before 2000. The slab seismicity over M3.2 is completely recorded in 1981–1999 over the entire active zone, while in 2000–2012 the most northern territory displays MC about 3.5. The zone of reliable registration over M2.7 slightly extends in 2000–2012 comparing with 1981–1999 for both, slab and crust seismicity. Finally, our results indicate that the completeness analysis does not show a significant difference between the areas south of Martinique and north of Antigua.
5.5. b-value distribution
We compute the b-value separately for slab and crust sub-catalogues in two periods: before and after 2000 (Figure 9). In the Caribbean crust, the b-value variations reflect significant spatial variation. We observed minimum b-value (below 0.8) near the islands, while b-values gradually grows over 1.3 towards Atlantic. This change in b-value may be a natural, reflecting an increased stress level near the island chain, consistently with the occurrence of the M6.3 earthquake in Les Saintes in 2004, an area where the seismicity is still very active. We also note that the additional drop of b-value onshore Guadeloupe and Martinique to 0.5–0.6 may be a consequence of some remaining earthquake location bias, related to the variation of the registration level.
For the slab catalogue, the b-value shows lesser spatial variations than in the crust. Its typical value is about 1 and is a bit smaller than for the crustal seismicity. It is in agreement with the general drop of b-value with depth observed in other seismic regions. Before 2000, within the slab catalogue, b-values are the same in the north and south. After 2000, within the slab catalogue, the b-value increases in the north over 1.1, while the b-value, if relatively stable elsewhere. This difference may reflect a natural time variation of the earthquake size distribution. It could be related to the November 29, 2007, Mw 7.4 Martinique earthquake 150 km deep aftershock sequence, or to its bias of analysis, increasing the rate of low magnitude earthquakes in the surrounding region. The difference between North and South is consistent with Schlaphorst et al. [2016]’s results, which interpreted this trend as the influence of the subducting slab fracture zones in the Northern Lesser Antilles (although without considering time variation). It implies that micro-earthquakes triggering processes are more active north of Antigua. We also observe relatively high b values anomaly offshore Dominica without significant MC change also consistent with Schlaphorst et al. [2016]. Schlaphorst et al. [2016] proposed that potential hydrated fluids in the Caribbean crustal faults could induce earthquakes in this area by increasing pore pressure and decreasing normal stress. The area of increased b-value corresponds to a dense network of active extensional and sinistral shear faults in the Caribbean crust [Feuillet et al. 2001]. This area also corresponds to a deep subduction trench section [which is over 5900 m deep north of Guadeloupe, Sandwell and Smith 2009], where the biggest earthquake known in the Lesser Antilles has been located [M⩾8.3, Beauducel and Feuillet 2012]. To explain active faulting and increased earthquake activity northward of Guadeloupe, a higher strain rate has been proposed in this region [Feuillet et al. 2002, 2001, 2011]. Such an effect should be quantified by structural analysis and geo-dynamical modelling of the Lesser Antilles subduction zone.
6. Conclusion
Our study is a manifest of a new earthquake catalogue for the Lesser Antilles with unprecedented completeness and precision. The CDSA catalogue is more complete and more accurate than the ISC catalogue for the central part of the Lesser Antilles subduction arc and to some extend, more accurate than the OVS-IPGP catalogues. It allows continuous earthquake observation over 40 years with an overall magnitude of completeness of 3.5. It also integrates sub-catalogues with homogeneous origin location methods based on Hypo71 and NonLinLoc. Our results from statistical observations strengthen previous works, confirming the presence of an increased micro-earthquake activity North, offshore Guadeloupe, which corresponds to an active faulting area. However, further work could be achieved to improve our understanding of Lesser Antilles earthquakes. Tomographic velocity models can now be inverted and location could be improved. However we showed that general trends can already be seen in earthquake distribution considering bias from locations uncertainties.
Acknowledgements
The framework for creating CDSA was funded by the French government and Europe, the Guadeloupe region, and the main collaborators IPGP, BRGM, and UAG (FEDER Guadeloupe, Contrat de Projets Region, 2007–2013). We used data from IPGP observatories, BRGM, Resif-RAP, and ISC. We are thankful for the continuous work provided by the teams of routine earthquake analysts from all observatories contributing to our study. We would like to thank Mendy Bengoubou-Valérius, Daniel Amorese, Richard Robertson, Olivier Coutant, Mike Kendall, David Shlaphorst, Pascal Bernard, O’Leary Fernando Gonzalez Matos, and Celine Dessert for their beneficial discussion, as well as Alexis Bosson, and Xavier Beguin for their contribution to the creation of the CDSA database and website.