


 CC-BY 4.0
1. Introduction
Water solubility in silicate melts has been widely investigated because of the important effects it has on magma properties, such as viscosity and density [e.g. Dingwell et al. 1996; Richet et al. 1996], liquidus and solidus temperatures, phase compositions [e.g. Sisson and Grove 1993] and mineral stabilities [Housh and Luhr 1991; Holtz et al. 1992], and crystallization kinetics [e.g. Watson 1994; Cashman and Mangan 1994; Arzilli et al. 2020] and eruptive dynamics [e.g. Cassidy et al. 2018]. Water solubility has been thoroughly investigated in basaltic and rhyolitic compositions [e.g. Hamilton et al. 1964; Silver et al. 1990; Dixon et al. 1995; Moore et al. 1998; Behrens and Jantos 2001; Tamic et al. 2001; Liu et al. 2005; Lesne et al. 2010] for which the general effects of composition, particularly that of alkalis and silica contents [e.g. Johannes and Holtz 1996; Romano et al. 1996; Dingwell et al. 1997; Holtz et al. 2000; Behrens et al. 2001; Schmidt and Behrens 2008; Stabile et al. 2018, 2020], and pressure–temperature are well established [e.g. Holtz et al. 1992, 1995; Behrens et al. 2001]. More recently, several studies have also focused their attention on intermediate compositions such as andesite–dacite [Mandeville et al. 2002; Botcharnikov et al. 2006; Behrens et al. 2004], phonotephrite [Behrens et al. 2009] and phonolite [Carroll and Blank 1997; Larsen and Gardner 2004; Iacono-Marziano et al. 2007; Schmidt and Behrens 2008] melts. In contrast, less attention has been paid to compositions such as trachytic melts, which usually represents the parental composition to peralkaline rhyolite/phonolite melts: only Di Matteo et al. [2004] and Fanara et al. [2015] have obtained solubility data on such compositions. Trachyte and pantellerite magmas are involved in explosive eruptions, some of which can be of large magnitude (e.g. Tambora 1815, Campanian Ignimbrite 39 kyr, Green Tuff 45 kyr), and it is therefore vital to accurately constrain water solubility in such melts. Enlarging the spectrum of available solubility data is also crucial to further improve already existing solubility models [e.g. Papale et al. 2006; Ghiorso and Gualda 2015].
Here, we present new experimental H2O solubility data obtained on trachytic and pantelleritic melts over the pressure range of 50–300 MPa. The trachyte and pantellerite used in this study are representative of the most abundant magmas on Pantelleria island. The water contents dissolved in experimental glasses have been determined by FT–IR spectroscopy, Karl Fischer titration (KFT) and elemental analyser (EA). The necessity of performing additional experiments arises from the observed dependence of water solubility on the composition of silicate melts, as several studies quoted above have illustrated. In particular, a small variation in melt chemical composition influences not only water solubility but also the extrapolation of molar absorption coefficients. FT–IR spectroscopy is a common tool used to determine the water content of natural volcanic products (melt inclusions and glassy groundmasses) but its accuracy is strongly related to the use of proper absorption coefficients, calibrated on compositions similar to that of natural glasses investigated. Otherwise, the extrapolation of absorption coefficients outside the calibration range may lead to a significant error in water determination. For this reason, in this work, we also used the results of FT–IR spectroscopy, KFT and EA analyses to determine the IR molar absorption coefficients for 4500 and 5200 cm−1 bands by using the peak intensity and a straight line correction procedure [Stabile et al. 2020, and reference therein].
2. Starting material and experimental strategy
2.1. Starting material and charges preparation
Chemical composition of experimental glasses
| T (°C) | P (MPa) | SiO2 | TiO2 | Al2O3 | FeO | MnO | MgO | CaO | Na2O | K2O | P2O5 | Total | Original total | P.I. | |
|---|---|---|---|---|---|---|---|---|---|---|---|---|---|---|---|
| Green Tuff Trachyte (GTT) | |||||||||||||||
| Starting material | 64.12 | 0.85 | 15.04 | 6.27 | 0.27 | 0.62 | 1.48 | 6.58 | 4.6 | 0.17 | 100 | 1.05 | |||
| GT R11-1 | 950 | 50 | 65.27 | 0.87 | 15.07 | 5.32 | 0.19 | 0.63 | 1.45 | 6.74 | 4.7 | 0.21 | 100 | 94.82 | 1.07 |
| sd | 0.62 | 0.07 | 0.32 | 0.31 | 0.08 | 0.04 | 0.06 | 0.26 | 0.09 | 0.09 | 0.98 | ||||
| GT R10-1 | 950 | 100 | 65.62 | 0.77 | 15.46 | 4.79 | 0.24 | 0.6 | 1.33 | 6.33 | 4.65 | 0.21 | 100 | 95.57 | 1.00 |
| sd | 0.55 | 0.08 | 0.17 | 0.25 | 0.09 | 0.03 | 0.05 | 0.73 | 0.16 | 0.07 | 0.89 | ||||
| GT R 9-1 | 950 | 150 | 65.23 | 0.95 | 15.24 | 5.34 | 0.35 | 0.65 | 1.54 | 6.46 | 4.55 | 0.29 | 100 | 94.51 | 1.02 |
| sd | 0.36 | 0.07 | 0.11 | 0.23 | 0.07 | 0.03 | 0.04 | 0.81 | 0.18 | 0.09 | 0.94 | ||||
| GT R 15-1 | 985 | 200 | 65.60 | 0.88 | 14.86 | 5.58 | 0.22 | 0.62 | 1.50 | 6.17 | 4.37 | 0.20 | 100 | 95.59 | 1.00 |
| sd | 0.36 | 0.10 | 0.18 | 0.26 | 0.12 | 0.03 | 0.06 | 0.62 | 0.14 | 0.09 | 0.67 | ||||
| GT R 18-2 | 985 | 200 | 65.14 | 0.86 | 15.00 | 5.56 | 0.20 | 0.63 | 1.48 | 6.51 | 4.43 | 0.20 | 100 | 95.59 | 1.03 |
| sd | 0.46 | 0.09 | 0.22 | 0.19 | 0.09 | 0.03 | 0.05 | 0.56 | 0.14 | 0.08 | 0.73 | ||||
| GT R19-1 | 985 | 300 | 65.06 | 0.80 | 15.04 | 5.25 | 0.23 | 0.61 | 1.42 | 7.14 | 4.28 | 0.18 | 100 | 91.76 | 1.09 |
| sd | 0.33 | 0.11 | 0.15 | 0.29 | 0.11 | 0.03 | 0.04 | 0.35 | 0.11 | 0.09 | 0.57 | ||||
| GT R16-1 | 985 | 300 | 65.28 | 0.87 | 15.55 | 5.64 | 0.21 | 0.60 | 1.50 | 5.39 | 4.57 | 0.39 | 100 | 90.84 | 0.89 |
| sd | 0.74 | 0.09 | 0.65 | 0.26 | 0.10 | 0.03 | 0.05 | 0.20 | 0.16 | 0.12 | 0.50 | ||||
| Pantellerite (Pan113) | |||||||||||||||
| Starting Material | 69.45 | 0.48 | 10.15 | 7.87 | 0.21 | 0.10 | 0.53 | 6.71 | 4.46 | 0.04 | 100 | 1.56 | |||
| Run C-Run L | 850 | 50 | 72.64 | 0.37 | 10.90 | 5.28 | 0.32 | 0.19 | 0.35 | 5.02 | 4.94 | 100 | 93.49 | 1.25 | |
| sd | 0.96 | 0.11 | 0.33 | 0.56 | 0.16 | 0.21 | 0.38 | 0.21 | 0.17 | 0.69 | |||||
| Run A-RunH | 850 | 100 | 72.56 | 0.44 | 11.20 | 4.85 | 0.23 | 0.22 | 0.37 | 5.12 | 5.00 | 100 | 91.89 | 1.24 | |
| sd | 0.47 | 0.07 | 0.14 | 0.27 | 0.14 | 0.03 | 0.03 | 0.58 | 0.19 | 0.38 | |||||
| Run B2 | 850 | 150 | 72.83 | 0.36 | 11.61 | 4.40 | 0.30 | 0.15 | 0.23 | 5.03 | 5.09 | 100 | 90.06 | 1.19 | |
| sd | 0.14 | 0.06 | 0.13 | 0.16 | 0.10 | 0.04 | 0.05 | 0.21 | 0.17 | 0.56 | |||||
| Run F | 850 | 200 | 70.91 | 0.42 | 10.35 | 7.58 | 0.29 | 0.08 | 0.51 | 5.16 | 4.61 | 100 | 89.25 | 1.30 | |
| sd | 0.31 | 0.06 | 0.15 | 0.23 | 0.13 | 0.01 | 0.09 | 0.10 | 0.13 | 0.76 | |||||
sd: standard deviation; P.I.: peralkalinity index.
We used, as starting materials, natural samples representative of the trachytic and peralkaline rhyolite (pantellerite) of Pantelleria Island (Table 1). Pantelleria, located in the Sicily Channel, is the type locality for pantellerite, an iron-rich rhyolite characterized by alkali/alumina molar ratio [(Na2O + K2O)∕Al2O3] > 1 [Macdonald 1974]. Pantellerites and trachytes are the most abundant rocks outcropping in the island and also in other localities, usually representing the felsic end member in continental rift zones (Pantelleria, Ethopian Rift valley, etc.) or in oceanic islands (Mayor Island, Azores, etc.). The trachyte (sample GTT) and pantellerite (sample Pan113) specimen used in this study have been the subject of phase equilibrium experiments by Di Carlo et al. [2010] and Romano et al. [2018, 2020]. To prepare the starting materials, the selected rocks were finely crushed and the resulting powders were melted twice at 1300 °C for 3 h, then rapidly quenched. The glasses obtained were grinded in an agate mortar obtaining a powder of 10–40 μm mesh size. This technique, used in several previous experimental works [Di Carlo et al. 2010; Romano et al. 2020], allows to produce a crystal-free and homogeneous glass with a composition similar to the starting bulk rock. Experimental charges were prepared by loading 50–100 mg of dry glass powder and 5–10 mg distilled water in gold capsules, ensuring volatile saturation at experimental conditions. At 50 MPa, the amount of water loaded was slightly lower, to avoid the risk of capsule rupture. Once prepared, capsules were weighed and welded, then weighed again to verify any water loss during welding. Gold capsules were preferred to platinum or gold–palladium containers in order to minimize iron loss to the capsule walls, since the duration of the experiments exceeded the 24 h. The applied temperature was higher than 950 °C for trachytes and 850 °C for pantellerites, conditions that in both cases ensured to be above the liquidus in our experimental runs [Di Carlo et al. 2010; Romano et al. 2018, 2020]. Prior to experiments, capsules were left at least for 24 h in an oven at 120 °C to allow the homogenisation of water throughout the capsule.
2.2. Experimental strategy
Experiments were performed in internally heated pressure vessels (at Institut des Sciences de la Terre d’Orléans) equipped with a molybdenum furnace and a fast quench device. As pressurizing medium, a mixture of argon and hydrogen loaded in the vessel at room temperature was used: the Ar/H2 ratio was fixed to reach redox condition around the FMQ buffer [e.g. Scaillet et al. 1992, 1995; Romano et al. 2020]. The pressure was recorded by a transducer calibrated against an Heise-Bourdon tube gauge (uncertainty ± 20 bar) while the temperature was continuously controlled through S-type thermocouples (accuracy ±5 °C). Experiments were performed in a T range 950–985 °C for trachytes and at 850 °C for pantellerites. The pressure range explored varied from 50 to 300 MPa (at 50 MPa intervals) and the duration of each experiment was between 96 and 125 h. Experiments were terminated using the drop-quench technique, which ensures a fast quench of the capsules from the top to the bottom of the vessel (quench rate >100 °C⋅s−1). After the experiments, capsules were weighed to check for leaks and if the post run weight difference was >0.4 mg, capsules were discarded. The excess of H2O within the capsule was confirmed by the occurrence of small water drops during the opening of the capsules, establishing that saturation conditions were reached during the experiment. For each capsule, around one-third of the run product was embedded in epoxy resin for qualitative analysis by a scanning electron microscope (SEM-EDS) and chemical analysis by an electron microprobe (EMP) while the remaining part was used to determine water contents.
3. Analytical methods
3.1. Scanning electron microscope and electron microprobe analyses
Glass fragments mounted in epoxy resin were first observed with a SEM and then analysed by an EMP to check glass for composition and homogeneity. EMP analyses were performed with a Cameca SX-Five located at CNRS-ISTO laboratory (France). Analytical conditions were an accelerating voltage of 15 kV, a beam current of 6 nA and a defocused beam of 10 × 10 μm. Na and K were analysed first to minimize volatile loss during the analyses. Microprobe analyses of alkali-rich hydrous glasses in some cases resulted problematic due to the alkali (mostly sodium) migration out of the excited volume. As suggested by Morgan and London [2005], we have used a current density of 0.006 nA/μm2 that limits the Na migration under the beam and also provides adequate excitation of all elements.
3.2. Karl Fischer titration and elemental analyser
The total water contents of experimental glasses were determined by KFT and EA (EA Thermo Scientific Flash 2000) both housed at CNRS-ISTO laboratory. In KFT analysis, 10–20 mg of glass fragments are placed within a Pt crucible in an induction furnace and heated up to 1300 °C. Water liberated during the heating of glass fragments reacts quantitatively in a titration cell with iodine. The EA allows determining the concentration of H–C–N in experimental samples. In our case, only H2 was measured to infer water content. The glass in the EA is first heated to 1800 °C upon which the substance oxidizes into simple compounds, which are in turn quantified by thermal conductivity detection. Moussallam et al. [2015] used this technique to determine water and CO2 contents in kimberlite melts. The EA was calibrated before each analytical session using pure pyrophyllite, which is known to contain 5 wt% of stoichiometric H2O in its crystalline structure. The experimental samples for the EA were prepared by grinding 1–10 mg of experimental glass into a fine powder and then loading it in a tin capsule folder. The instrument was tested repeatedly using an international standard with known amounts of carbon, hydrogen and nitrogen and also using other hydrated glass samples (as internal standards) prepared for this purpose and for which water concentration was already known (haplogranite) or already analysed with KFT. In Figure 1 (Table 2), the water content determined by EA is compared with literature data for haplogranite composition [Dingwell et al. 1997], Eburru obsidian [Scaillet and Macdonald 2006] and KFT analyses of this study; a good correlation is observed between H2O contents retrieved by these different techniques.
Comparison between water content in silica-rich melts analysed by EA and KFT; analyses on experimental glasses synthetized in this study, haplogranite (HPG8) composition [Dingwell et al. 1997] and Eburru obsidian [Scaillet and Macdonald 2006].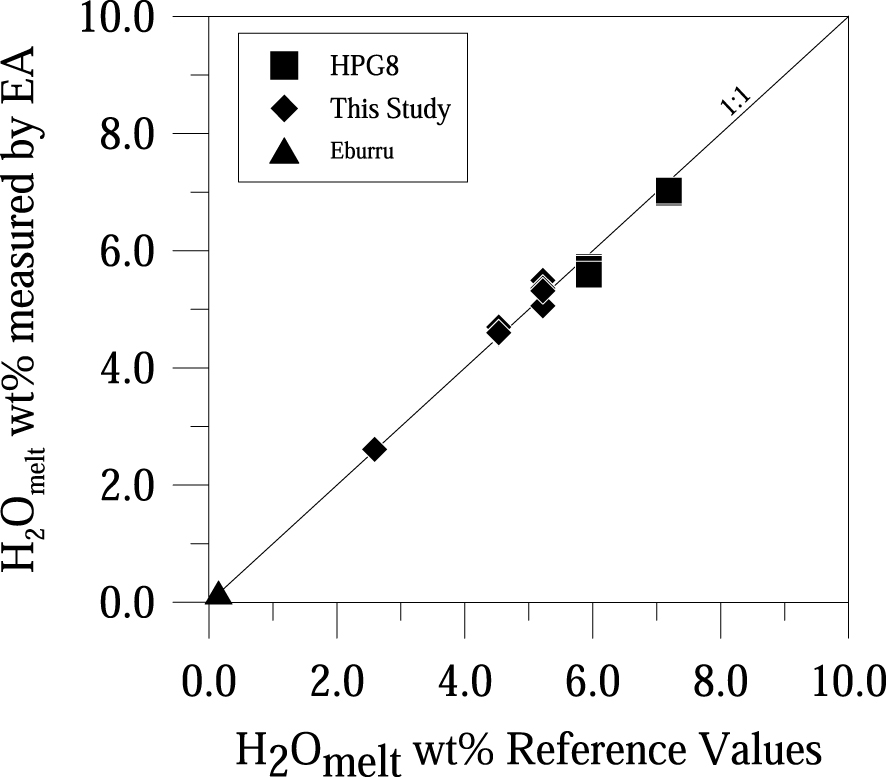
Comparison of water content measured by Elemental Analyser and reference value
| Experimental pressure (MPa) | Elemental analyser | Reference values* | |
|---|---|---|---|
| HPG8 GT R18-5 | 200 | 5.72 | 5.94 |
| HPG8 GT R18-5 | 200 | 5.69 | 5.94 |
| HPG8 GT R18-5 | 200 | 5.59 | 5.94 |
| HPG8 GT R19-4 | 300 | 6.99 | 7.19 |
| HPG8 GT R19-4 | 300 | 6.99 | 7.19 |
| HPG8 GT R19-4 | 300 | 7.03 | 7.19 |
| Pan 113 RUNB-1 | 150 | 5.06 | 5.22 |
| Pan 113 RUNB | 150 | 5.49 | 5.22 |
| Pan 113 RUNB-2 | 150 | 5.36 | 5.22 |
| Pan 113 RUN B | 150 | 5.32 | 5.22 |
| Pan 113 RUN C | 50 | 2.61 | 2.59 |
| Pan 113 RUNH | 100 | 4.70 | 4.53 |
| Pan 113 RUNH | 100 | 4.57 | 4.53 |
| Pan 113 RUNH | 100 | 4.60 | 4.53 |
| Eburru natural sample | 0.17 | 0.15 | |
* Reference value for HPG8 are from Dingwell et al. [1997].
Pan 113 and Eburru natural sample were analysed by Karl Fischer titration.
3.3. Density determination
Densities of anhydrous trachytic and pantelleritic starting glasses were measured by weighing single pieces of glass in air and ethanol. The determination of hydrous glass densities was more difficult because of the limited amount of run products; a minimum weight of 15 mg is indeed required to perform an accurate Archimedean density measure. Only for three hydrous trachytic glasses were reliable density data obtained (Figure 2a, Table 3), which was used to derive an empirical relationship of the form 𝜌 = −4.4017(H2Omelt) wt% + 2329. Standard deviation for density values was estimated from repeated measures of glass fragments. For comparison, the densities of hydrous experimental glasses were also calculated using the procedure of Ochs and Lange [1999], calculated values being 4 to 11% higher than those measured. A less clear relationship has been found between density and melt water content for pantelleritic experimental glasses (Figure 2b, Table 3) and calculated densities are 1 to 6% higher relative to measured ones. To maintain internal consistency, we preferred to use the density measured or calculated from the above empirical relationship, knowing that density measurements are affected by relative errors in the range 0.1–2.5%.
Dissolved H2Omelt versus glass density measured through the Archimedean method. Error bars indicate the standard deviation of repeated (∼10) measures.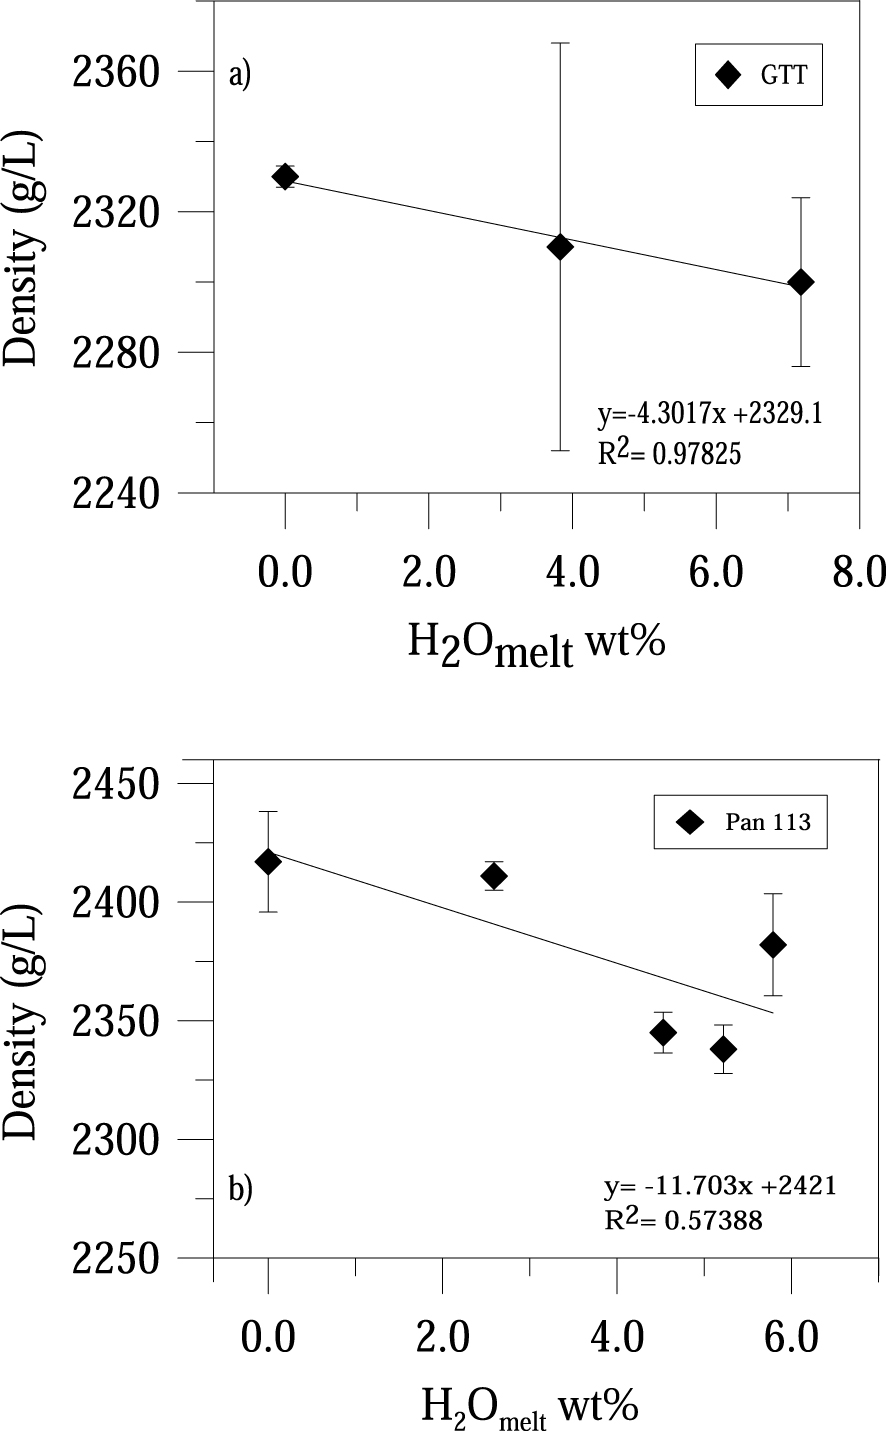
Experimental conditions and results of near-infrared FT–IR spectroscopy, elemental analyser and KFT analyses
| T (°C) | P (MPa) | H2Ot (wt%-EA) | H2O (wt%-KFT) | Density (g/L)* | Density (g/L)** | Thickness (cm) | A (OH−) | sd | A (H2Omol) | sd | OH (wt%) | sd | H2Om (wt%) | sd | H2O wt% (FT–IR) | sd | |
|---|---|---|---|---|---|---|---|---|---|---|---|---|---|---|---|---|---|
| Trachyte Starting Material | 2330 | 2590 | |||||||||||||||
| GTT R11-1 | 950 | 50 | 2.86 | 2317 | 0.0273 | 0.0433 | 0.0039 | 0.0768 | 0.0060 | 1.35 | 0.03 | 1.33 | 0.10 | 2.68 | 0.07 | ||
| GTT R10-1 | 950 | 100 | 3.84 | 2310 | 2460 | 0.0268 | 0.0525 | 0.0037 | 0.1210 | 0.0041 | 1.81 | 0.14 | 2.19 | 0.14 | 4.00 | 0.26 | |
| GTT R 9-1 | 950 | 150 | 4.95 | 2308 | 0.0177 | 0.0380 | 0.0016 | 0.1062 | 0.0044 | 1.92 | 0.04 | 2.86 | 0.11 | 4.78 | 0.13 | ||
| GTT R 15-1 | 985 | 200 | 5.98 (±0.08) | 2304 | 0.0193 | 0.0410 | 0.0023 | 0.1514 | 0.0094 | 1.89 | 0.20 | 3.70 | 0.24 | 5.73 | 0.42 | ||
| GTT R 18-2 | 985 | 200 | 5.87 (±0.23 | 2304 | 0.0208 | 0.0424 | 0.0032 | 0.1780 | 0.0102 | 1.81 | 0.15 | 4.03 | 0.29 | 5.89 | 0.28 | ||
| GTT R16-1 | 985 | 300 | 6.87 (±0.04) | 2298 | 2400 | 0.0286 | 0.0644 | 0.0062 | 0.3294 | 0.0083 | 2.00 | 0.19 | 5.42 | 0.11 | 7.42 | 0.25 | |
| GTT R19-1 | 985 | 300 | 7.37 (±0.20) | 2400 | 0.0211 | 0.0415 | 0.0054 | 0.1980 | 0.0143 | 1.75 | 0.21 | 4.42 | 0.29 | 6.17 | 0.45 | ||
| Pantellerite Starting Material (Pan113) | 2471 | 2547 | |||||||||||||||
| Pan113 Run C-Run L | 850 | 50 | 2.61 | 2.59 | 2411 | 2434 | 0.0178 | 0.0327 | 0.0015 | 0.0633 | 0.0015 | 1.14 | 0.13 | 1.41 | 0.13 | 2.56 | 0.26 |
| Pan113 Run A-RunH | 850 | 100 | 4.62 (±0.06) | 4.53 | 2345 | 2390 | 0.0196 | 0.0460 | 0.0026 | 0.1528 | 0.0155 | 1.49 | 0.12 | 3.17 | 0.36 | 4.66 | 0.35 |
| Pan113 Run B2 | 850 | 150 | 5.30 (±0.22 | 5.22 | 233 | 2366 | |||||||||||
| Pan113 Run F-Run I | 850 | 200 | 5.79 | 2382 | 2404 | 0.0182 | 0.0415 | 0.0031 | 0.1953 | 0.0033 | 1.43 | 0.11 | 4.29 | 0.10 | 5.72 | 0.20 | |
| Pan113 Run I | 850 | 200 | 2310 | 0.0172 | 0.0375 | 0.0019 | 0.1813 | 0.0041 | 1.40 | 0.06 | 4.35 | 0.08 | 5.75 | ||||
Density (g/L)*: Density calculated from Archimedean density measure; Density (g/L)**: density from Ochs and Lange [1999] procedure; AOH- and AH 2O: absorbance; sd: standard deviation.
3.4. FT–IR spectroscopy
Fourier Transform Infrared analyses were performed using a Nicolet 760 Magna spectrometer connected to an IR microscope (fluxed with H2O-free compressed air) housed at ISTO laboratory. The spectrometer was equipped with an MCT detector, a Globar light source and a KBr beam splitter. Absorption spectra were acquired for each sample in the range 1000–6000 cm−1 with 128 scans and a resolution of 4 cm−1. Experimental glass chip samples were placed on an NaCl crystal plate, which is transparent to the infrared beam; for each glass chip 3–5 points (50 × 50 μm spot size) were analysed. Experimental glasses were double-polished to obtain 100–300 μm thin wafers, and then carefully washed under acetone and ethanol in order to remove any impurities. The areas of the sample analysed were always checked optically to avoid bubble or impurities. The thickness of each glass chip was measured microscopically during the analysis, with an uncertainty of ±1–3 μm. Absorption spectra were converted in H2O concentration according to the Beer–Lambert equation:
| (1) |
4. Results
4.1. Microscopic observation and major element analyses
The run products consisted of microlite-free glasses. Most of the quenched glasses present also bubbles at the melt/capsule interface indicating fluid saturation during the experiment; however, bubble content never exceeded the 0.1 vol.%. Major element composition of experimental glasses (Table 1) resulting from analyses with a defocused beam (10 × 10 μm) [Morgan and London 2005] matches in a high extent the composition of starting materials.
4.2. Water solubility in trachyte and pantelleritic melts
The total H2O content dissolved in experimental glasses is reported in Table 3. Water content ranges from 2.9 wt% at 50 MPa to 7.1 wt% at 300 MPa for trachytic experimental glasses. At 200 and 300 MPa, two additional experiments were performed to check for the reproducibility of H2O solubility at high pressure (Table 3). In pantelleritic experimental glasses, the water content ranges from 2.6 at 50 MPa to 5.8 at 200 MPa and also in this case two additional experiments were performed at 2 MPa (Table 3). Figure 3(a,b) shows the variation of water content dissolved in the melt against pressure, confirming the general trend of increasing melt water content with increasing pressure as observed for all silicate melts (from basalt to rhyolite). The water solubility data in trachyte melt as a function of pressure can be described through an equation of the form CH2Omelt = 0.3557 ∗ P0.526 (R2 = 0.994), where P is pressure in MPa. For pantellerites, a similar power law describes the variation of melt water content with pressure reading as: CH2Omelt = 0.2786 ∗ P0.5834 (R2 = 0.957). All experimental studies on trachyte and pantellerite melts show an increase of melt water concentration with pressure but yield different slopes. Our experimental results will be compared below with available experimental data on Campi Flegrei trachytes [Di Matteo et al. 2004; Fanara et al. 2015] and with the experimental data of Stabile et al. [2018] on Kenyan haplo-pantellerites.
Dissolved H2Omelt as a function of pressure for trachyte (a) and pantellerite (b) melt compositions.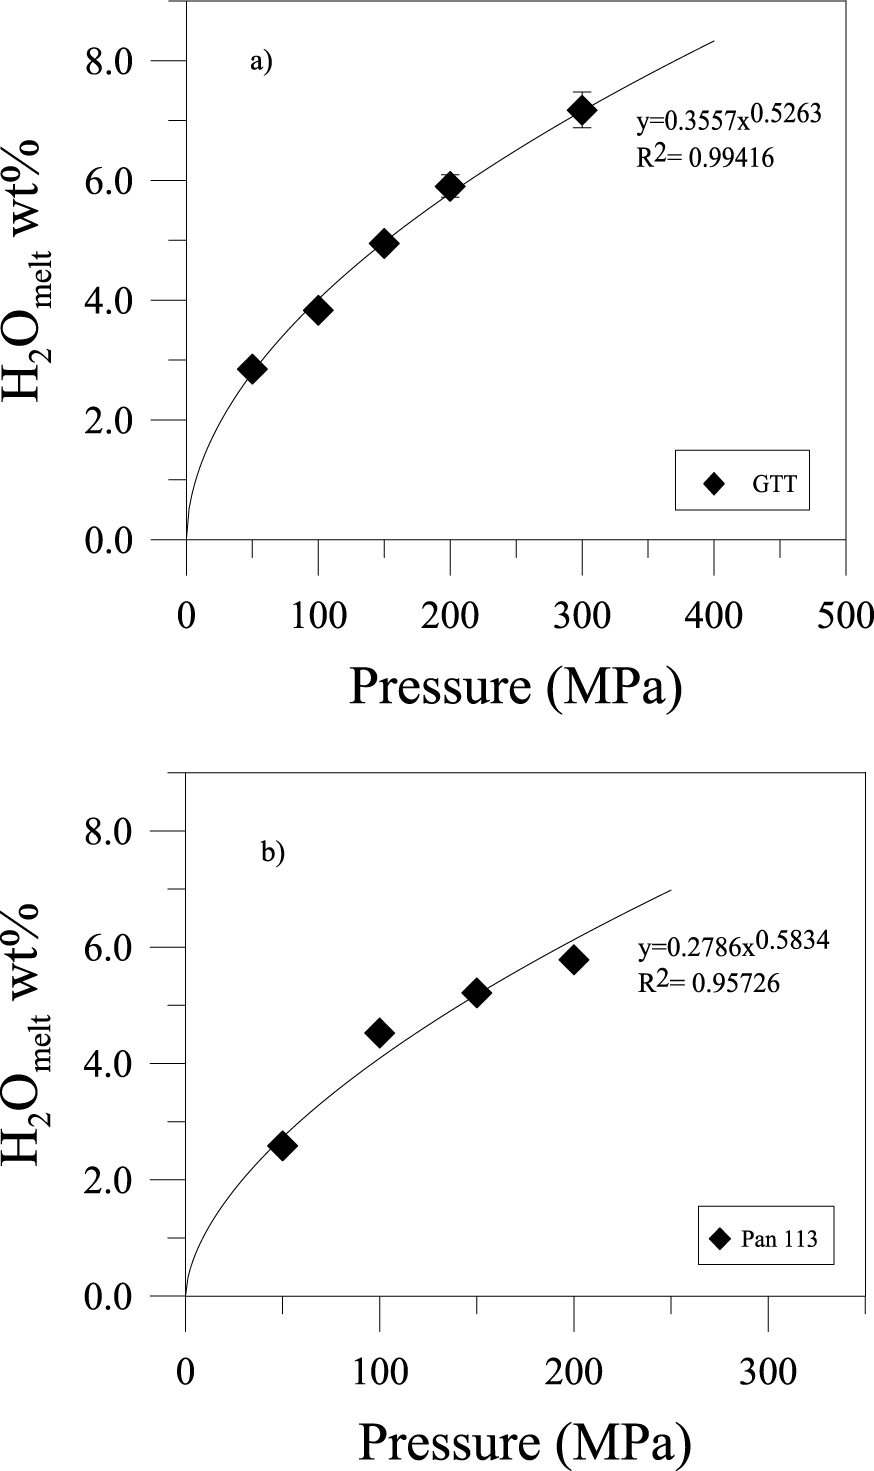
4.3. Analyses of IR spectra and molar absorption coefficients calibration
The bands of IR spectra at 5200 cm−1 and 4500 cm−1 for water species are the most used to determine water content in geological samples (Figure 4). The former is assigned to the combination of stretching and bending mode of H2O molecules (H2Om) while the second to the combination of stretching and bending of hydroxyls (OH−) groups [Stolper 1982]. To avoid an incorrect estimation of absorption band peak height, a baseline correction is required. Following the previous studies of Withers and Behrens [1999], Ohlhorst et al. [2001] and Mandeville et al. [2002], we used a simple straight baseline [TT baseline, [Ohlhorst et al. 2001]] connecting 4500 and 5200 backgrounds. We preferred to use this simple procedure knowing that a possible small underestimation of OH− band cannot be excluded, owing to the presence of the 4000 cm−1 band. As suggested by Stabile et al. [2020], depending on sample composition and spectral variation, a critical evaluation of the approach used for the baseline correction has to be taken into account. Absorbance (peak intensity), density and thickness of the glass allow us to determine molar absorption coefficients (𝜀), in our case for the bands of molecular H2O (5200 cm−1) and OH− groups (4500 cm−1). The total water content dissolved in the experimental glasses is the sum of water species (H2Om and OH−) and the Beer–Lambert equation can be rewritten as:
| (2) |
Near-infrared spectrum showing the two peaks related to group (at 4500 cm−1) and molecular water (5200 cm−1). The dashed lines tangential to the minima connecting the 4500 and the 5200 cm−1 peaks are illustrated to indicate the TT baseline correction procedure.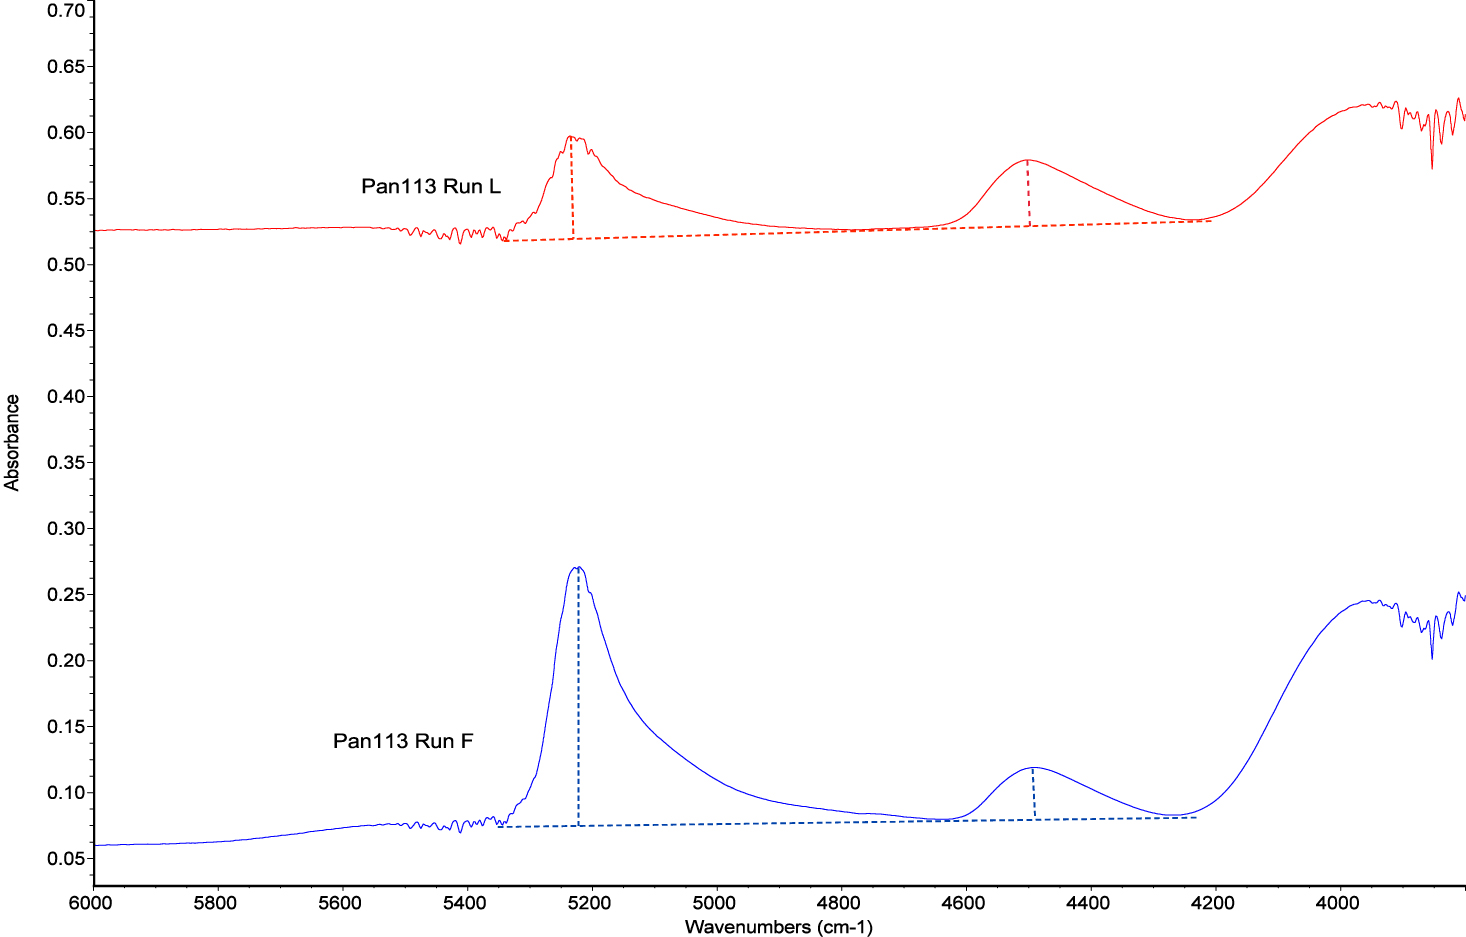
Knowing C (wt%) from KFT or EA, Equation (2) can be solved to determine the molar absorption coefficients by plotting the absorbance of 5200 and 4500 bands normalized to density, thickness and water content. Using a linear regression the intercepts on X and Y axes are the 𝜀4500 and 𝜀5200 values (Figure 5a,b). Molar absorption coefficients were calculated assuming a linear relationship between the water species concentration and intensities of IR spectra bands. We obtained, for trachytic glasses, absorption coefficients of 0.88 L∕mol⋅cm−1 (𝜀4500) and 1.6 L∕mol⋅cm−1 (𝜀5200) while for pantellerite glasses 𝜀4500 is 1.21 L∕mol⋅cm−1 and (𝜀5200) 1.89 L∕mol⋅cm−1. Molar absorption coefficients are calibrated for a melt water content ranging between 2.6 and 7.4 in trachytic glasses and between 2.6 and 5.8 for pantelleritic ones. Regarding the uncertainties on the thickness and density measures, we can consider that the epsilon values are affected by relative errors in the range 2–7%.
Resolution of Equation (2) in the text to obtain the molar absorptivity coefficient 𝜀4500 and 𝜀5200. Each point is calculated from Equation (2). Normalized absorbance obtained for (a) trachyte and (b) pantellerite.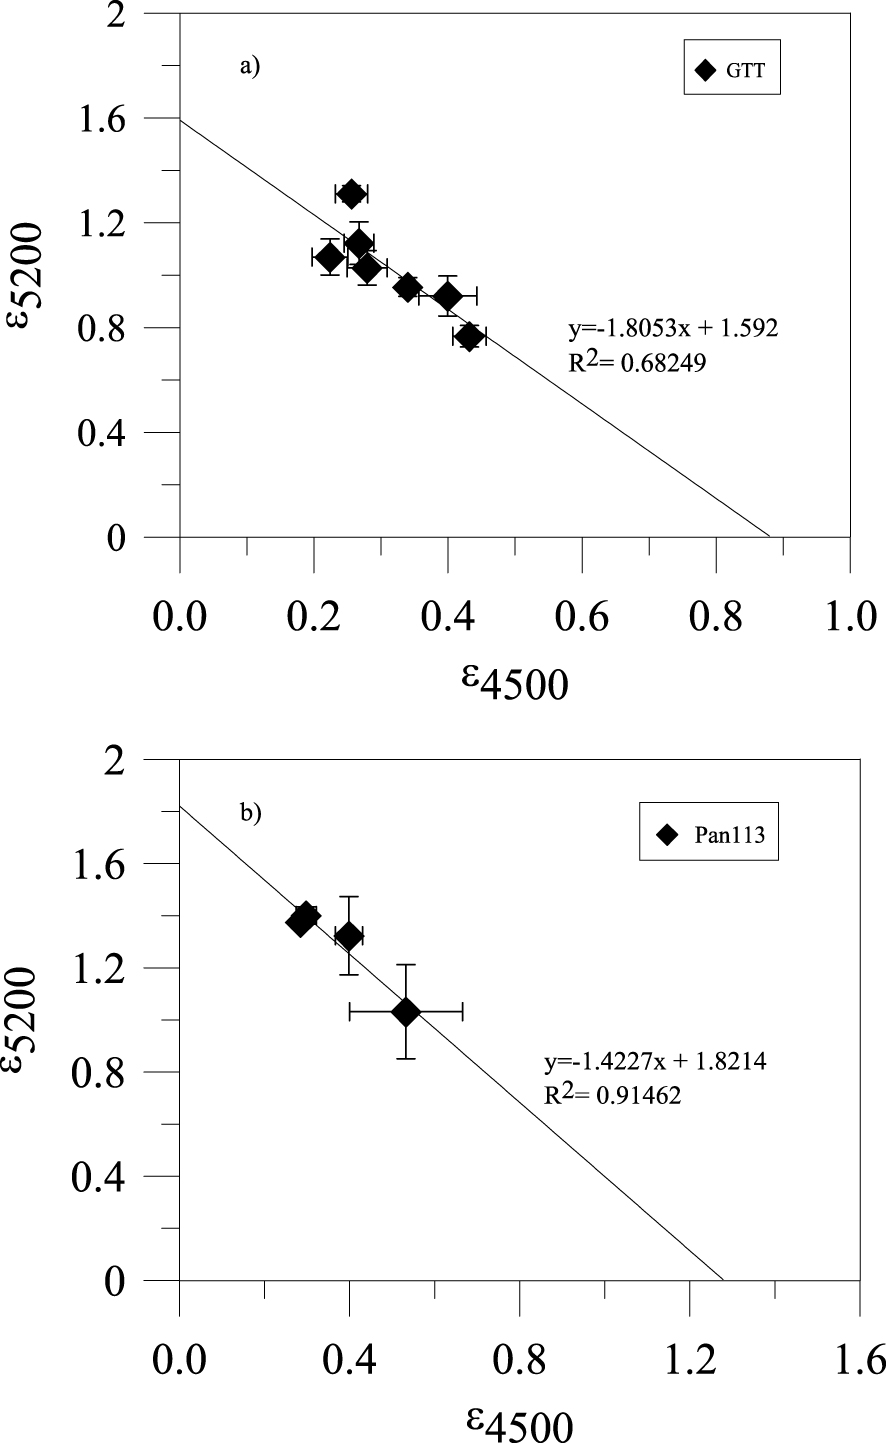
5. Discussion
5.1. Comparison with previous works
(i) Trachyte compositions. Di Matteo et al. [2004] and Fanara et al. [2015] presented solubility experiments on Campi Flegrei trachytes, obtained between 25 and 50 MPa (Figure 6a,b). Campi Flegrei trachytes are broadly similar in composition to Pantelleria trachytes, having a lower content in calcium, aluminium, potassium together with similar or slightly higher contents in silica, iron and sodium. Our solubility curve differs significantly from that of Di Matteo et al. [2004]. For instance, at 100 MPa the GTT melt has ∼1.2 wt% less H2O compared to the trend obtained by Di Matteo et al. [2004], the difference between the two sets of data increasing with pressure. Considering also the more mafic trachyte used by Di Matteo et al. [2004] (Pr38P), the difference in water content at 150 and 200 MPa is 0.94 to 1.6 wt% lower. Compared to the experimental results of Fanara et al. [2015], melt water contents in our experiments are 0.4 wt% to 0.7 wt% higher in the investigated pressure range (100–300 MPa). The relationship between water solubility and pressure can be also compared with the calculated water solubility models of Moore et al. [1998], Papale et al. [2006] and Ghiorso and Gualda [2015] using GTT and Pan113 as starting compositions. Calculated values with Papale et al. model are higher by 0.5 wt% to 1 wt%, depending on pressure, while Ghiorso and Gualda [2015]’s model calculates values that are higher by 0.3–0.7 wt% below 200 MPa, but at pressures >300 MPa the difference exceeds 1 wt%. On the contrary, Moore et al. [1998] matches better our experimental data, to within 0.1–0.4 wt% (Figure 6a).
Water contents solubilized in the melt as a function of pressure obtained in this study for trachyte and pantellerite compared with (a) Di Matteo et al. [2004], Fanara et al. [2015] experimental data and solubility models of Moore et al. [1998], Papale et al. [2006] and Ghiorso and Gualda [2015]. Experimental results on pantellerite compared with (b) Moore et al. [1998], Stabile et al. [2018] experimental data and solubility models of Moore et al. [1998], Papale et al. [2006] and Ghiorso and Gualda [2015].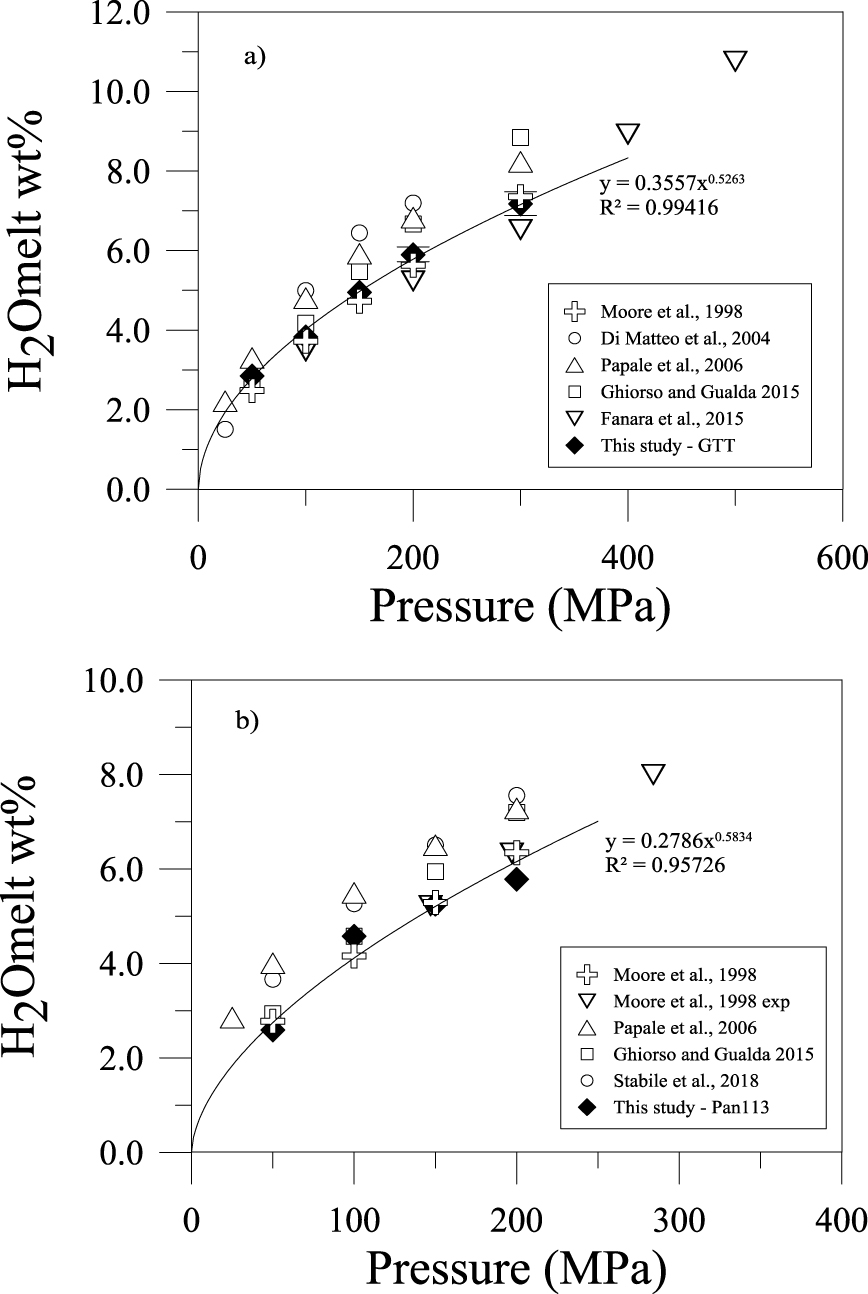
Chemical composition of trachyte [Di Matteo et al. 2004] and pantellerite [Moore et al. 1998; Stabile et al. 2018] used in other experimental studies
| Di Matteo et al. [2004] | Fanara et al. [2015] | This study | Moore et al. [1998] | Stabile et al. [2018] | This study | |
|---|---|---|---|---|---|---|
| ZAC | GTT | NZC-4 | Ebu-B | Pan 113 | ||
| SiO2 | 61.71 | 60.31 | 64.12 | 71.8 | 76.58 | 69.45 |
| TiO2 | 0.45 | 0.42 | 0.85 | 0.24 | 0.48 | |
| Al2O3 | 18.56 | 18.32 | 15.04 | 9.7 | 8.48 | 10.15 |
| FeO* | 3.17 | 5.21 | 6.27 | 5.77 | 5.48 | 7.87 |
| MnO | 0.27 | 0.27 | 0.14 | 0.21 | ||
| MgO | 0.23 | 1.31 | 0.62 | 0.01 | 0.02 | 0.1 |
| CaO | 1.64 | 4.11 | 1.48 | 0.2 | 0.23 | 0.53 |
| Na2O | 6.11 | 2.81 | 6.58 | 5.3 | 4.72 | 6.71 |
| K2O | 7.09 | 7.47 | 4.6 | 4.47 | 3.68 | 4.46 |
| P2O5 | 0.02 | 0.17 | 0.02 | 0.04 | ||
| Total | 99.25 | 100.08 | 100 | 97.6 | 99.2 | 100 |
| P.I. | 0.95 | 0.69 | 1.05 | 1.40 | 1.39 | 1.40 |
(ii) Pantellerite compositions. Our experimental results on pantelleritic melt can be compared with the recent experimental works of Stabile et al. [2018] and Moore et al. [1998]. The solubility curves show notable differences, the water content of our pantelleritic melt at 100 MPa being ∼1 wt% lower and up to ∼2 wt% lower at higher pressure relative to the data of Stabile et al. [2018]; our solubility data are very similar to the experimental results of Moore et al. [1998] at 150 and 200 MPa (Figure 6b) remembering that Stabile et al. data are based on synthetic pantellerite. The water solubility model of Papale et al. [2006] predicts water content higher than 1 wt% to 1.5 wt% than those of our experiments while considering the Ghiorso and Gualda [2015]’s model, the difference between the calculated solubility and the experimental data ranges between 0.2 wt% and 1.2 wt%. Overall, the model of Moore et al. [1998] better reproduces our experimental solubility data, these latter resulting lower by 0.1 to 0.5 wt% of the calculated ones. In contrast, the model of Papale et al. [2006] tends to overestimate significantly the melt water contents of our compositions.
(iii) The effect of small variations in bulk composition. To a first approximation, these differences in water solubility can be ascribed to small differences in chemical composition between the starting materials considered (Table 4). As stated previously, the dependence of water solubility in trachyte and pantelleritic melts with respect to small variation in chemical composition has not yet been fully investigated. For instance, the trachyte of this study has aluminium and potassium content almost 3 wt% lower with respect to the trachyte and trachy-phonolite of Di Matteo et al. [2004] and Fanara et al. [2015] which has a higher K/Na ratio (0.71 respect to 0.46 of GTT trachyte); on the contrary, the GTT trachyte has higher silica and iron contents. Considering pantelleritic composition [Moore et al. 1998; Stabile et al. 2018], the differences in water solubility are also related to slight differences in melt composition (Table 4). Our pantellerite and that of Moore et al. [1998] indeed present similar oxides concentration with respect to that of Stabile et al. [2018], which has lower iron, aluminium, sodium and higher silica content. Water solubility has been also shown to correlate positively with metal ionization potential and negatively with Al2O3 content [Behrens and Jantos 2001; Mysen 2002]. Di Matteo et al. [2004] and Stabile et al. [2018] explored the effect of alkalis on water solubility evidencing that for both trachyte and pantellerite melts, higher Na content favour H2O incorporation in the melt, in accord with other studies on silicic compositions [Holtz et al. 1995; Dingwell et al. 1997; Carroll and Blank 1997]. All these effects may explain the range in water contents obtained at the same P–T between the different sets of experiments. We note, however, that our comparison with previous experimental studies does not take into account the difference in experimental temperature, yet a clear relationship between temperature and water solubility has been evidenced for rhyolite [Yamashita 1999] and phonolite melts [Schmidt and Behrens 2008]. Such an effect still needs to be determined for peralkaline felsic compositions.
5.2. Effect of molar absorption coefficients
Total water content measured by elemental analyser (EA) and KFT versus water content obtained from FT–IR spectroscopy analysis for (a) trachyte and (b) pantellerite.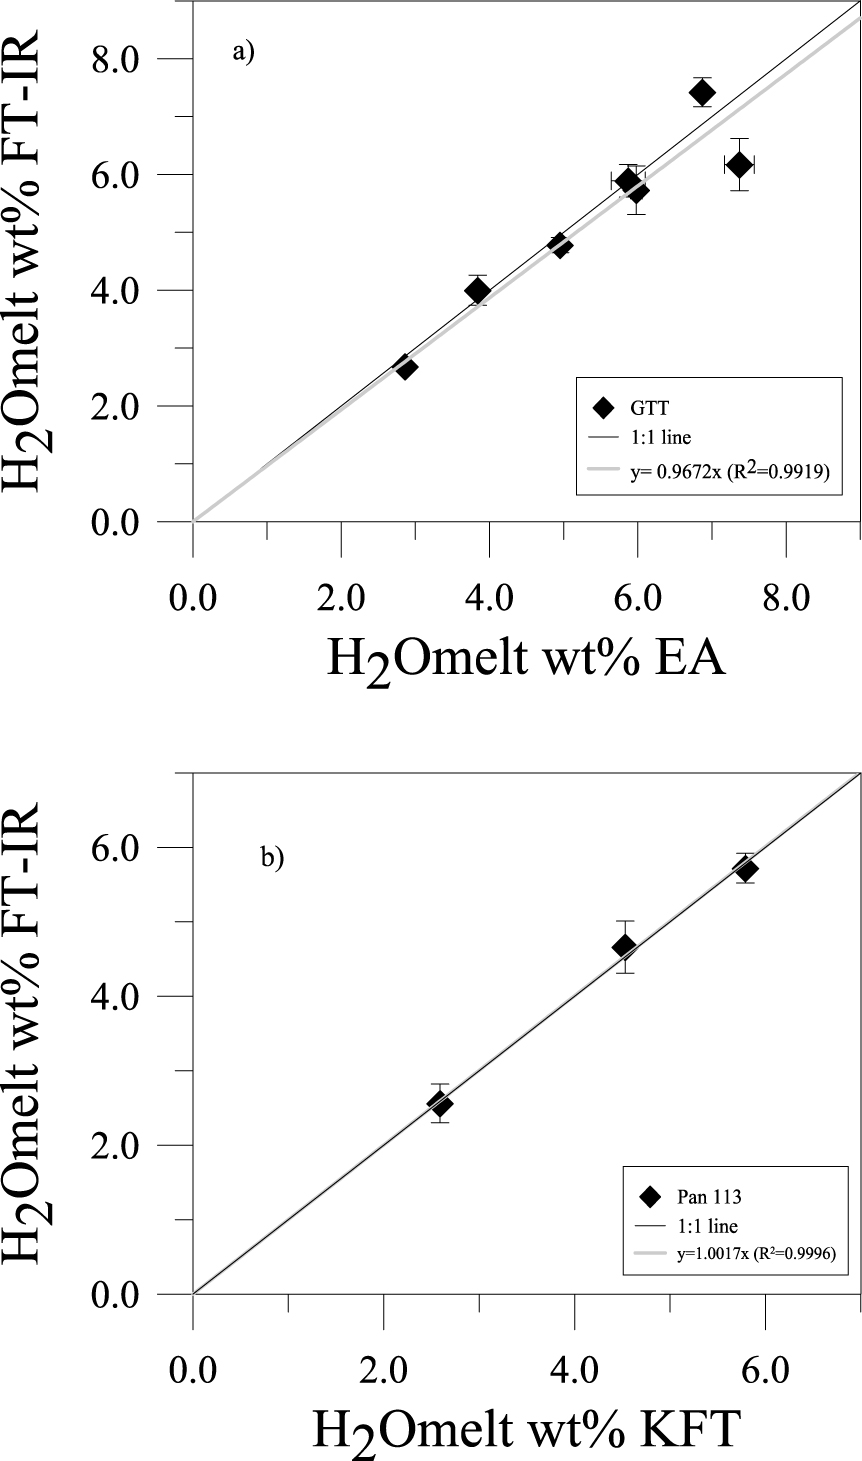
The molar absorption coefficients determined for our experimental glasses differ from those determined previously for trachytic by Di Matteo et al. [2004] and Fanara et al. [2015] and pantelleritic glasses by Stabile et al. [2020]. As stated above, molar absorption coefficients are determined assuming that they are constant over the range of water contents considered [Silver et al. 1990]. The general agreement between water contents obtained with EA (Figure 7a) and KFT (Figure 7b) versus the total water content obtained by FT–IR spectroscopy, using the calibrated absorption coefficients, supports such an assumption (Figure 7a,b). There is a general consensus on the fact that absorption coefficients are composition dependent. Dixon et al. [1995] evidenced that absorption coefficients (𝜀4500, 𝜀5200) correlate positively with the sum of cations Si and Al, suggesting that such a linear relationship can be used to calculate molar absorptivities of silicate melts. Other studies have shown a relation of 𝜀 with Na/K ratio, silica content and excess of aluminium [Stolper 1982; Silver et al. 1990; Behrens et al. 1996] while Ohlhorst et al. [2001] reported a systematic increase of absorption coefficients from basalt to rhyolite and proposed a parabolic equation to calculate 𝜀 as a function of silica content. The calculated absorption coefficients proposed for glasses having similar SiO2 content to our trachyte and pantellerite [Ohlhorst et al. 2001] are broadly similar to that determined in our study; yet, several authors [e.g. Dixon et al. 1995; Mandeville et al. 2002] suggest that a direct calibration for a specific composition yield to most accurate results. With respect to the published epsilon values on trachyte, we note that our epsilon values are 14–45% higher for 𝜀 (H2O) and 26–44% lower for 𝜀 (OH); for pantelleric glasses, 𝜀 (H2O) is 2% lower and 𝜀 (OH) is 20% higher with respect to the value of Stabile et al. [2020]. Anyway, we used the absorption coefficients obtained in the studies on experimental glasses of Di Matteo et al. [2004], Fanara et al. [2015] for trachyte and Stabile et al. [2020] for pantellerite (Table 5). Using the absorption coefficients obtained by Di Matteo et al. [2004] to determine the water content from our IR spectra decreases the retrieved values; for instance, at 100 MPa the melt water content decrease from 5 to 4.6, i.e. values are 8% lower. On the other hand, if our absorption coefficients are used on the data of Di Matteo et al. [2004], their water contents increase by 0.1–0.6 wt%. Doing the same exercise on pantelleritic glasses, and using the absorption coefficients of Stabile et al. [2020], the water content increase by 0.04–0.4 wt%. Using our absorption coefficients for the data of Stabile et al. [2020], the water content decrease by 0.2–0.5 wt%. Differences in absorption coefficients influence above all the estimation of water species that could reflect either an incorrect estimation of OH− relative to molecular species or the opposite. Taking as an example our results on pantellerite glasses, the OH/H2Om ratio increases from 0.07 to 0.2 when the absorption coefficients of Stabile et al. [2020] are used (i.e. 𝜀4500 is 0.98 L∕(mol⋅cm−1) instead of 1.21 L∕(mol⋅cm−1) as determined in our study).
Molar absorption coefficients for OH- and H2Om species for trachyte and pantellerite hydrous glasses
| SiO2 (wt%) | Al2O3 (wt%) | Na/Na+K | 𝜀 (OH) L∕mol⋅cm−1 | 𝜀 (H2O) L∕mol⋅cm−1 | |
|---|---|---|---|---|---|
| Trachyte | |||||
| This Study | 64.12 | 15.04 | 0.47 | 0.88 | 1.6 |
| Di Matteo et al. [2004] | 61.71 | 18.56 | 0.35 | 1.58 | 1.36 |
| Fanara et al. [2015] | 60.31 | 18.32 | 0.19 | 1.19 | 0.98 |
| Pantellerite | |||||
| This Study | 69.45 | 10.15 | 0.49 | 1.21 | 1.89 |
| Stabile et al. [2020] | 76.6 | 8.55 | 0.45 | 0.98 | 1.92 |
5.3. Water speciation
Water species concentration (OH− and H2Om) in the experimental glasses as a function of total water content are shown in Figure 8a,b, for trachyte and pantelleritic glasses. As already shown for other quenched hydrous glasses, the OH− group concentration is higher at low water content whereas molecular H2O dominates for water contents above ∼3 wt% [e.g. Stolper 1982; Xue and Kanzaki 2004; Dixon et al. 1995; Carroll and Blank 1997; Withers and Behrens 1999]. Our experimental glasses have water contents higher than 2.5 wt% so that we cannot appreciate the water speciation at low water concentrations. Anyway, it is evident in Figure 8a that the experimental glass with ∼2.5 wt% represents the point at which OH− and H2Om are present at equivalent concentrations. This appears less clear in the experimental glasses of pantelleritic composition, in which molecular water is slightly higher than OH− at total water contents around 2.5 wt%. However, the speciation model of Dixon et al. [1995] and the experimental results on water speciation seem to be in good agreement within errors. Molecular water and hydroxyl species proportion in the experimental glasses at room temperature may reflect the structural re-equilibration during quench; this leads to an increase of molecular H2O over hydroxyls with respect to the proportions at high temperature and pressure conditions [Silver et al. 1990; Zhang et al. 1995; Nowak and Behrens 1995; Carroll and Blank 1997]. For instance, Withers and Behrens [1999] investigated the effect of quenching on rhyolitic glasses containing 3 and 5 wt% H2O. Glasses with initial OH/H2O ratios of 1 and 0.6, after being reheated at 800 °C and at 300 MPa and rapidly quenched, showed a slight increase of their OH/H2O ratios (1.17 and 0.72, respectively); they inferred that effect of quenching rate on water speciation was relatively minor at that melt water content. This gives information on the apparent equilibrium temperature (Tae) [Zhang 1994, 1999] considered the equilibrium temperature corresponding to the final speciation. However, we do not have sufficient data to appreciate if such a conclusion equally applies to other melt water contents.
Water speciation in experimental glasses in (a) trachytic and (b) pantelleritic compositions. Grey dots are single point analysis while black ones represent the average values. Experimental data are compared with the model of Dixon et al. [1995].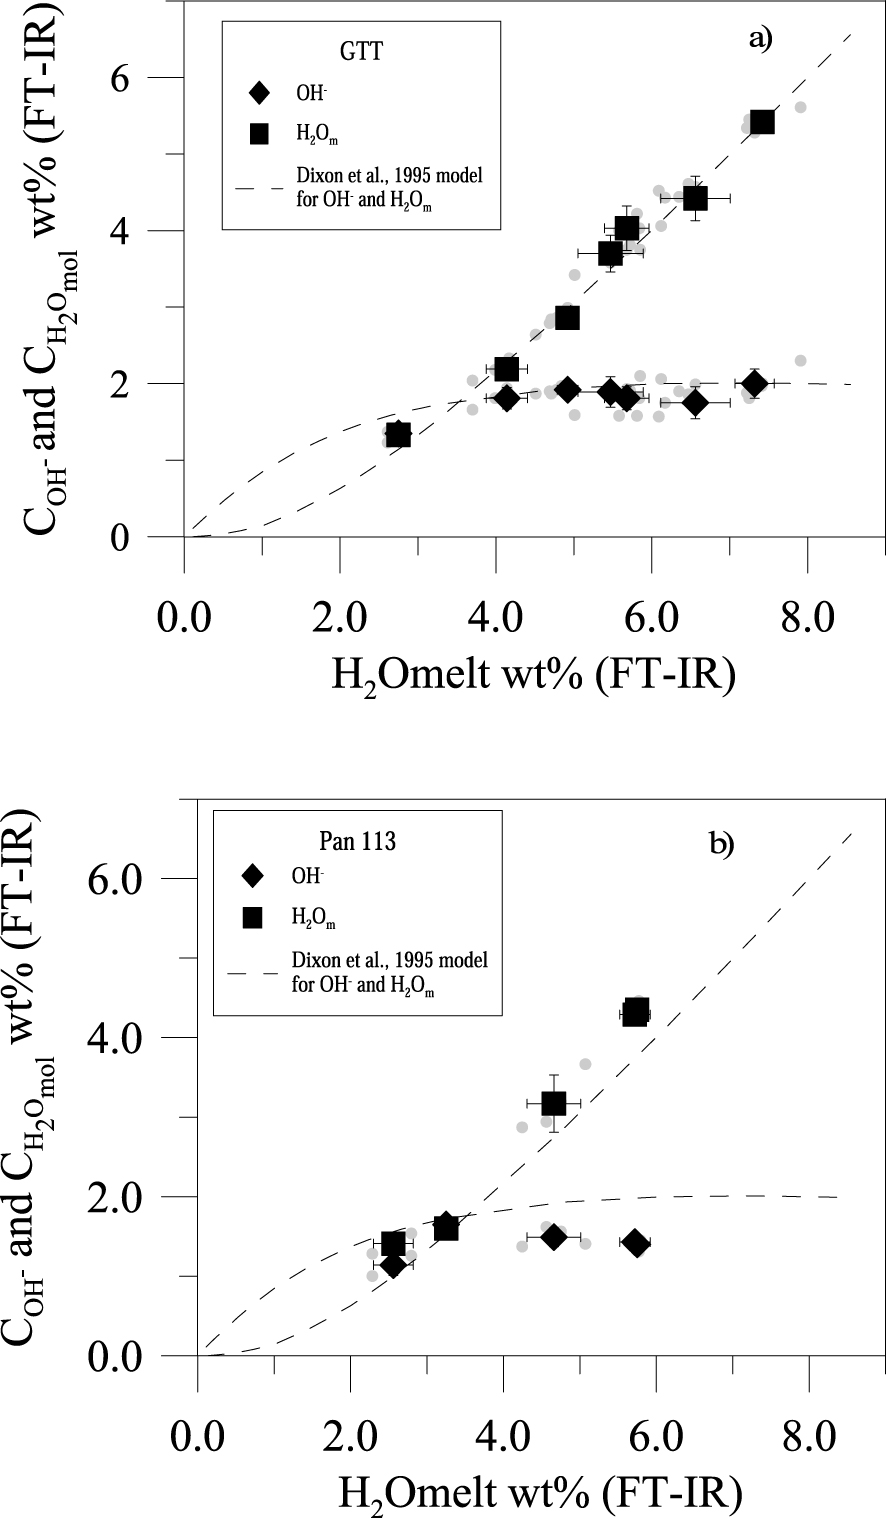
5.4. Volcanological implications
Trachyte and pantellerite of Pantelleria show a similar capability to solubilize water content in the melt. We note only a subtle difference between the two compositions, water content in pantellerites being slightly higher (but always <1 wt%) with respect to trachytes. As evidenced by several works performed on melt inclusions [Lanzo et al. 2013, and references therein], water contents characteristic of natural pantellerites of Pantelleria are in the range 2–4.9 wt%. To date, the difference in H2O content has not yet been related with changes in eruptive dynamic of pantelleritic products (lava flow, strombolian and sub-plinian eruptions). However, a part of water, other factors can play an important role in controlling the eruptive styles [Cassidy et al. 2018] as already identified for mafic volcanism in a typical basaltic volcano as Mt. Etna [Moretti et al. 2018, and reference therein]. The study of water solubility in silicate melts has several implications for the study of hydrous natural glasses (melt inclusions and glass matrices). Ideally, melt inclusion studies allow one to assess the pre-eruptive volatile content of a magma, which can be then used to infer the (minimum) entrapment pressure (i.e. storage conditions if entrapment occurs in the reservoir) considering adequate solubility models and absence of diffusion towards the host crystal, post entrapment crystallization, etc. In the case of Pantelleria, several recent studies have determined the volatile content of melt inclusions trapped in phenocrysts of trachytic and pantelleritic rocks [Neave et al. 2012; Lanzo et al. 2013; Romano et al. 2019] of some key explosive eruptions. The maximum water content measured in melt inclusion with pantelleritic composition was 4.5 wt% [Lanzo et al. 2013] while the water content estimated for trachytic melt through thermodynamical modelling and mass balance by White et al. [2009] ranges between 3.4 and 4 wt%. Romano et al. [2019] report water contents in melt inclusions of trachytic composition (0.15 to 1.05 wt%), suggesting that melt inclusions experienced volatile loss through the crystals. Considering 4 wt% of water dissolved in the trachytic melt, the protracted crystallization to generate a pantellerite liquid derivate [∼80% of crystallization; [White et al. 2009; Romano et al. 2018]] will lead to an excess of volatiles in the magmatic system and a consequent outgassing of volatiles, which could be the deep source of the diffusive degassing observed at Pantelleria nowadays.
Considering now the results of phase equilibria obtained on representative trachyte and pantellerite magmas, the magmatic felsic system of Pantelleria is inferred to evolve close to water saturation conditions, water and chlorine (during the late stage of evolution) being the dominant volatile species [Lanzo et al. 2013]. Evolution at volatile saturation conditions has been recently proposed for similar peralkaline magmatic systems elsewhere [Iddon and Edmonds 2020] with reservoirs located at pressures <200 MPa. Using the highest water content measured in trachytic and pantelleritic melt inclusions at Pantelleria (water is the main volatile component, with no detectable CO2), the model of Papale et al. [2006] gives storage pressures between 55 and 75 MPa for trachyte and pantellerite, respectively. Our experimental data constrain a pressure range between 70 and 110 MPa, or values which are 30% higher. Evolution of peralkaline felsic magmas in shallow reservoirs around 100 MPa is suggested by phase equilibrium and geophysical constraints [e.g. Di Carlo et al. 2010; Mattia et al. 2007]. Although such a difference might appear small, it corresponds to a difference of the top-depth of magma storage region (calculated assuming an average crustal density of 2600 kg⋅m−3) of ∼1 km. Underestimating by ∼1 km the depth of magma storage region in a shallow volcanic system such as Pantelleria might have important consequences with regard to volcanic hazard issues; for instance, it will affect the estimated travel time needed for the magma to breach the surface. The difference in solubilities may also affect the magma porosity evolution during magma ascent as simulated in numerical models, with an obvious impact on the explosive–effusive transition: the critical porosity of 70% beyond which fragmentation of an ascending magma might occur, will happen at deeper levels in a model using our solubility data instead of that of Di Matteo et al. [2004]. This underscores the importance of using accurate volatile solubility laws, hence the need to carry out specific hydrothermal experiments on representative compositions, if those laws are not available or if models are used too far from the compositional calibrated range.
6. Conclusions
This study was aimed at constraining the water solubility in trachyte and pantellerite melts from Pantelleria island. It is largely accepted that the solubility of water in silicate melt is composition-specific not only at the broad scale (silica-rich, silica-poor magmas) but also for variations in major element abundance within the same magma type (for instance, Pantelleria trachyte and Campi Flegrei trachyte). We thus performed this experimental study in order to add to the existing experimental data set on water solubility in felsic magmas, the missing data for trachytes straddling the chemical divide that separates metaluminous from peralkaline magmas. Our results place tighter constraints on water solubility-related arguments specific to eruptive phenomena (eruption style, pre-eruptive conditions, magmatic outgassing) but also on fundamental petrogenetic processes in which dissolved water plays a role (i.e. liquid line of descent oriented towards pantellerite melts).
Experiments were carried out in a pressure range 50–300 MPa in an IHPV, with only H2O as the sole volatile component. The FT–IR study of experimental glasses resulted in the definition of the following molar absorptivity coefficients 𝜀4500 = 0.88 L∕mol⋅cm−1 and 𝜀5200 = 1.6 L∕mol⋅cm−1 for trachyte and 𝜀4500 = 1.21 L∕mol⋅cm−1 and 𝜀5200 = 1.89 L∕mol⋅cm−1 for pantellerite glasses. Absorption coefficients are different from those estimated in other trachyte [Di Matteo et al. 2004; Fanara et al. 2015] or phonolite [Carroll and Blank 1997] melt compositions, and hence contribute to define an important composition-specific variable needed for FT–IR studies of such melt compositions.
Our experimental data were tested against the models of Moore et al. [1998], Papale et al. [2006] and Ghiorso and Gualda [2015]. The Papale et al. [2006] model overestimates the H2Omelt content for Na-rich magma, such as Pantelleria felsic magmas. This effect has significant implications when applied to the study of melt inclusions, whose volatile abundances are used to derive the depth of magma storage region. In the specific case of Pantelleria, trachyte and pantellerite storage pressure derived from the model of Papale et al. [2006] are about 50–70 MPa, for a dissolved H2O content in the range 3.4–4.5 wt%, which implies a magma storage depth of ∼2.4 km. Using our experimental solubility model the calculated depth increases to ∼3.5 km, a 30% difference, not trivial for such shallow magma bodies.
Acknowledgements
PR is deeply grateful for all the support received from the “MagmaTeam” of ISTO during the experimental work. IDC and JA acknowledge support from both LabEx VOLTAIRE (LABX-100-01) and EquipEx PLANEX (ANR-11-EQPX-0036) projects. The authors thank Paola Stabile and Michael R. Carroll for their thorough and helpful comments.