


 CC-BY 4.0
1. Introduction
Ice volume and glaciated surface area have drastically reduced [Vincent et al. 2017] during the 20th century, and projections indicate further decline during the 21st century [Zekollari et al. 2018]. Observed and projected change to the headwaters of mountain watersheds leads to complex perturbations of their hydrologic regime [Mackay et al. 2019] and downstream ecosystems [Canadell et al. 2019]. In that context, water and sediment flux in glaciated watersheds will display significant change. Sediment export from glaciated catchments is pivotal: it is likely to increase [Delaney and Adhikari 2020], modulates flood risk and reservoir sedimentation [Ehrbar et al. 2018], impacts river management [O’Briain 2019], and possibly inputs large amount of sediment to downstream systems.
Sediment export from glaciated catchments is best described by the paraglacial concept: a source-to-sink approach linking sediment export to climatic conditions inducing varying ice-coverage [Ballantyne 2002b]. Formally, “paraglacial” refers to processes and landforms conditioned by the antecedent presence of a glacier [Church and Ryder 1972; Ballantyne 2002a, b]. Conceptually, sediment is produced during cool, dry glaciation periods and exported during warmer, wetter inter-glacial periods. For example, the paraglacial response to the last glacial maximum led to a significant increase in sediment discharge in the Alps [Kellerer-Pirklbauer et al. 2010; Ravazzi et al. 2012], in British Columbia [Church and Ryder 1972; Kovanen and Slaymaker 2015], in the Cascade Range [Moon et al. 2015] and in the Teton Range [Larsen et al. 2016]. Similarly, there is ample evidence of ongoing paraglacial adjustment linked to more recent glacial retreat [Knight and Harrison 2014, 2018] with examples from Svalbard [Bourriquen et al. 2018], Iceland [Staines et al. 2014], the French Alps [Kirkbride and Deline 2018], the Swiss Alps [Curry et al. 2006; Eichel et al. 2018], the Austrian Alps [Savi et al. 2014; Avian et al. 2018], the Himalayas [Owen and Sharma 1998; Morin et al. 2018], Alaska [Klaar et al. 2014], and British Columbia [Leggat et al. 2015].
Importantly, the sediment signal from a glaciated catchment integrates processes of transport and production over three distinct geomorphic domains: (i) the supraglacial rockwalls, (ii) the ice-covered subglacial substratum, and (iii) the glacier forefront. Each of these geomorphic domains is defined by its position relative to the glacier and exhibits distinct geomorphic processes. Historically, discharge and sediment concentration measured at a distance downstream from glaciers served as a proxy to assess glacial erosion response [Baëff 1891; Boissier 1916; Rothlisberger and Lang 1987] as well as interactions between subglacial hydrology and sediment dynamics [Anderson et al. 2003; Riihimaki 2005]. In recent years, hydro-sedimentary records have increased in resolution [Guillon et al. 2018] and duration [Rainato et al. 2016; Morin et al. 2018], with longer duration records often accounting for sediment processes both beneath the glacier and in its vicinity [Micheletti et al. 2015; Lane et al. 2017]. However, since measuring erosion processes occurring beneath ice or at the active front of a glacier is difficult, the links between the sediment signal and subglacial processes remain largely unexplored from observational data [Jaeger and Koppes 2016].
In this study, to characterize sediment transfer and to document possible links with subglacial processes, we developed a data-driven heuristic approach based on data acquired in the Mont-Blanc Massif in the Bossons glacier catchment. This analysis adds to the growing body of literature documenting sediment activity in the forefront of retreating Alpine glaciers while unplanned observations provide field-based insights on the processes occurring beneath this glacier. In addition, we offer a counter-point to most existing observations by quantifying the sediment export from three distinct geomorphic domains. The core data of this study is an eight-year hydro-sedimentary record [Guillon et al. 2015b] which has not been accomplished in its entirety till date.
2. Study area and available datasets
The focus of this study is the iconic Bossons glacier flowing on the North face of Mont-Blanc from its summit (4810 m asl) to ∼1450 m asl (Figure 1). Such an elevation range leads to varied thermal conditions at the base of the glacier with the transition between areas of the glacier with cold and temperate basal ice occurring at ∼3300 m asl [Le Meur and Vincent 2006]. Above this Limit of Cold Ice (LCI), the basal ice is far from its melting point [Vincent et al. 2007] and erosion is proved to be negligible [Godon et al. 2013]. The limit between the ablation and accumulation area of the Bossons glacier, or Equilibrium Line Altitude (ELA), is ∼2750 m asl [Godon et al. 2013].
Map of the northward flowing Bossons Glacier in the North Face of Mont-Blanc. The Equilibrium Line Altitude (ELA), Limit of Cold Ice (LCI) and limits of subglacial watershed assessed by Godon et al. [2013] are reported. Surface ice velocities were derived for the year 2005 [Berthier et al. 2005].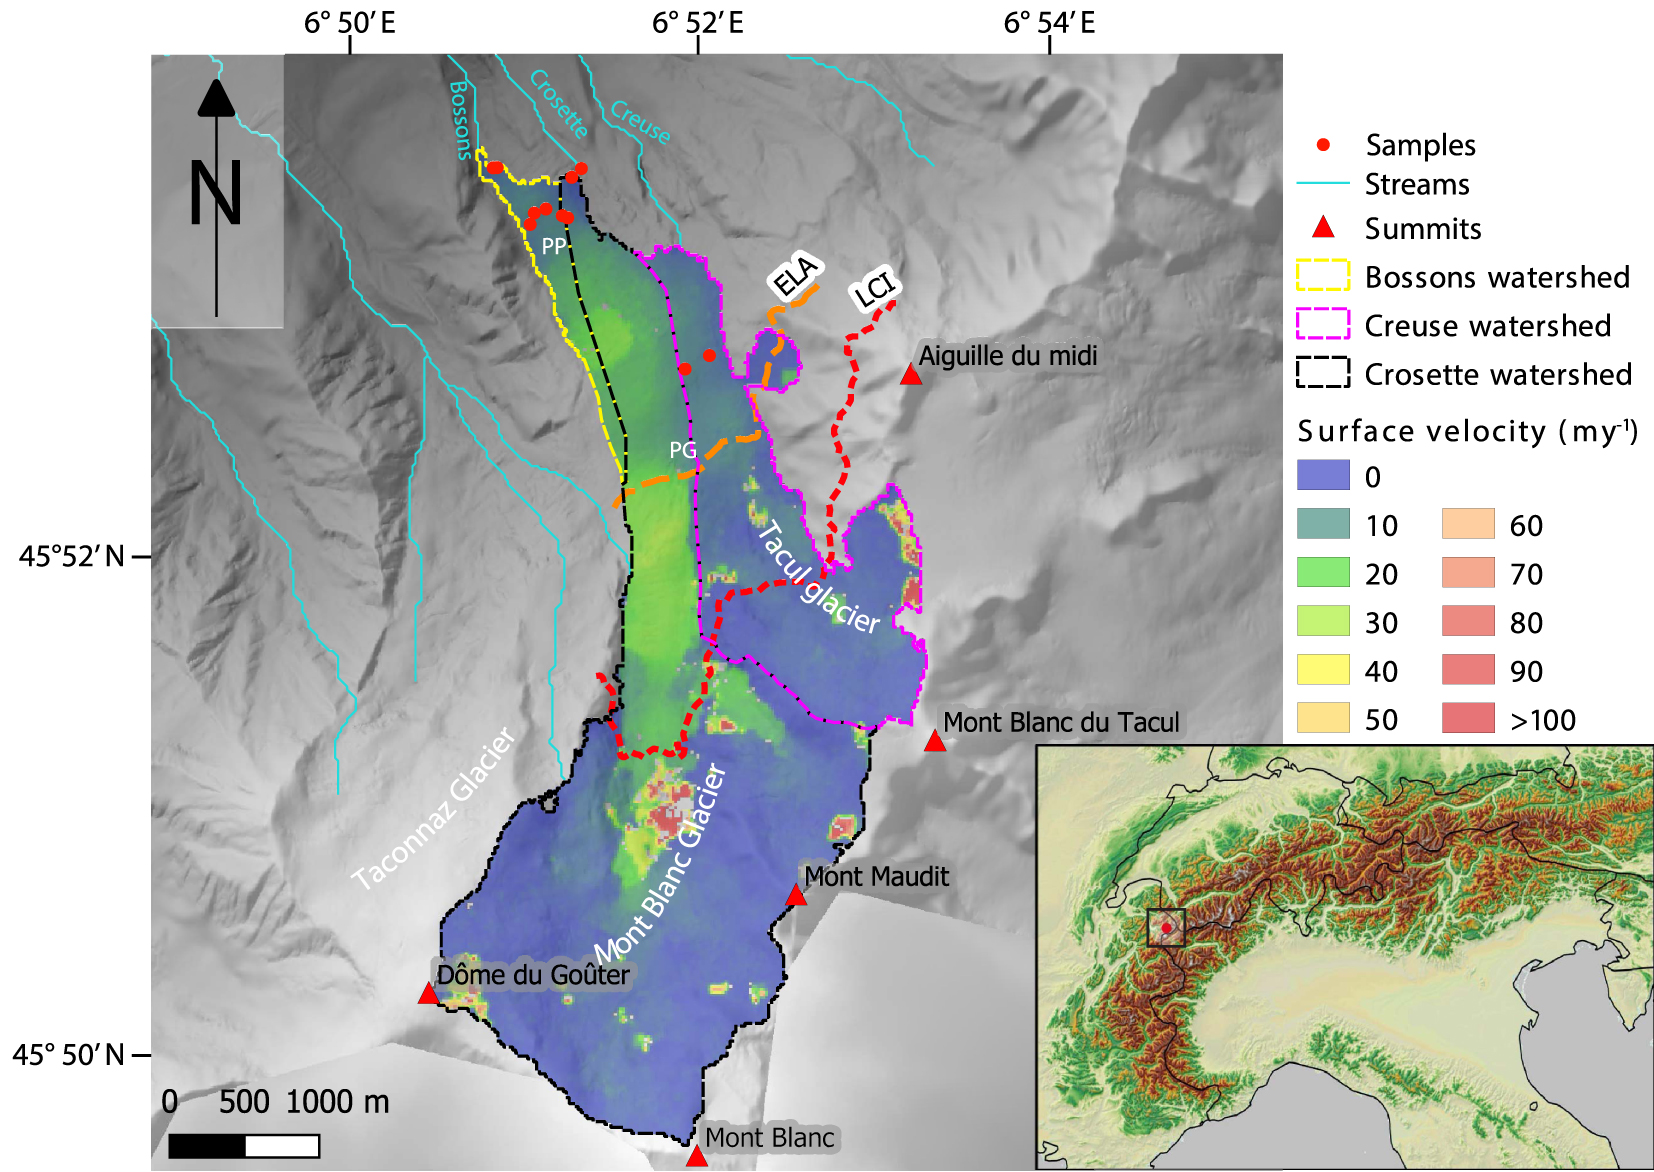
The glacial drainage system beneath the Bossons glacier has three main outlets: the Creuse stream, the Crosette stream, and the Bossons stream (Figure 1). The Creuse stream drains the Tacul glacier, a glacial tributary to the Bossons glacier, and its high elevation and difficult field conditions make it impossible to be reliably monitored. The Crosette stream drains most of the Bossons glacier up to Mont-Blanc summit, and its catchment includes both cold and temperate basal conditions. The Bossons stream drains the lowermost part of the Bossons glacier and its catchment lies both below the ELA and LCI (Figure 1).
Slope, surface velocity, and thickness vary along the long profile of the Bossons glacier. The Bossons glacier exhibits a steep average slope of ∼27°, and its surface is rugged and hummocky with sérac falls with slopes greater than 45°. The ablation area presents two flatter zones: Plan Glacier (PG) and Plateau des Pyramides (PP), at 2600 and 1800 m asl, respectively [Figure 1, Magnin et al. 2020]. Surface velocity and ice thickness were estimated for the Bossons glacier from a mass-balance and flow modeling approach [Huss and Farinotti 2012], and surface velocities were also derived from satellite imagery [Berthier et al. 2005; Fallourd et al. 2011]. Both estimates highlight that steeper and thinner areas flow faster than the flatter, thicker sections of Plan Glacier and Plateau des Pyramides (Figure 1).
Efforts to assess sediment origin and transport processes have been carried out in the Bossons glacier catchment since 2004 (Table 1), providing insights regarding the origin and transport of sediment in its glacial and proglacial domains. In the glacial domain, variations in the proportion of the supraglacial load transferred to the Crosette and Bossons streams were identified using lithological analysis [Godon et al. 2013] and cosmogenic nuclides content [Guillon et al. 2015a]. Cosmogenic nuclides result from interactions between minerals and cosmic rays and their concentration has two end-members: a negligibly-concentrated substratum shielded by ice and a highly-concentrated supraglacial load derived from exposed rockwalls. A mixture model between those two end-members estimated the fraction C of the sediment discharge from the glacier corresponding to supraglacial inputs [Guillon et al. 2015a]. This methodology was updated by Sarr et al. [2019] who demonstrated that the concentration of cosmogenic nuclides in supraglacial load is both independent from clast size and represents the long term erosion of the rockwalls when numerous (several tens or even hundreds) clasts are amalgamated in the measured sample.
Melt season and monitoring durations for each year
| Station | Year | Melt season duration (days) | Monitoring duration during the melt season (days) | Melt season monitored (%) | Total monitoring∗ duration (days) | Year monitored (%) |
|---|---|---|---|---|---|---|
| Bossons | 2009 | n/a | 52 | 28 | 52 | 14 |
| 2010 | n/a | 75 | 40 | 75 | 21 | |
| 2011 | 197 | 78 | 40 | 96 | 26 | |
| 2012 | 183 | 93 | 51 | 148 | 41 | |
| 2013 | 157 | 71 | 45 | 109 | 30 | |
| 2014 | 205 | 136 | 66 | 136 | 37 | |
| 2015 | 212 | 117 | 55 | 137 | 38 | |
| 2016 | 171 | 142 | 83 | 171 | 47 | |
| Crosette | 2013 | 157 | 74 | 47 | 98 | 27 |
| 2014 | 171 | 105 | 61 | 191 | 52 | |
| 2016 | 85 | 85 | 100 | 170 | 47 |
∗This represents the total duration of data used for flux calculation; the length of the recorded discharge is longer and allows for identification of melt season initiation.
In the proglacial domain, the analysis of digital elevation models and of the position of ∼1000 radio-frequency-tagged particles over three years indicated a decennial transit time for coarse particles [Guillon et al. 2015c; Guillon 2016]. In addition, direct sampling of bedload under various flow conditions suggested that bedload is a minor component of the sediment flux [Godon et al. 2014]. Because of such a slow and limited export of coarse particles, the remainder of this study is limited to suspended sediment; the bedload component is likely to be contained within the uncertainty of the values presented. Analysis of suspended load measurements acquired in multiple points of the glacial catchment highlighted that the glacier is the dominant source of suspended sediment during the melt season [Guillon et al. 2018]. Furthermore, the proglacial alluvial plain acts as a buffer, storing sediments until the transport capacity allows for exporting either during high discharge events linked to precipitation or when the sediment concentration from the glacier drops at the end of the melt season [Guillon et al. 2018]. Datasets collected in the Bossons glacier catchment were made publicly available [Godon et al. 2014; Guillon et al. 2015b, c], and this study is the first to make use of the entire eight-year hydro-sedimentary record. Finally, the glacial retreat was evaluated by the National Observation Service GLACIOCLIM (SNO/INSU) hosted at the Observatoire des Sciences de l’Univers de Grenoble.
3. Estimating sediment input by geomorphic domains with a data-driven heuristic approach
A data-driven heuristic approach translated findings from previous research into an actionable model to estimate the annual sediment input from the supraglacial, subglacial and proglacial domains (Figure 2, Table 2). This three-step approach estimated: (i) the combined input from the supraglacial and subglacial domains, Mgla; (ii) the distinct inputs from the supraglacial and subglacial domains, Msup and Msub, respectively; and (iii) the sediment input of the proglacial domain, Mpro. Sediment input has unit of mass and was derived by integrating the sediment flux (discharge × concentration) with respect to time.
Data framework in Bossons glacier catchment. Stars represent sampling locations.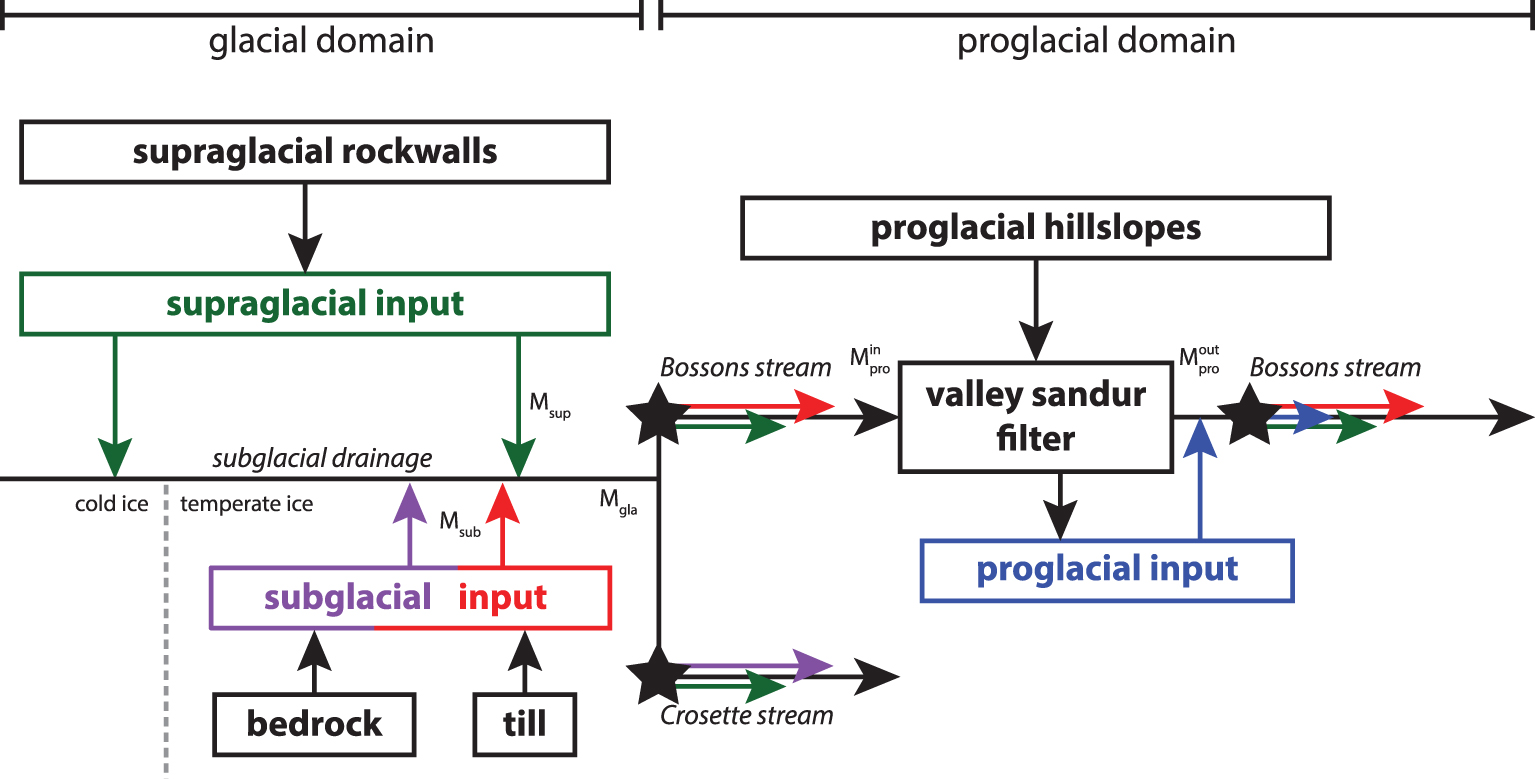
Parameter values
| Parameter | Description | Value |
|---|---|---|
| Mgla | Combined input from supraglacial and subglacial domains | - |
| Msup | Input from the supraglacial domain | - |
| Msub | Input from the subglacial domain | - |
| Mpro | Input from the proglacial domain | - |
| Mass entering the proglacial buffer | - | |
| Mass exiting the proglacial buffer | - | |
| 𝜏 | Meltseason duration | - |
| R | Rainfall | - |
| C(Bossons) | Supraglacial to subglacial input ratio of Bossons stream (-) | 0.089 ± 0.025 |
| C(Crosette) | Supraglacial to subglacial input ratio of Crosette stream (-) | 0.018 ± 0.0075 |
| p | Supraglacial load proportion exiting at Bossons (-) | 0.83 ± 0.34 |
All hydro-sedimentary parameters obtained from Guillon et al. [2015b].
First, during the time period corresponding to the melt season 𝜏, the input from the entire glacial system Mgla = Msup + Msub was expressed as a function of rainfall R and mass entering and exiting the proglacial alluvial buffer, and , respectively:
| (1) |
Since, at the annual timescale, during dry periods, the sediment mass originating from the glacier is equivalent to the mass exiting the alluvial area [Guillon et al. 2018]:
| (2) |
The mass of sediment entering the proglacial system during rain events was approximated using a simple statistical model leveraging data acquired simultaneously upstream and downstream of the alluvial area (See Appendix A).
Second, updating the mixing model from Guillon et al. [2015a] with additional measurements from Sarr et al. [2019], the respective input from supraglacial and subglacial domains (Table B1) was estimated from the fraction C of the glacial sediment discharge corresponding to supraglacial inputs:
| (3) |
| (4) |
| (5) |
| (6) |
| (7) |
Third, the sediment input from the proglacial area Mpro was expressed as the sediment export during wet periods of the melt season and outside of the melt season.
| (8) |
The annual sediment input from the supraglacial, subglacial and proglacial domains was augmented by analyzing cumulative export and glacial front position. As the glacier is the dominant source of sediment during periods without precipitation [Guillon et al. 2018], analyzing the cumulative sediment export estimates the sediment response from the glacial domain. Finally, to estimate the impact of glacial retreat on sediment flux, subglacial sediment export was correlated with the glacial retreat.
4. Results
In this section, we report the main results of this study: (i) the intensity of the sediment export is different between the three geomorphic domains; (ii) export of the subglacial sediment occurs during characteristic periods; and (iii) sediment flux correlates positively with glacial retreat.
Our data-driven heuristic approach estimated the sediment budget for the Bossons glacier catchment in three distinct geomorphic domains: the supraglacial rockwalls, the ice-covered substratum, and the proglacial area (Figure 3). The intensity of the annual sediment export was derived for each geomorphic domains (Table 3) from the exported sediment mass (Tables C1–C2). For the proglacial domain, high values of the sediment export occurred in 2009 and 2010, and most likely in 2015 and 2016—based on the total export from the catchment. The high 2015–2016 values are directly linked to an observed extreme event affecting the proglacial hillslopes [Guillon et al. 2018]. Such a link is unclear for years 2009 and 2010 which exhibit improbable outliers during rain events. Then, excluding years 2009–2010 and 2015–2016 yields a conservative estimate of the average proglacial sediment flux, 22 ± 16 × 103 kg⋅yr−1. In the subglacial domain drained by the Crosette stream, the 2013–2014 sediment fluxes were higher than 300 × 103 kg⋅yr−1 while the value for 2016 was much lower, 41 ± 8 × 10³ kg⋅yr−1. Similarly, in the subglacial domain drained by the Bossons stream, the sediment fluxes were highly variable, ranging from 58 ± 18 × 103 kg⋅yr−1 to 266 ± 47 × 103 kg⋅yr−1. Excluding the estimate from 2011 which corresponds to a limited sampling of the melt-season leads to an average value of 194 ± 48 × 103 kg⋅yr−1 for the subglacial sediment flux in the Bossons stream catchment. In the supraglacial domain, sediment flux appears relatively low and constant with a mean value of 20 ± 7 × 10³ kg⋅yr−1.
Annual sediment export by geomorphic domain of the Bossons glacier catchment. Weighted average for each geomorphic domain are displayed at the right. Between 2009 and 2010, the data were at best acquired with a hourly time step. Since 2011, data were acquired with a 2-min time step.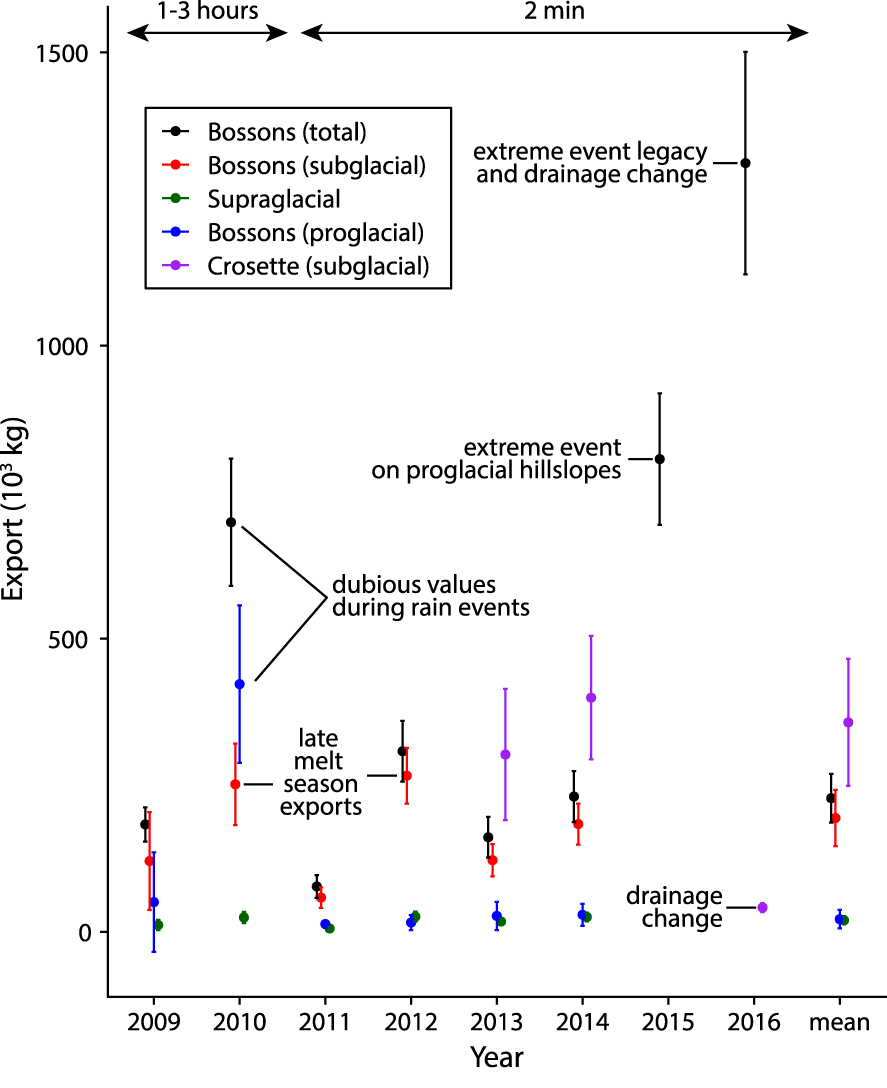
Sediment flux and average sediment flux by year and by domain
| Year | Sediment flux (103 kg⋅yr−1) | Meltwater volume (106 m3) | |||||
|---|---|---|---|---|---|---|---|
| Bossons (total) | Bossons (subglacial) | Supraglacial | Bossons (proglacial) | Crosette (subglacial) | Bossons | Crosette | |
| 2009 | 183 ± 29 | 121 ± 83 | 12 ± 9 | 51 ± 85∗ | n/a | n/a | n/a |
| 2010 | 699 ± 109 | 252 ± 69 | 24 ± 10 | 423 ± 134∗ | n/a | n/a | n/a |
| 2011 | 77 ± 20 | 58 ± 18∗ | 6 ± 2 | 13 ± 6 | n/a | 0.88 | n/a |
| 2012 | 308 ± 52 | 266 ± 47 | 26 ± 8 | 16 ± 13 | n/a | 1.1 | n/a |
| 2013 | 161 ± 35 | 122 ± 27 | 17 ± 6 | 27 ± 24 | 302 ± 112 | 0.98 | 8.2 |
| 2014 | 231 ± 44 | 184 ± 35 | 25 ± 7 | 29 ± 19 | 399 ± 105 | 0.83 | 3.8 |
| 2015 | 806 ± 112 | n/a | n/a | n/a | n/a | 1.7 | n/a |
| 2016 | 1311 ± 190 | n/a | n/a | n/a | 41 ± 8∗ | 1.2 | 0.45 |
| Weighted mean | 228 ± 42 | 194 ± 48 | 20 ± 7 | 22 ± 16 | 357 ± 108 | ||
Meltwater volume was derived for years with high resolution data by integrating discharge from mid-June to mid-September.
∗This value has been excluded from the mean estimate.
The eight-year-long observation record in the Bossons glacier catchment provides an avenue to understand the variation observed in subglacial sediment fluxes. Such an inter-annual variation (Figure 3) appears to be linked to an intra-annual variation of the sediment export (Figure 4a). Focusing on sediment discharge from the glacier only, we present the cumulative sediment export during the periods without precipitations of the melt-season from 2009 to 2010 and from 2012 to 2014. The change of slope of this cumulative export indicates distinct events. The melt-season usually starts with a limited export until a marked step occurs. For the years 2013–2014, such an initial export is more gradual. Most years, after this initial step, the melt season cumulative export presents a steady slope. Notwithstanding, from late July to September 2012, a drastic change in the slope of the cumulative export indicates the continuous export of a significant amount of sediment from the system. While less prominent than this 2012 late season export, a similar event happened from mid-August to mid-September 2014 and a short-lived export occurred in late August 2010. Interestingly, such events are uncorrelated with a change in discharge (Figure 4b) which weakly predicts sediment export (Figure C1).
(a) Cumulative export during dry periods of suspended load for Bossons stream for 2009, 2010, 2012, 2013 and 2014. (b) Discharge during year 2012. Note the lack of increased discharge when sediment export increases in August 2012.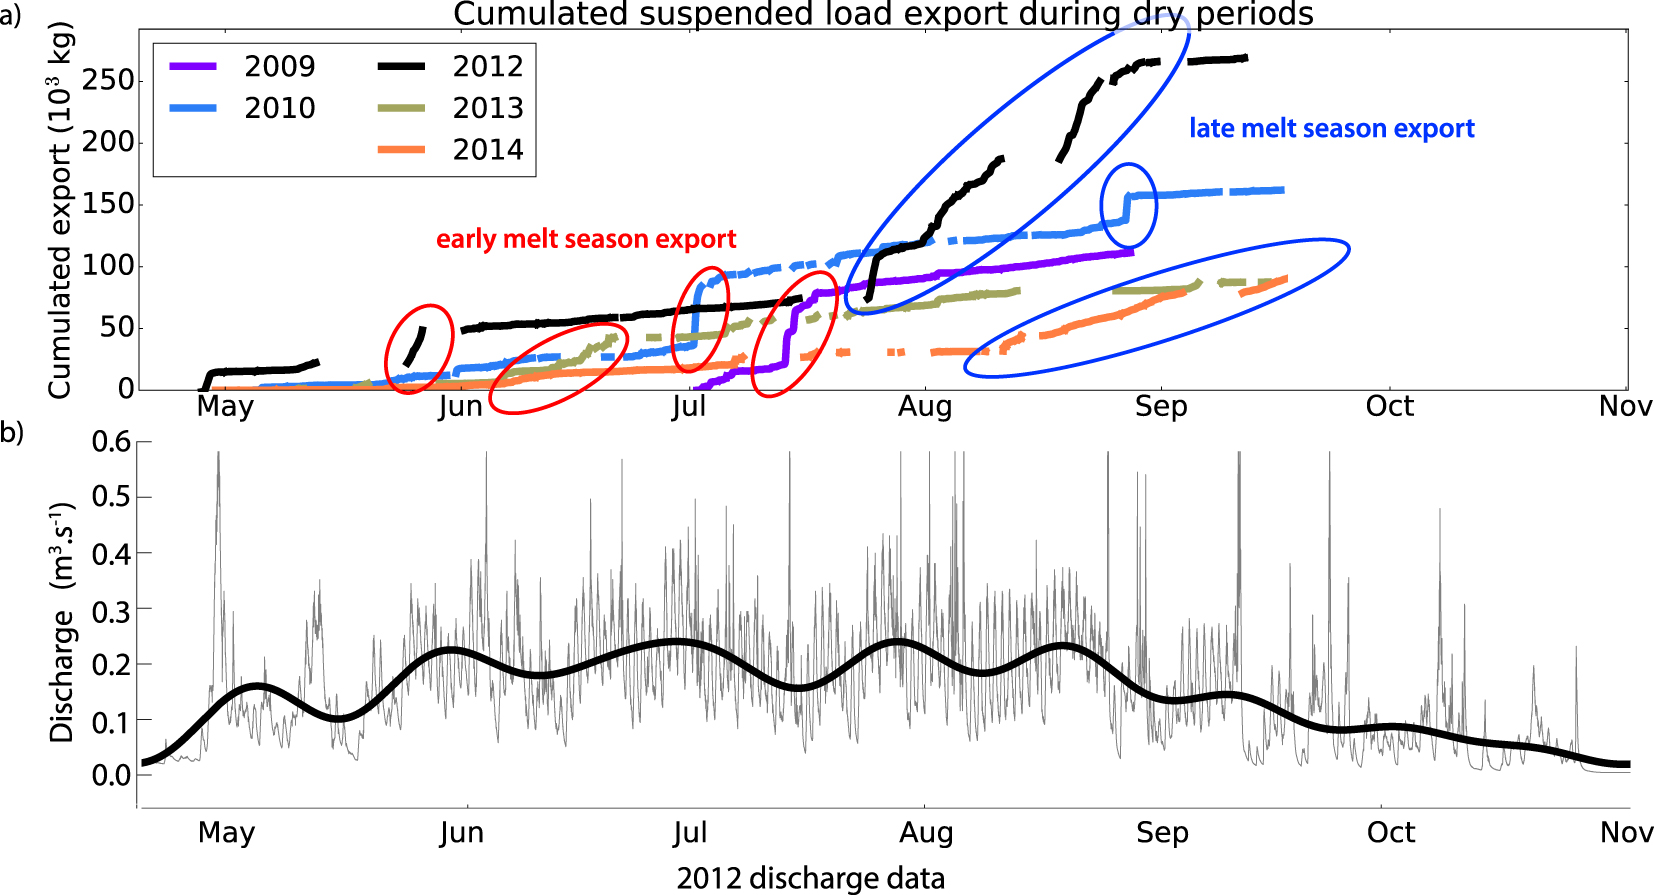
Subglacial sediment fluxes in the Bossons stream catchment appears to be correlated with glacial front retreat (Figure 5). Glacial front retreat is here measured positively in the direction of the retreat (i.e. upstream from a reference position). The linear relationship between subglacial sediment flux and the annual retreat of the glacier is significant (R2 = 0.98, t-test’s p-value ≪0). While such a correlation is impacted by the limited number of observations, the form of the linear fit summarizes insights gained from studying the cumulative sediment exports (Figure 4). The linear model expresses the subglacial sediment flux Msub as a function of the retreat r: Msub = 158 + 1.6 r. This relationship suggests, in the absence of glacial front retreat, a base sediment flux of ∼150 × 103 kg⋅yr−1, and implies an increase of the sediment export when the glacial front retreats.
Relation between subglacial sediment flux and glacial front retreat. The amount of Bossons glacier’s retreat was evaluated by GlacioClim at the Observatoire des Sciences de l’Univers de Grenoble. The 95% confidence interval is represented by the gray area.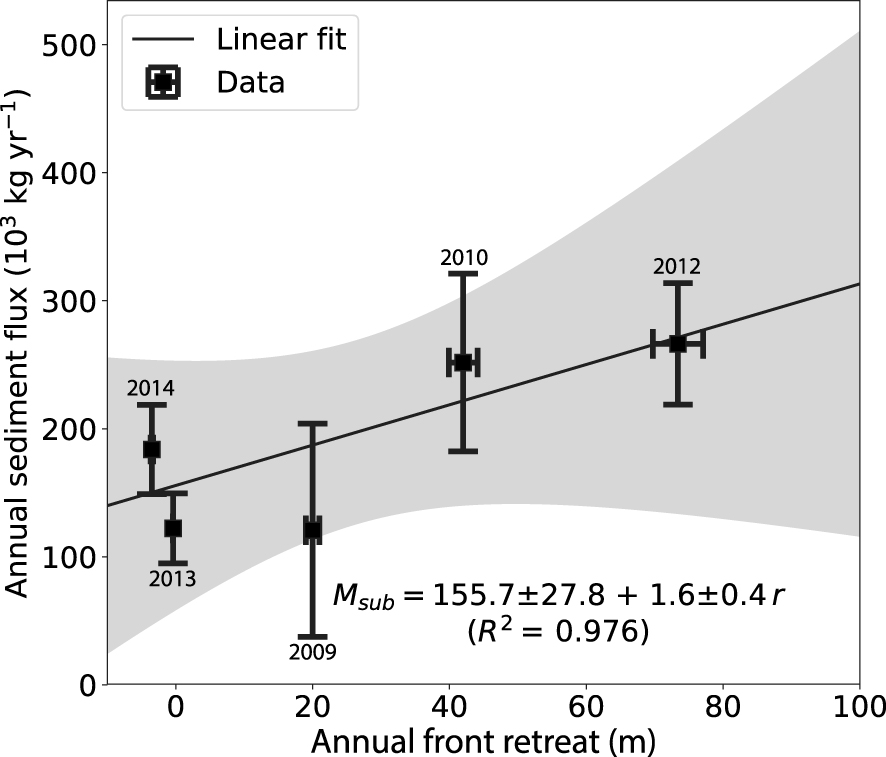
5. Discussion
In this section, we discuss the main implications of our observations: (i) variations in the subglacial drainage development induce spatio-temporal variations in subglacial sediment export; and (ii) the present-day sediment signal in a glaciated catchment is a signal with multiple frequencies and intermittent dampening.
5.1. Variations in subglacial drainage induce variations in subglacial sediment export
Previous research has documented and linked seasonal variations in water discharge with the evolution of the glacial drainage system. The annual cycle of water discharge from a glacier starts with a quiescent winter phase ending with the first major glacial flood [Rothlisberger and Lang 1987]. This so-called spring event corresponds to the initiation of the melt season which ultimately wanes and reaches a new dormant winter phase. In addition to melt rate, the modulation of the amplitude and frequency of the daily glacial floods is tied to the competition between two types of subglacial drainage: a non-dendritic, disconnected, diffuse network, and a dendritic, connected, channelized network [Fountain and Walder 1998, Figure 6a,b]. The start of the melt season marks the transition from diffuse to channelized network and progressive fragmentation of the channelized drainage system late in the meltseason participates in decreasing runoff [Rada and Schoof 2018].
Schematic of different configurations of the subglacial drainage system of Bossons glacier. (a) Diffuse drainage systems in both catchments (e.g. during winter); (b–d) dendritic drainage systems (e.g. during summer and autumn) evolving from one year to the other: (b) well developed in Crosette subglacial catchment, modestly developed in Bossons subglacial catchment; (c) dendritic drainage systems, moderately developed in Crosette subglacial catchment, less developed in Bossons subglacial catchment and reaching subglacial sediment stocks; (d) dendritic drainage systems, minimal in Crosette subglacial catchment, maximal in Bossons subglacial catchment with capture of the upper part of the subglacial drainage catchment.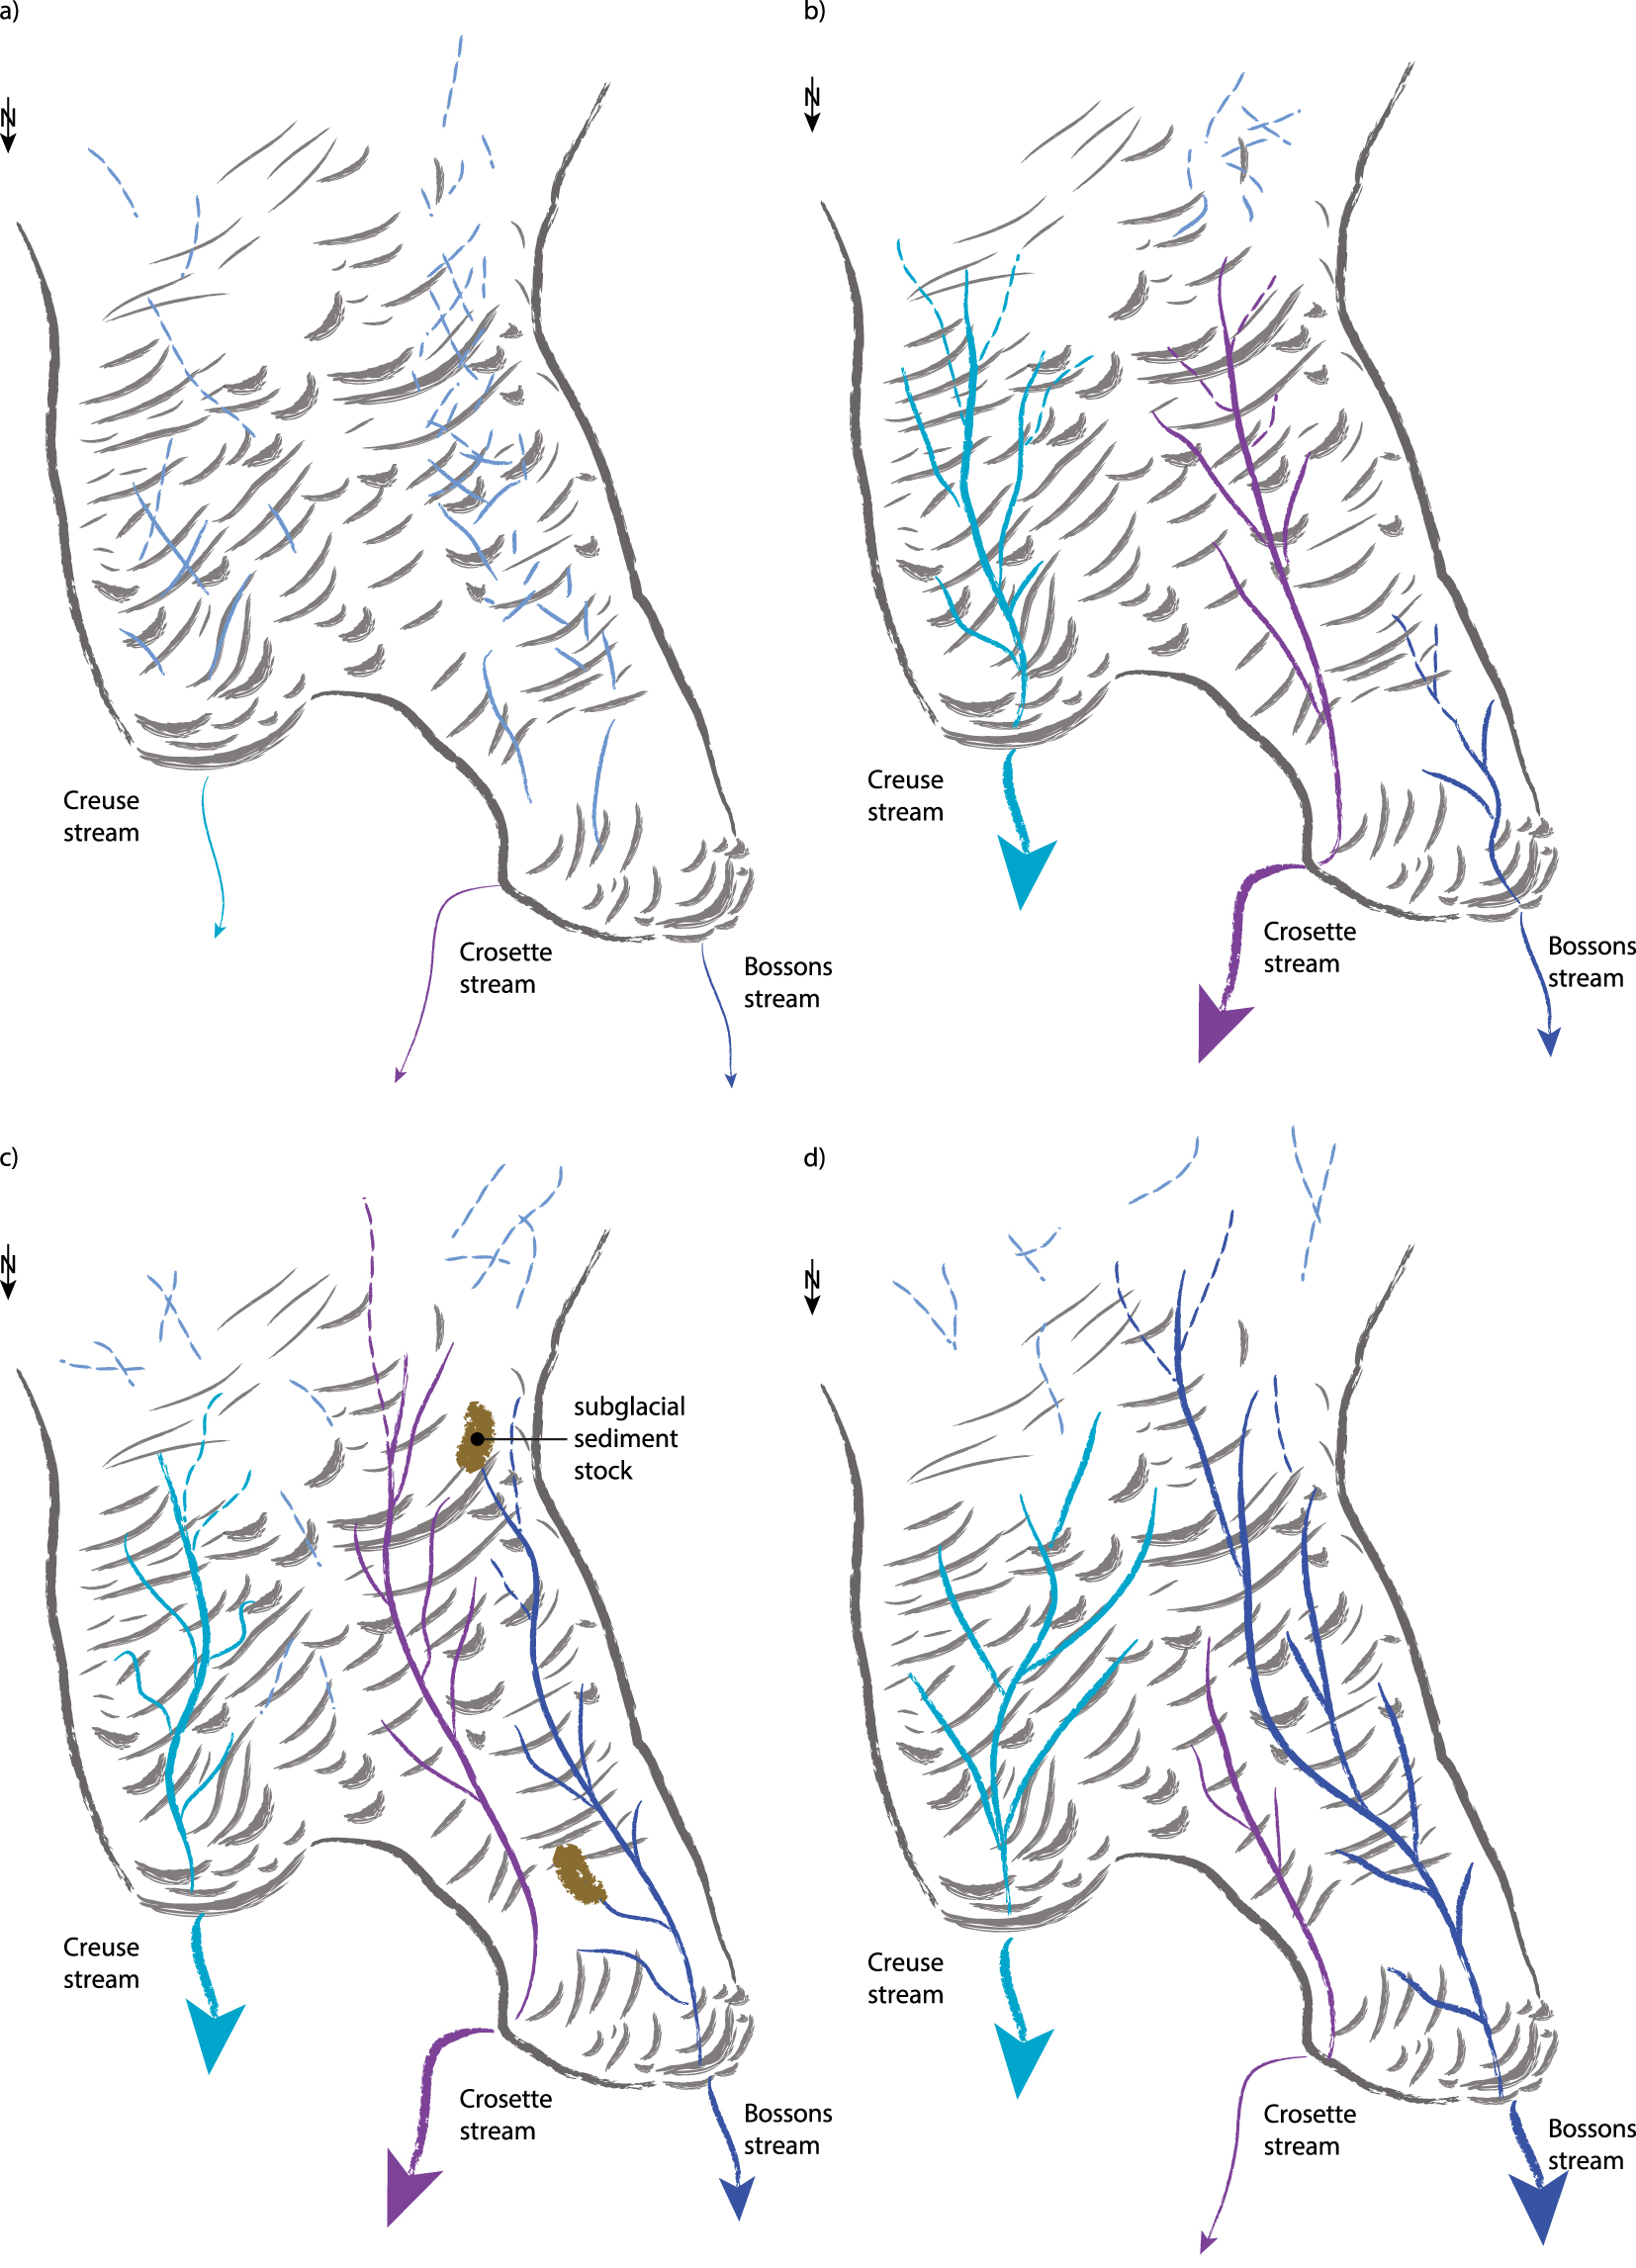
This seasonal evolution of the subglacial drainage system impacts subglacial sediment production and transport. Subglacial sediment production occurs through two main processes: abrasion and quarrying. Abrasion, the sand-paper-like action of the basal ice on its substratum, is mainly dependent on the sliding velocity and subglacial water pressure [Hallet 1979, 1981]. In particular, basal water pressure induces a partial decoupling from the bed, promoting higher sliding velocities and higher abrasion [e.g., Iken and Bindschadler 1986; Bartholomaus et al. 2008]. Quarrying is equally controlled by variation in basal water pressure, which progressively weakens and ultimately plucks portions of the substratum [Iverson 2012]. Such fluctuations in basal water pressure occur daily and at the season scale [Nanni et al. 2020]. For example, during spring, the initiation of the melt season in a still developing drainage system increases meltwater pressure and leads to accelerated sliding and abrasion [Ugelvig et al. 2018]. Increasing meltwater pressure, sliding, or abrasion may also occur later in the melt season, if the drainage system is unable to efficiently accommodate meltwater. Anderson et al. [2003] documented for example a short-lived sliding event linked to a glacial flood. In contrast with abrasion peaking in spring, quarrying correlates with shorter-term transient increases of the deviatoric stress in the bedrock which occur mostly late in the melt season when water pressure reduces in a well-developed drainage system [Ugelvig et al. 2018].
As for production, subglacial sediment transport is linked to the seasonal evolution of the subglacial drainage system. The diffuse drainage system is associated with low sediment export while the channelized drainage system leads to higher sediment export [Swift et al. 2002]. Furthermore, diffuse and channelized systems are end-member descriptions and, more generally, the pressurization of the drainage system impacts its transport capacity [Beaud et al. 2018]. In consequence, the initiation of the melt season is associated with a sediment pulse corresponding to the export of a winter sediment stock [Riihimaki 2005]. The sediment export then decreases progressively over the course of the melt season [Guillon et al. 2018]. Yet, the development of the channelized drainage may reach subglacial sediment pockets leading to their subsequent evacuation [Anderson et al. 2003].
The hydro-sedimentary response from the Bossons stream exemplifies these seasonal changes in subglacial hydro-sedimentary response. Conforming to early season spring events flushing winter sediment stock, the cumulative sediment export exhibits a marked increase at the start of most melt seasons (Figure 4). In addition, distinct export events occurred also late in the melt season of years 2010, 2012 and 2014. However, the timing and duration of these exports rule out a dependence on short-lived acceleration of the glacier [Anderson et al. 2003] or on increased quarrying [Ugelvig et al. 2018]. In particular, it is unlikely that increased quarrying leads to such a rapid response in terms of suspended sediment exported from the glacial system. Rather, these exports strongly suggest the existence of a pluri-annual sediment stock beneath the Bossons glacier, only accessed some years, and which export is controlled by the development of the subglacial drainage system (Figure 6c).
Comparing the sediment export from the Crosette and Bossons streams underlines a major shift in drainage pattern at the scale of the entire glacial system, re-routing meltwater previously exiting at the Crosette outlet to Bossons outlet (Figures 3, 6d). While the subglacial sediment export from the Crosette stream drastically decreases between years 2013–2014 and year 2016, the Bossons stream total export records its highest value in 2016. This 2016 export compounds inputs from the supraglacial, subglacial, and proglacial domains, and is likely heavily impacted by the legacy of an extreme event that occurred in 2015 on proglacial hillslopes. Nonetheless, the drastic difference in sediment exports of the Crosette and Bossons streams between years 2013–2014 and year 2016 indicates a significant shift in the entire drainage system beneath the Bossons glacier. This is further supported by the observation of increased meltwater volumes for the Bossons stream and decreased meltwater volumes for the Crosette stream over the same time period (Table 3). In addition, the varying total meltwater volume suggests further change in meltwater routing, potentially with temporary storage beneath the glacier as evidenced in the Creuse catchment [Berthet 2016].
Observations within the Bossons glacier catchment and previous literature suggest causes for the fluctuations in subglacial drainage evidenced from hydro-sedimentary measurements. The subglacial drainage system beneath the Bossons glacier is likely dependent on subglacial topography and melt rate. First, the subglacial topography of the area drained by Bossons stream is probably hummocky considering the steepness of its terminal part as well as the ruggedness of most of its supraglacial topography. Such rugosity is conducive of a stochastic development of the subglacial drainage and of the temporary storage of sediment, especially in the thinner terminal part of the glacier [Beaud et al. 2018]. Furthermore, the terminal part of the Bossons glacier catchment is constituted by the flatter Plateau des Pyramides (PP, Figure 1). The substratum beneath this area is likely over-deepened which may feedback into sediment storage [Magnin et al. 2020]. Second, transfer from meltwater to the base of the glacier has been evidenced on the Bossons glacier [Guillon et al. 2015a] and may stimulate the development of the drainage network. Such a transfer might explain the correlation evidenced between glacial retreat and sediment export (Figure 5). Our observations indicate that an important glacial retreat is the manifestation of high ablation rate that likely invigorates the development of the glacial drainage system, increasing its likelihood to reach subglacial sediment pockets (Figure 6).
5.2. A synoptic view of the modern day sediment response in a glaciated catchment
Unexpectedly, the dominant source of the sediment export from the Bossons catchment is the glacial system, and in particular subglacial sediment (Figure 3). This contrasts with numerous studies linking the dominant export of small scale [Leggat et al. 2015; Rainato et al. 2016] and large scale systems [Staines et al. 2014; Hinderer et al. 2013; Morin et al. 2018; Bourriquen et al. 2018] with recently exposed surfaces being impacted by extreme events [Rainato et al. 2016; Morin et al. 2018] while transitioning from gullying to solifluction to stabilisation [Eichel et al. 2018].
Nonetheless, the sediment conveyor belt in the proglacial domain is efficiently jammed by the stability of hillslopes [Micheletti et al. 2015] and by sediment buffers in the alluvial area or on slopes [Lane et al. 2017; Guillon et al. 2018; Kirkbride and Deline 2018]. These discontinuities highlight both the importance of connectivity in glaciated environments [Cossart and Fressard 2017; Kirkbride and Deline 2018] and of the timescale of the paraglacial response. While the dominant source was previously evidenced in the Bossons catchment [Guillon et al. 2018], these authors’ data corresponds to only one melt-season. The present study strengthens previous findings by leveraging an eight-year hydro-sedimentary record, and separating the glacial contributions between subglacial and supraglacial sources.
Combining findings from previous research, an eight-year hydro-sedimentary record, and sediment source identification shows that the present-day sediment response in the Bossons catchment has distinct components with characteristic timescales, controls, and intermediate storage. In the lowermost part of the catchment corresponding to the proglacial area, the sediment flux is low compared to the subglacial sediment flux (Figure 3) and appears mainly controlled by the occurrence of extreme events [Guillon et al. 2018]. In addition, at the daily, seasonal and annual scales, the proglacial alluvial area acts as a buffer controlled by the transport capacity of the stream [Guillon et al. 2018]. Within this proglacial fluvial environment, the transit time of the coarse fraction is thought to be ∼10 years [Guillon 2016; Guillon et al. 2015c]. Beneath the Bossons glacier, the evacuation of the subglacial erosion products is mainly determined by the development of the drainage network, flushing out annual and pluri-annual sediment pockets (Figure 6). In the uppermost part of the catchment, rockwalls provide supraglacial debris, a fraction of which is transferred at the bottom of the glacier [Guillon et al. 2015a]. However, the low supraglacial sediment flux we report is indicative of the long-term (millennium scale) erosion of the sidewalls [Sarr et al. 2019] delayed by the multi-decennial supraglacial, englacial and subglacial transport and is unlikely to fully represent modern conditions.
The sediment discharge from the Bossons catchment is a signal with multiple frequencies and intermittent dampening. Regardless of the dominant erosion processes occurring in a catchment—here, subglacial erosion—the first-order control on glaciated sediment export is climate change [Knight and Harrison 2014]. The general response of landscapes to long-term climatic perturbation has been conceptualized as a signal with multiple frequencies and a degree of dampening describing reactive and buffered landscapes, respectively [Allen 2005]. In addition, optimal conditions for the frequency of the climate forcing maximize erosion amplitude [Godard et al. 2013]. In the Bossons catchment, the present-day climate forcing optimally drives an efficient reaction in terms of subglacial processes while proglacial erosion has already reacted to the perturbation and is now buffered. With the notable exception of Knight and Harrison [2018], this nuanced synoptic view is missing from conceptualizations of present-day paraglacial response, is likely to help organizing the existing hydro-sedimentary records and solidifies the need for continuous hydro-sedimentary measurements. In particular, the lack of long-term spatially-distributed high-resolution observations of present-day sediment flux limits the ongoing scientific debate regarding the scaling between subglacial erosion processes and glacier dynamics [e.g., Koppes et al. 2015; Cook et al. 2020] relying so far on a mostly disparate combination of data with few notable exceptions [Herman et al. 2015]. Finally, clearly inferring subglacial sediment processes from hydro-sedimentary data, and comparing findings between observational and modelling studies is hindered by known unknowns to be ideally derived concomitantly with sediment fluxes: surface velocities, extent and type of subglacial drainage, and conditions at the ice-substratum interface (thermal regime, hardness, basal stress, debris concentration).
6. Conclusion
The ongoing glacial retreat perturbs the hydrologic regime and ecosystems of Alpine watersheds. In that context, understanding the interactions between glacier flow, meltwater and sediment export from glaciated catchments is critical. In the present study, to document subglacial sediment processes and further the comprehension of the sediment response to climate change, we developed a data-driven heuristic approach of the sediment transfers based on an eight-year hydro-sedimentary record of a glaciated catchment in the Mont-Blanc Massif. Our results highlight that, in the studied catchment and at first order, drainage development controls sediment evacuation. In addition, the main geomorphic domains defined by the proglacial area, the supraglacial rockwalls and the ice-covered substratum exhibit distinct intermediate storage and sediment exports. In that system, the buffered proglacial landscape is a minor component of the total export and reacts weakly to present-day glacial retreat. Conversely, enhanced glacial retreat in link with higher melt rate allows for exporting a pluri-annual sediment stock stored beneath the glacier. These findings nuance previous studies which mainly underlined the dominant role of paraglacial dynamics in the glacier forefront and calls for long-term high-resolution observations of present-day sediment flux from glaciated catchments. Organizing and analyzing such existing and warranted hydro-sedimentary records will benefit from describing present-day sediment response as a signal with multiple frequencies and intermittent dampening.
Conflicts of interest
The authors declare no competing financial interest.
Dedication
The manuscript was written with contributions from all authors. All authors have given approval to the final version of the manuscript.
Acknowledgments
This study was supported by Agence Nationale de la Recherche projects no. ANR-08-BLAN-0303-01 “Erosion and Relief Development in the Western Alps” and no. ANR-14-CE03-0006 “VIP—Mont-Blanc”. We thank MeteoFrance for permission to use their meteorological data through the partnership between OSUG and MeteoFrance. We are indebted to Alexandre Pohl, Bastien Goupy, Mathieu Viry, Cécile Godon and others who helped carry out the intensive fieldwork. We thank Matthias Huss and Étienne Berthier for answering our questions regarding their datasets and methods. Glacial retreat data are available at https://glacioclim.osug.fr. ISTerre is part of Labex OSUG@2020 (ANR10 LABX56).
Appendix A. Monte-Carlo simulation of sediment flux
Observations in the challenging environment of the high Alpine mountains often have data gaps. In a previous study, missing data in Bossons catchment were estimated using multi-linear models combining measurements at three stations [Guillon et al. 2018]: one at Crosette outlet and two in Bossons catchment, upstream and downstream from the proglacial alluvial area. However, the dataset from Crosette stream catchment has a shorter duration than the one acquired in Bossons stream catchment (Table 1), and an alternative method was needed to estimate the sediment flux entering the proglacial alluvial area. This was needed to estimate the sediment flux during the rain events of the melt season, when a significant portion of the export is contributed by the proglacial domain. However, because of the complexity of the steep, multi-threaded proglacial stream, a simple one-dimensional hydraulic model was unable to produce satisfactory results [Guillon 2016]. Furthermore, the same discharge impulse has vastly different response in terms of concentration (Figure A1). In the following, as simple process-based modeling fails, we described the dynamics of the alluvial area at the season scale with a simple statistical model.
Suspended sediment concentration and discharge upstream and downstream from Bossons proglacial alluvial area during the rain events of 2013 meltseason. Data are grouped by weeks from the start (purple) to the end of the melt season (red). Data are dispersed and a given discharge induces a concentration response across multiple order of magnitude.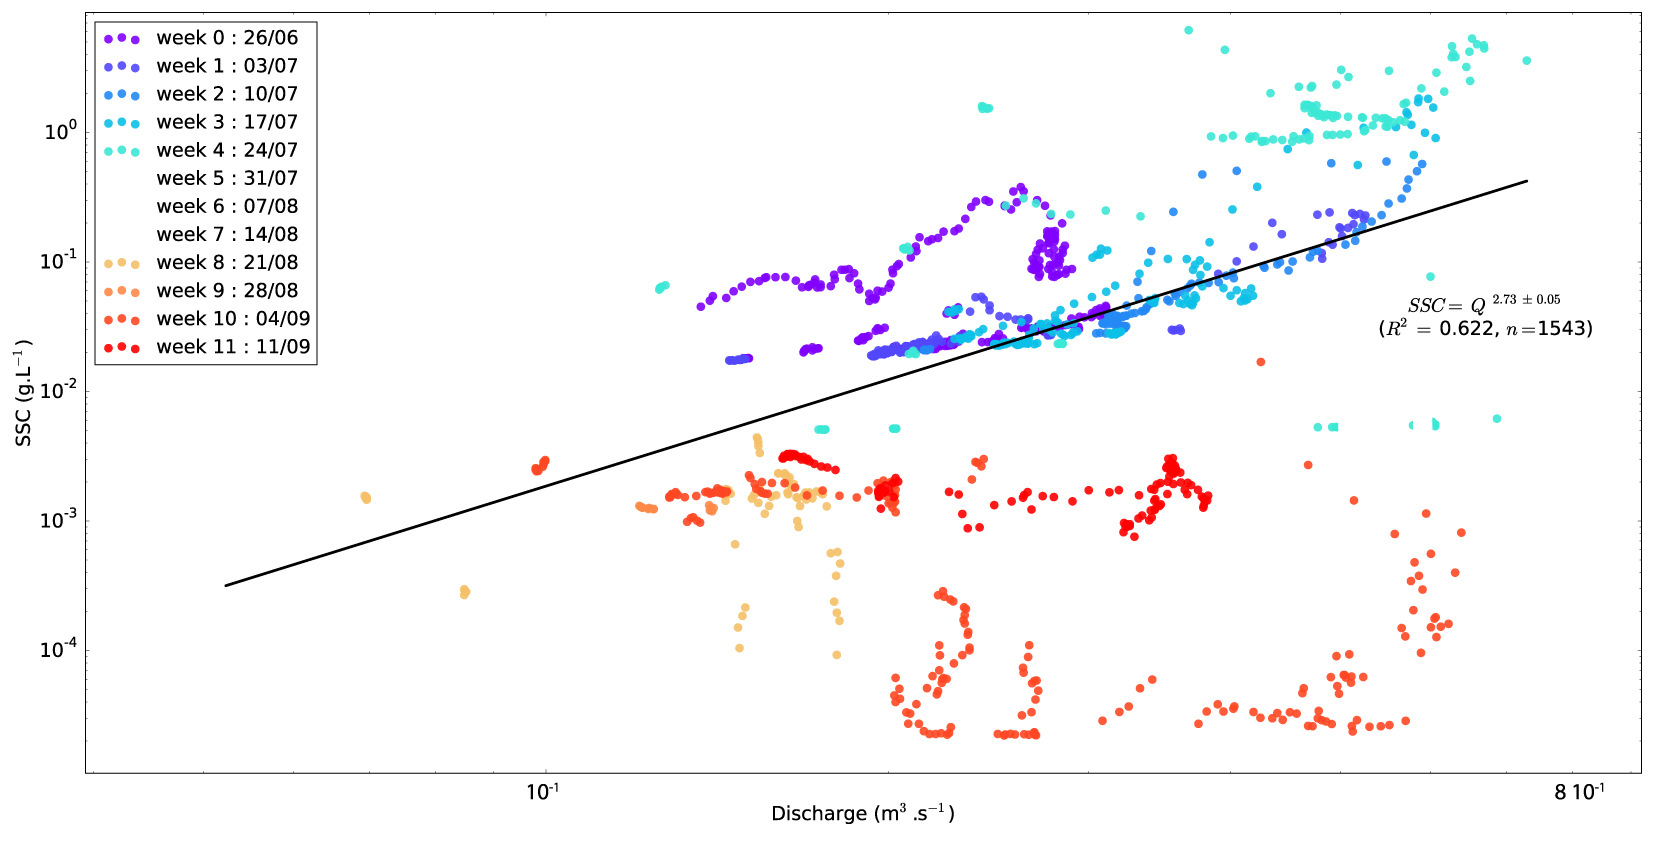
A simple statistical framework identified a parameter describing the dynamics of the alluvial area at the seasonal scale, then performed statistical modeling with Monte-Carlo simulations. Observations of the proglacial dynamics [Guillon et al. 2018] underlined a dependence between discharge, Q, and the order of magnitude of the ratio of upstream and downstream sediment flux, Fin and Fout respectively (Figure A2). We define this ratio between the sediment flux entering and exiting the proglacial alluvial area as 𝛼 = Fin∕Fout. If 𝛼 < 1 (Fin < Fout), the proglacial area contributes sediment; if 𝛼 > 1 (Fin > Fout), part of the sediment flux is trapped in the proglacial area. To account for the dependence with discharge and for the order of magnitude, the logarithm of 𝛼 was normalized by the discharge, Q, defining a discharge independent logarithmic ratio:
| (A9) |
Evolution of flux ratio 𝛼 (entering flux/exiting flux) (blue) and discharge (red). (a–c) during dry periods; (b–d) during precipitation periods; (a,b) At the season scale; (c,d) At the daily scale. Note the logarithmic scale.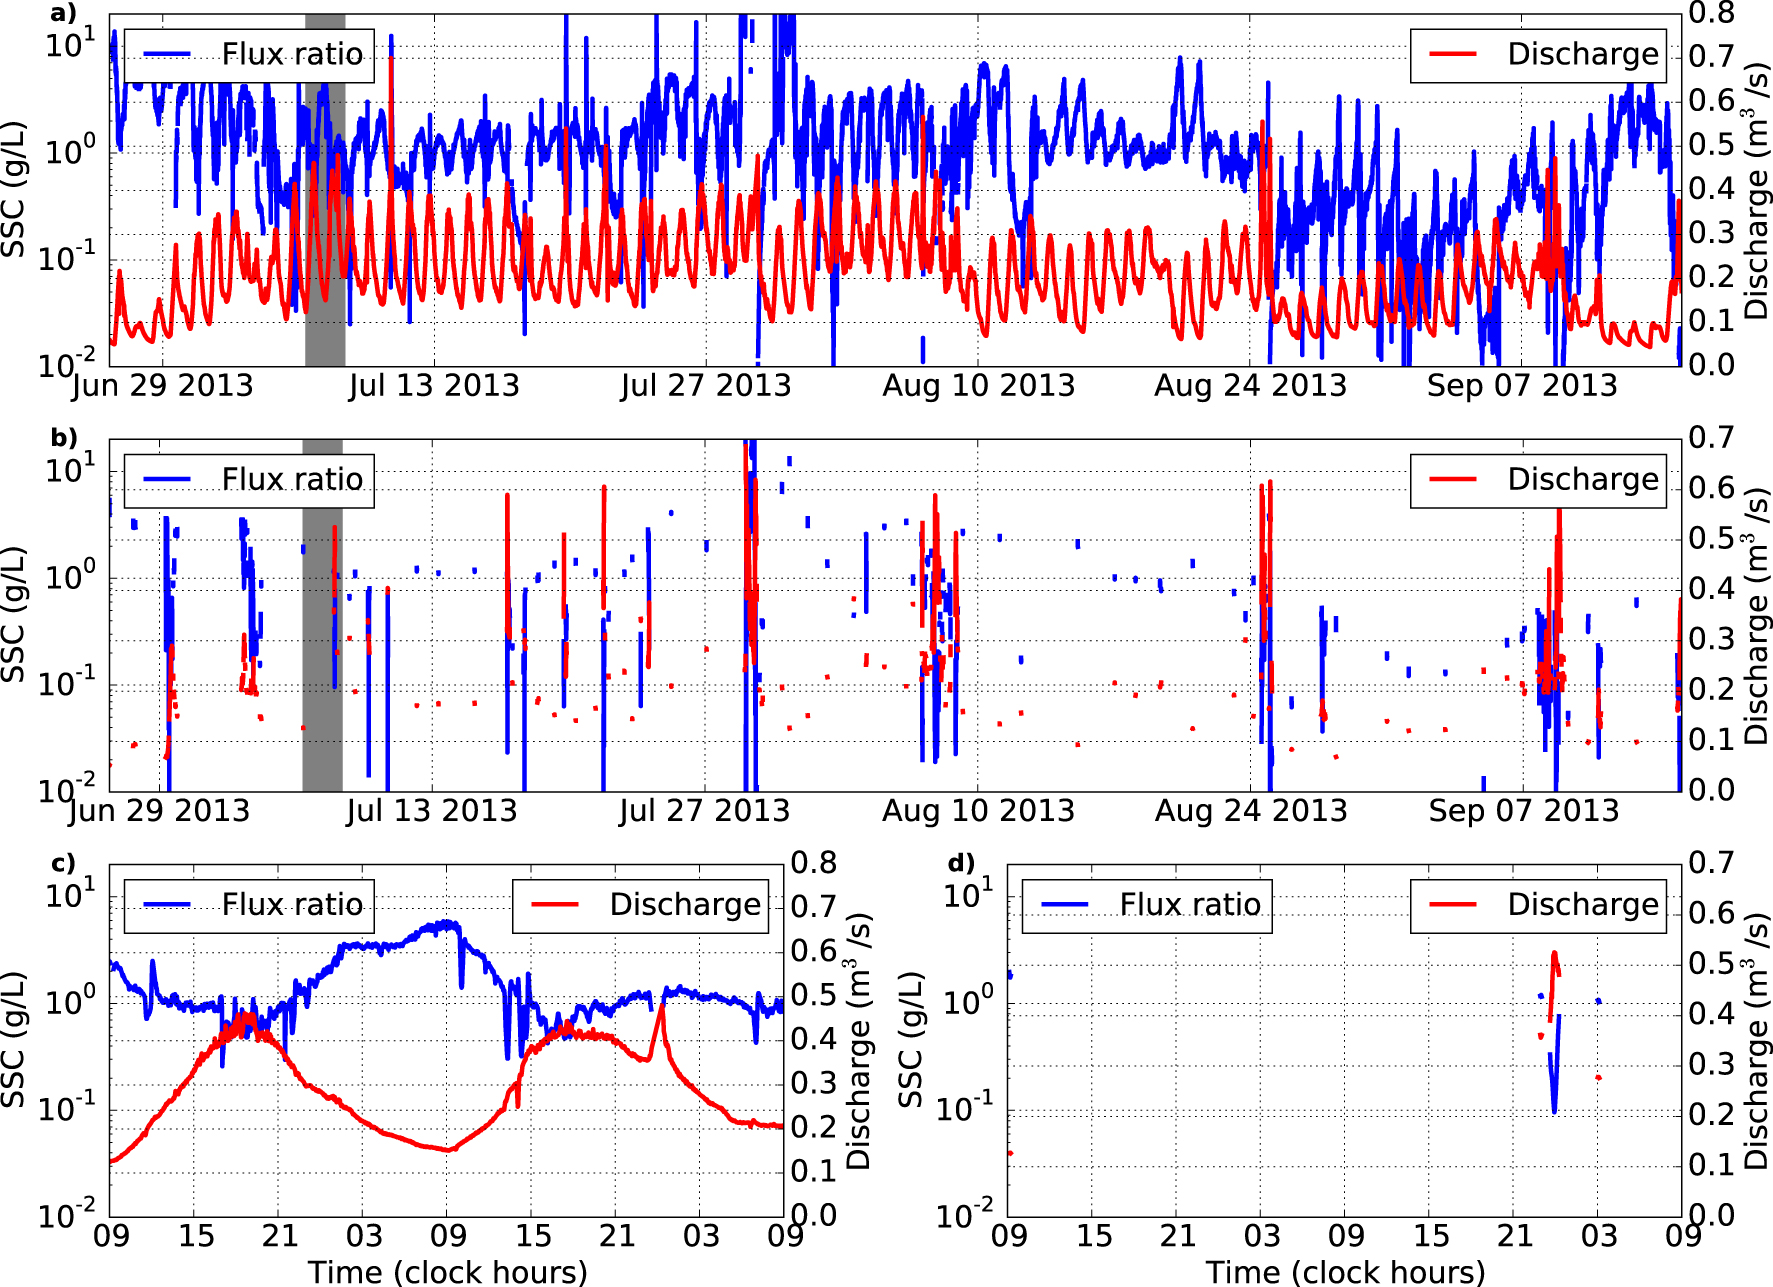
To describe the discharge independent logarithmic ratio of sediment flux, 𝛽, a maximum likelihood estimate (MLE) estimated the best-fit parameters of an array of statistical distributions. In practice, MLE minimizes the negative log-likelihood, to identify the best fist parameters. A Kolmogorov–Smirnov test then provided a distance measure D between candidate and data distributions. This distance was compared to a critical value depending on the number of observations, n, and a significance level, fixed here at 5%. A distribution providing a good fit for the data has a minimal log-likelihood and a Kolmogorov–Smirnov test value, , minimally lower than the critical value of 1.36. We tested 15 candidate distributions: normal, exponential, Weibull, power, exponential-power, exponential-Weibull, Rayleigh, Gumbell, chi-squared, Cauchy, Laplace, log-normal, Maxwell, and power log-normal.
Once a statistical distribution was selected, estimating the entering flux was performed through 10,000 iterations of a Monte-Carlo scheme with four steps. First, for each existing value of the downstream flux, a value of the parameter 𝛽 was drawn from the parameter distribution. Second, the upstream flux was estimated from the value of the parameter and discharge using (A9). Third, the resulting randomly generated flux signal was integrated over time. These three steps were repeated 10,000 times leading to 10,000 values of sediment input entering the proglacial alluvial area. Lastly, the central tendency of the resulting sediment mass was derived by fitting a normal distribution, providing an estimate for the entering sediment flux.
Our extensive statistical analysis confirms the relevance of discharge independent logarithmic ratio of sediment flux (Table A1). A Laplace distribution yields the lowest Kolmogorov–Smirnov value and was selected to estimate 𝛽 (Table A1). However, examining the resulting 𝛽 distribution suggests that non-physical values may arise (e.g. an entering flux 106 times greater than the exiting flux) and the Laplace distribution was truncated when used to estimate the entering flux.
Statistical fit results for the tested parameter describing the proglacial area dynamics
| Distributions | 𝛼 = Fin∕Fout | 𝛼∕Q | 𝛽 = log10(𝛼)∕Q | |||
|---|---|---|---|---|---|---|
| Cauchy | 4170 | 10.6 | 8178 | 10.9 | 7669 | 2.14 |
| Chi-squared | 3652 | 12.2 | 7341 | 11.5 | 19,682 | 39.0 |
| Exponential | 5333 | 16.9 | 9230 | 17.7 | 10,607 | 17.4 |
| Exponential-Weibull | 2780 | 2.76 | 6534 | 2.76 | 7655 | 3.46 |
| Gamma | 6086 | 26.1 | 10,163 | 27.4 | 7734 | 4.41 |
| Gumbel left | 13,843 | 21.7 | 17,822 | 21.8 | 7899 | 5.28 |
| Gumbel right | 7288 | 13.0 | 11,176 | 13.1 | 8306 | 6.39 |
| Laplace | 7126 | 17.6 | 11,037 | 17.8 | 7466 | 1.32 |
| Log-normal | 2845 | 3.01 | 6672 | 3.38 | 7697 | 4.08 |
| Maxwell | 9897 | 17.0 | 13,754 | 16.7 | 8470 | 10.3 |
| Normal | 10,653 | 16.9 | 14,522 | 16.8 | 7694 | 4.00 |
| Powerlaw | ∞ | 18.2 | ∞ | 12.4 | 9615 | 15.4 |
| Power-lognormal | 2761 | 3.50 | 6566 | 3.30 | 7671 | 3.54 |
| Rayleigh | 9747 | 18.2 | 13,608, | 17.8 | 8923 | 12.7 |
| Weibull | 3398 | 14.3 | 7143 | 13.2 | 15,102 | 33.2 |
Highlighted in bold are minimum values of negative log-likelihood and the Kolmogorov–Smirnov test values below the critical value.
: negative log-likelihood (the lower the better); D: Kolmogorov–Smirnov test result (the lower the better); n: sample size; if is greater than a critical value of 1.36, the null hypothesis is rejected.
To further assess the validity of our approach, its output was compared with values measured during the 2013 meltseason (Figure A3). While imperfect, the entering flux calculated from a simple statistical model and from measurements are within one standard deviation from one another. In comparison, the values estimated using a constant ratio and from field measurements are more than one standard deviation apart. In total, estimating the upstream flux with this simple statistical approach lies within the uncertainty range of the measured values and provides a significantly better estimate than simply using a constant ratio, inconsistent with our more recent observations.
Comparison of methods estimating the mass of sediment entering in the proglacial alluvial area during precipitations of the meltseason. The histogram corresponds to the distribution of the integration results for upstream input. Measured downstream export is displayed in blue; estimated upstream input is displayed in red; the mode of the probability distribution best fitted to the Monte-Carlo simulation outputs is represented in black. Data and estimate of the entering mass are drawn from Guillon et al. [2018].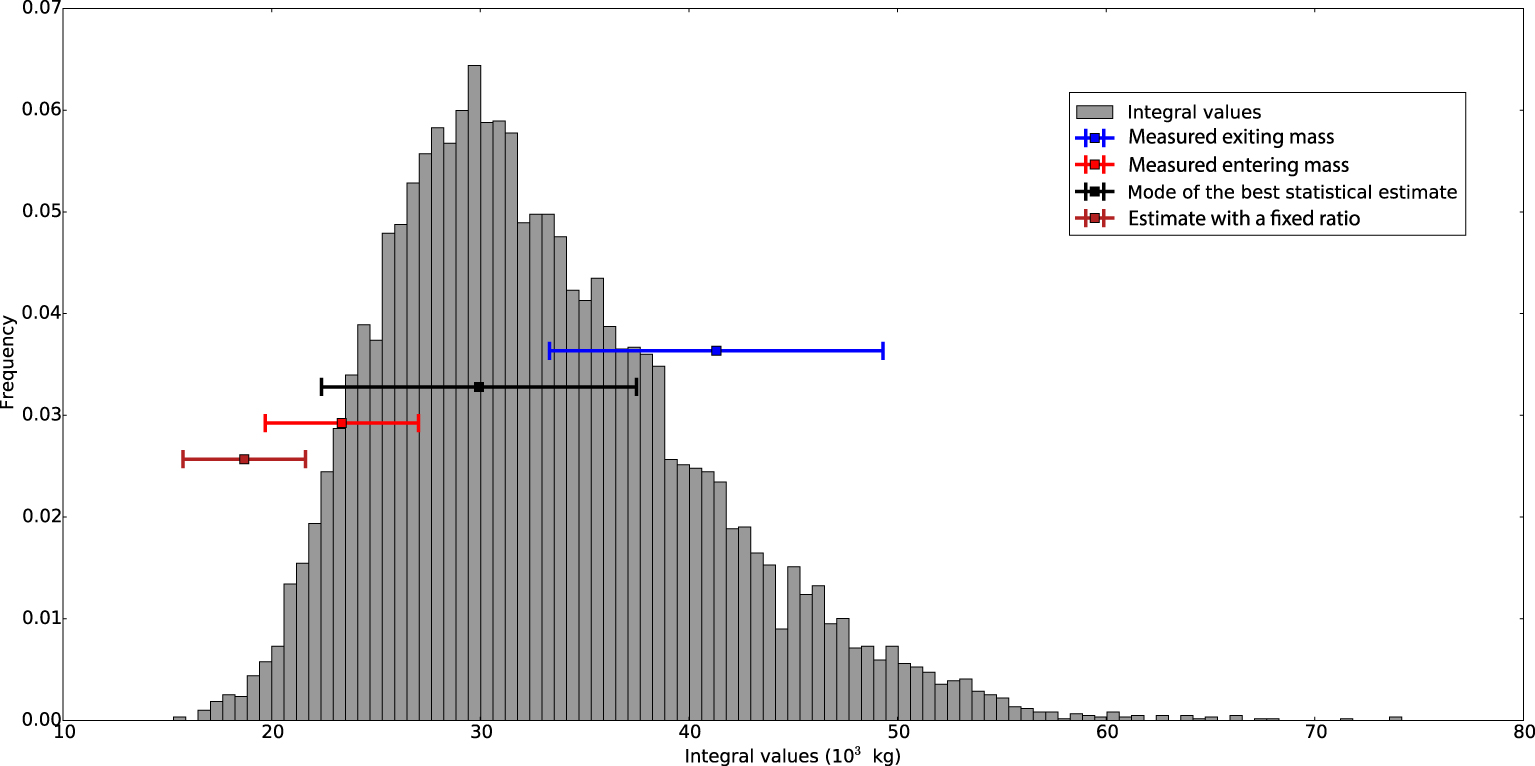
Appendix B. Cosmogenic nuclides content measurements
TCN values compiled from Guillon et al. [2015a] and Sarr et al. [2019] to derive supraglacial to subglacial ratio in Bossons glacier catchment
| Sample | Position | Latitude (°N) | Longitude (°E) | Altitude (m asl) | 10Be/9Be | 10Be (atoms⋅g−1) | Uncertainty (atoms⋅g−1) | Source |
|---|---|---|---|---|---|---|---|---|
| GL-1 | PP-right-side | 45.88912 | 6.85819 | 1817 | 1.87 × 10⁻¹³ | 2.38 × 10⁵ | 1.68 × 10⁴ | [Sarr et al. 2019] |
| GL-3 | PP-right-side | 45.88912 | 6.85819 | 1817 | 1.36 × 10⁻¹³ | 1.52 × 10⁵ | 1.07 × 10⁴ | [Sarr et al. 2019] |
| GL-4 | PP-right-side | 45.88912 | 6.85819 | 1817 | 6.06 × 10⁻¹⁴ | 9.50 × 10⁴ | 6.80 × 10³ | [Sarr et al. 2019] |
| GL-5 | PP-left-side | 45.88936 | 6.85579 | 1765 | 1.29 × 10⁻¹³ | 1.45 × 10⁵ | 8.70 × 10³ | [Sarr et al. 2019] |
| GL-6 | PP-left-side | 45.88869 | 6.85539 | 1810 | 8.93 × 10⁻¹⁴ | 1.41 × 10⁵ | 7.60 × 10³ | [Sarr et al. 2019] |
| GL-7 | PP-centre | 45.88957 | 6.85681 | 1794 | 1.38 × 10⁻¹³ | 1.94 × 10⁵ | 2.54 × 10⁴ | [Sarr et al. 2019] |
| GL-18 | PG-moraine | 45.87954 | 6.86812 | 2561 | 2.88 × 10⁻¹⁴ | 3.79 × 10⁴ | 6.20 × 10³ | [Sarr et al. 2019] |
| GL-19 | PG-moraine | 45.87954 | 6.86812 | 2561 | 2.17 × 10⁻¹⁴ | 3.03 × 10⁴ | 4.50 × 10³ | [Sarr et al. 2019] |
| GL-20 | PG-moraine | 45.87954 | 6.86812 | 2561 | 2.32 × 10⁻¹⁴ | 4.26 × 10⁴ | 6.50 × 10³ | [Sarr et al. 2019] |
| GL-21 | PG-right-side | 45.88028 | 6.87027 | 2570 | 1.34 × 10⁻¹⁴ | 1.97 × 10⁴ | 2.40 × 10³ | [Sarr et al. 2019] |
| Boss supra | PP-left-side | 45.88898 | 6.85865 | 1795 | 2.08 × 10⁻¹⁴ | 2.72 × 10⁴ | 2.40 × 10³ | [Guillon et al. 2015a] |
| BOS2A | Bossons subglacial stream | 45.89220 | 6.85244 | 1443 | 1.23 × 10⁻¹⁴ | 1.52 × 10⁴ | 2.40 × 10³ | [Guillon et al. 2015a] |
| BOS2B | Bossons subglacial stream | 45.89220 | 6.85279 | 1441 | 1.16 × 10⁻¹⁴ | 1.10 × 10⁴ | 2.82 × 10³ | [Guillon et al. 2015a] |
| BOS8 | Bossons stream datalogger | 45.89940 | 6.84892 | 1240 | 1.6 × 10⁻¹⁴ | 1.65 × 10⁴ | 2.69 × 10³ | [Guillon et al. 2015a] |
| BOS11 | Crosette sand | 45.89190 | 6.86003 | 1760 | 2.4 × 10⁻¹⁵ | 2.12 × 10³ | 6.11 × 10² | [Guillon et al. 2015a] |
| Boss sous | Crosette subglacial stream | 45.89140 | 6.85917 | 1760 | 3.31 × 10⁻¹⁵ | 2.53 × 10³ | 8.77 × 10² | [Guillon et al. 2015a] |
Appendix C. Detailed hydro-sedimentary data
Relationship between temperature, volume of meltwater and sediment export. (a) Relationship between temperature T and cumulative meltwater discharge Q, integrated over one week periods; (b) relationship between cumulative meltwater discharge Q and sediment export M, integrated over one week periods. (a–b) The gray area represents the boundary for a 99% confidence interval. While the power laws are statistically significant, the relationship between meltwater volume and sediment export (b) exhibits a dispersion over three orders of magnitude.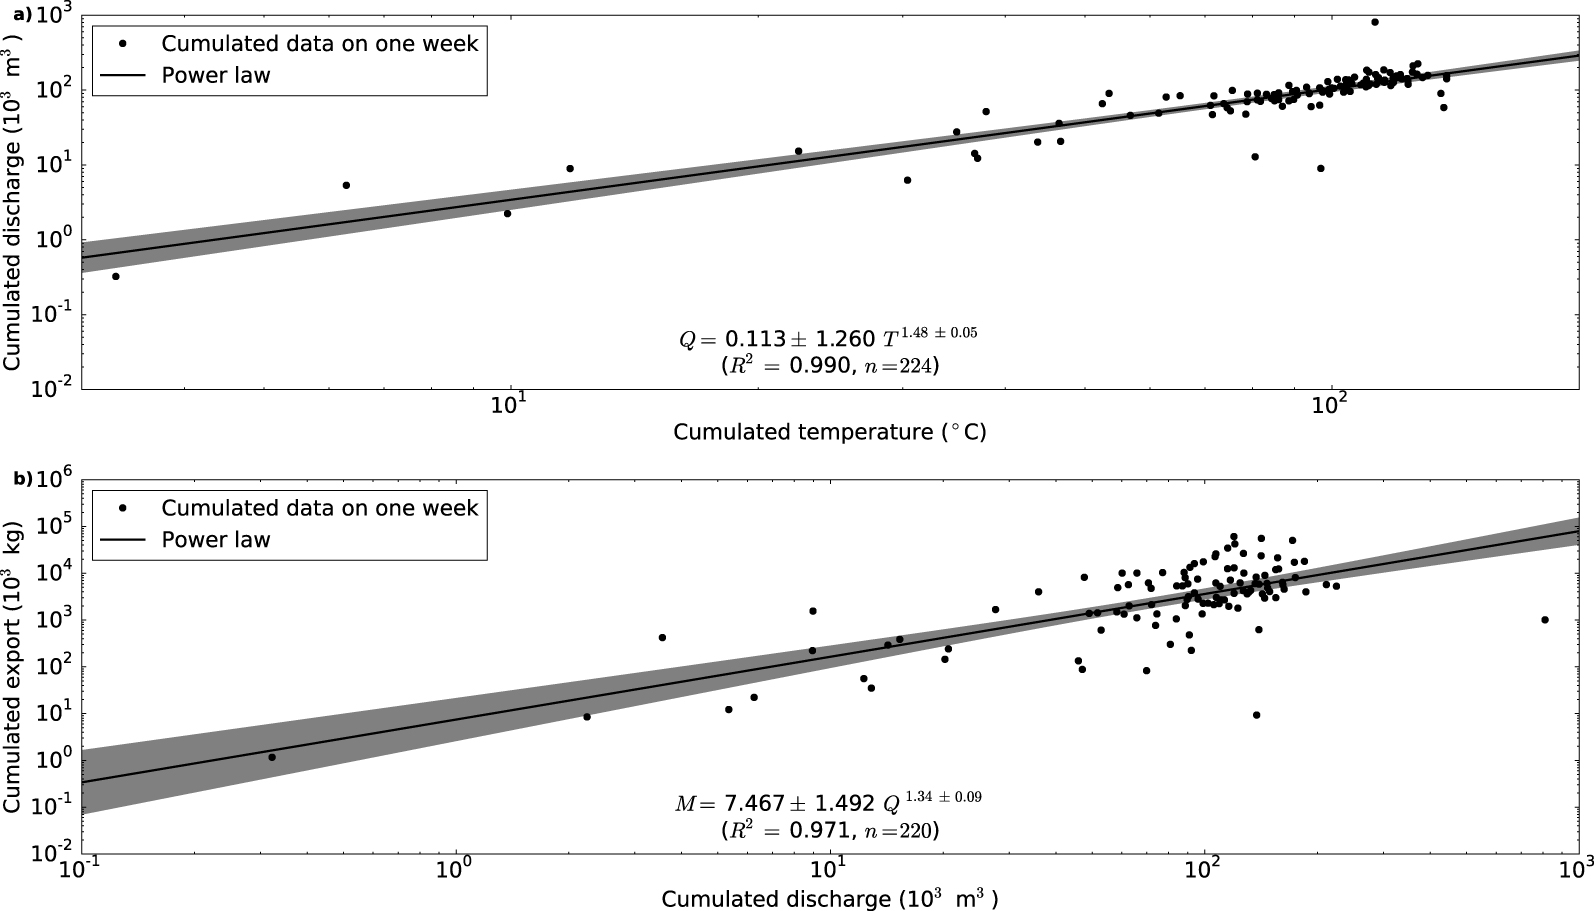
Integration of suspended sediment flux (silts only) at Bossons downstream and Crosette stations
| Stream | Year | Before melt season (103 kg) | Melt season | After melt season (103 kg) | ||
|---|---|---|---|---|---|---|
| During precipitations (103 kg) | During dry periods (103 kg) | Total (103 kg) | ||||
| Bossons | 2009 | n/a | 71.6 ± 11.4 | 111.6 ± 17.75 | 183.2 ± 29.15 | n/a |
| 2010 | n/a | 536.5 ± 83.45 | 162.1 ± 25.08 | 698.7 ± 108.5 | n/a | |
| 2011 | n/a | 15.9 ± 2.47 | 56.2 ± 16.2 | 72.0 ± 18.6 | 5.3 ± 0.87 | |
| 2012 | 4.93 ± 1.67 | 32.9 ± 4.93 | 270.24 ± 45.23 | 303.1 ± 50.16 | n/a | |
| 2013 | n/a | 63.6 ± 9.4 | 87.54 ± 20.21 | 151.18 ± 29.63 | 10.0 ± 5.04 | |
| 2014 | n/a | 80.1 ± 12.2 | 149.8 ± 31.34 | 230.8 ± 43.52 | n/a | |
| 2015 | 18.0 ± 1.88 | 184.2 ± 25.45 | 604.2 ± 85.02 | 788.4 ± 110.5 | n/a | |
| 2016 | 11.1 ± 1.32 | n/a | n/a | 1299.8 ± 188.4 | 0.58 ± 0.06 | |
| Crosette | 2013 | n/a | n/a | n/a | 305.1 ± 113.9 | n/a |
| 2014 | n/a | n/a | n/a | 406.8 ± 107.3 | n/a | |
| 2016 | n/a | n/a | n/a | 42.2 ± 7.87 | n/a | |
“n/a” stands for not available.
Input during melt season precipitation, total input from upstream sources and total export from the proglacial alluvial area
| Upstream input during meltseason precipitations (103 kg) | Total input from upstream sources (glacial input) (103 kg) | Total input from valley sandur (103 kg) | |
|---|---|---|---|
| 2009 | 20.9 ± 73.6 | 132.5 ± 91.31 | 50.71 ± 84.96 |
| 2010 | 114.0 ± 50.77 | 276.1 ± 75.84 | 422.5 ± 134.2 |
| 2011 | 7.92 ± 3.03 | 64.1 ± 19.2 | 13.3 ± 6.37 |
| 2012 | 22.0 ± 6.26 | 292.2 ± 51.49 | 15.8 ± 12.86 |
| 2013 | 46.52 ± 9.65 | 134.1 ± 29.86 | 27.16 ± 24.1 |
| 2014 | 51.9 ± 6.61 | 201.7 ± 37.95 | 29.10 ± 18.8 |
| 2015 | n/a | n/a | n/a |
| 2016 | n/a | n/a | n/a |