

1 Introduction
The polymer and paint industries have shown great interest in obtaining materials with improved properties or products with new features resulting in greater value added. The common search of both industries is focused on the addition of bactericidal and fungicidal properties to their pristine materials, where application of nanoparticles has demonstrated to be partly successful [1–4].
The use of different species of silver as bactericidal agent such as Ag+, Ag0, or Ag nanoparticles [5,6], Ag2O [7], AgBr [8], and also Ag+ exchanged montmorillonite (MMT–Ag) [9–12] has been largely reported. On the basis of these findings the following strategy was devised: to add bactericidal and/or fungicidal properties to polymer and/or paint materials by the addition of a low amount of MMT–Ag.
The MMT–Ag hydrophilic characteristics [11] would allow its use in the painting industry, which generally tends to go for water-based products, whereas the incorporation of MMT–Ag into polymers is difficult. To solve this problem, the change of hydrophilic to hydrophobic characteristics can be attained by tailoring montmorillonite (MMT) with quaternary ammonium compounds, thus obtaining organomontmorillonite (OMMT) materials. Moreover, OMMT addition improves the mechanical properties [13,14] and thermal stability [15] of the obtained nanocomposites. Besides inhibiting microbial growth [16], certain quaternary ammonium compounds such as hexadecyltrimethylammonium bromide (HDTMABr) have shown bactericidal properties against Escherichia coli when supported on MMT (HDTMA–MMT) [17]. The use of HDTMABr has the added bonus of being safe, and its degradation products do not cause genotoxic effects [18].
The addition of silver to MMT and further HDTMA loading allowed its incorporation into low-density polyethylene and also its bactericidal capacity transfer against E. coli to the nanocomposite attained [19]. This procedure involved a low MMT–Ag+ exchange (around 30% exchange with respect to the MMT cation exchange capacity [CEC]) [11]. Besides, the subsequent addition of HDTMABr, which is more firmly held by the clay than inorganic cations [20], could generate an important Ag+ loss from the MMT surface, which is not measured by Savas and Hancer [19].
In addition, the HDTMA loaded in diatomaceous earth was recently proved to be a bioactive additive against fungi that can be found as biofilms on the surfaces of indoor environments (Chaetomium globosum and Alternaria alternata) and that could be used as part of protective coatings [21].
To decrease the Ag loss demonstrated by raw MMT (>90% Ag+ loss at 10 mM NaNO3) [11] and taking advantage of the strong surfactant retention at the clay surface, in this work, the addition sequence of the reagents was as follows: first, different amounts of HDTMA loaded in MMT and, second, silver addition. This procedure will allow attaining different MMT surface sites free of surfactant where Ag+ ions can be exchanged in ionic form, which would in turn diminish silver loss during the whole process.
To the best of our knowledge, the surface and structural changes of OMMT–Ag samples were achieved, for the first time, by a combination of material characterization techniques; also retained and leaching Ag+ was evaluated. Therefore, in the present study, the fungicidal properties of OMMT–Ag samples were estimated against filamentous fungi (A. alternata) to propose their possible use in paints.
2 Experimental section
2.1 Materials
A raw Patagonian MMT, provided by Castiglioni Pes y Cia, was used to obtain the OMMTs. Its structural formula is [(Si3.89Al0.11) (Al1.43Fe0.26Mg0.30)O10(OH)2]M+0.41 [22]. The CEC of the MMT (with a specific surface area of 39 m2/g) was 82.5 mequiv/100 g determined by the Cu-triethylenetetramine method [23].
The cationic surfactant HDTMABr and precursor AgNO3 were purchased from Sigma Aldrich Co, with 98% and 99.99% purity, respectively. The HDTMABr solubility in water is 50 mg/mL, MW = 364.5 g/mol, and critical micelle concentrations = 9 × 10⁻⁴ M [24].
2.2 Preparation of OMMT and OMMT–Ag nanocomposites
The synthesis of OMMT samples was performed by the following procedure: 30 g of MMT was dispersed in 2 L of deionized water, maintained at 60 °C with continuous stirring, and amounts of HDTMABr were slowly added to attain 0.5, 1, or 2 times the CEC of the MMT. The mixtures were stirred for 2 h at 60 °C; subsequently, the suspended solids were centrifuged and washed with water to free them of bromide anions (tested by AgNO3), and then dried at 80 °C. The products obtained were named as MH0.5, MH1, and MH2, respectively.
To attain MMT–Ag and OMMT–Ag products, 0.5 g of MMT or OMMT was dispersed in 25 mL of AgNO3 (0.1 N) solution and maintained with continuous stirring for 2 h. The products obtained were washed with water and dried as described previously and labeled as MMT–Ag, MH0.5–Ag, MH1–Ag, and MH2–Ag, respectively.
2.3 Characterization
Measurements of N2 adsorption–desorption isotherms at 77 K for the materials under study were carried out using manometric adsorption equipment (Autosorb-1MP, Quantachrome Instruments). The samples were previously degassed at 50 °C for 12 h, reaching a final pressure of 0.5 Pa. Besides, the evaluation of textural properties of some samples was complemented by mercury porosimetry (Autopore III 9410, Micromeritics).
The Brunauer–Emmett–Teller (BET) method [25] applied to N2 adsorption data was used to estimate the specific surface area (SBET) of the samples, where the criteria proposed by Rouquerol et al. [26] were taken into account. The αS-plot method using a calcined natural clay as the reference material [27] was used to calculate the micropore volume (VμP). The total pore volume (VTP) was obtained by applying the Gurvich rule to the N2 adsorption data at a relative pressure of 0.985. To attain the pore size distribution (PSD), the nonlocal density functional theory (NLDFT) method was applied using ASiQwin software, v. 2.0 (Quantachrome Instruments). The selected kernel was “N2 at 77 K on silica, NLDFT adsorption model” [28], which assumes pores with cylindrical geometry.
Fourier transform infrared (FTIR) spectra were collected using a Nicolet IS10 Fourier transform infrared spectrometer from Thermo Scientific. The KBr pressed disk technique (1 mg of sample and 200 mg of KBr) was used. Spectra were obtained by coaddition of 64 scans at a resolution of 4 cm−1.
Thermogravimetric (TG) experiments were conducted using an NETZSCH STA 409 PC/PG with alumina as reference. Samples of 20 mg were placed in alumina crucibles and heated from 30 to 800 °C at a scanning rate of 10 °C/min in air atmosphere.
The surface morphology of organoclays was observed by scanning electron microscopy (SEM) using a Carl Zeiss SMT, SUPRA 40.
Particle size determinations were performed in aqueous media with a 1% w/w particle dispersion by dynamic light scattering measurements using ζ Potential Analyzer 90Plus/Bi-MAS (Brookhaven Instruments Corporation) with the multiangle particle sizing function, operating at λ = 635 nm, 15 mW solid-state laser, scattering angle = 90°, and temperature = 25 °C. The determination rendered the apparent equivalent sphere diameter (Dapp).
X-ray diffraction (XRD) patterns (reflection peak 001) were collected on powder samples in the range 2° < 2θ < 15° with a counting time of 10 s/step and 0.02° (2θ) step size, using a Philips PW 1710 diffractometer (PANalytical, Almelo, NLD), operated at 40 kV and 30 mA with Cu Kα radiation.
To estimate the mean crystallite domain size of MMT systems, D001, the Scherrer equation was used:
| (1) |
β Values were obtained considering the pseudo-Voigt fitting of 001 reflection peaks, and the instrumental width obtained after measuring an alumina diffraction pattern and using the Caglioti equation. Then, the D001 values obtained, together with the basal spacing of 001 reflection of the clay layers, following Huang et al. procedure [29], were used to estimate the average number of clay platelets stacked with high crystalline order (n):
| (2) |
ζ Potential measurements were carried out using the same Brookhaven equipment used for Dapp measurements, using 10−3 M KCl as inert electrolyte and Pd electrodes. Sample suspensions were measured at pH = 6, which is the pH found in the product suspensions.
X-ray fluorescence measurements to quantify Ag in all the OMMT–Ag samples were performed using an Innov-X System model ALPHA-4000. The Ag+ desorption was conducted by shaking 50 mg of the OMMT–Ag samples with 25 mL of 10−2, 10−3, or 10−4 mM NaNO3 for 24 h. The final dispersions were centrifuged at 15,000 rpm. The metal concentrations were determined in supernatants by atomic absorption spectrometry with flame atomization.
The bioactivity of OMMT–Ag samples and controls was assessed by the agar-diffusion method with fungal species (isolated from biodeteriorated coatings). The fungal species used was A. alternate and the concentration was adjusted to 105 spores/mL. Then 15 mL of the corresponding sterilized melted media rose bengal–based agar was inoculated with the fungus suspensions. Wells were made in seeded agar plates and each one was filled with 20 mg of the tested material. All the plates were incubated at 25 °C and finally inhibition zone diameters were measured.
3 Results and discussion
3.1 N2 adsorption–desorption isotherms
To evaluate changes in the specific surface area and pore volume, Fig. 1a and b shows the experimental N2 adsorption–desorption isotherms at 77 K for the studied samples without and with the addition of Ag, respectively.
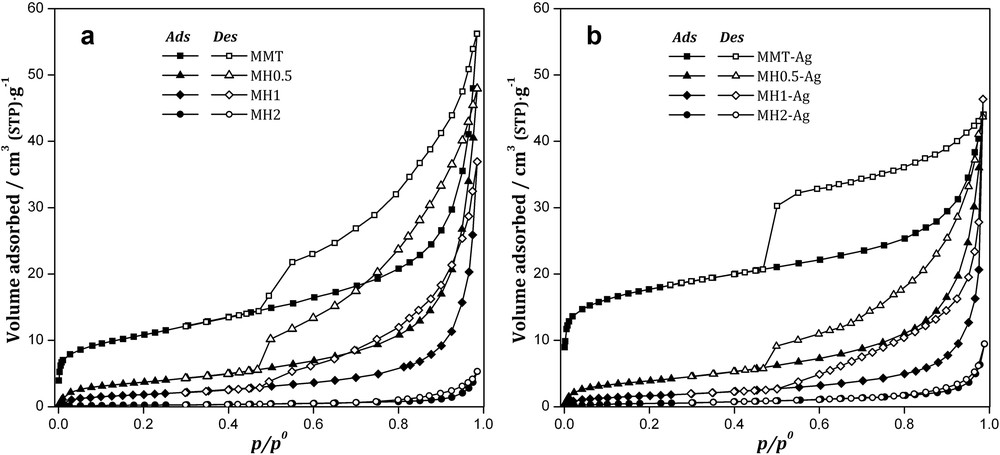
Experimental nitrogen adsorption–desorption isotherms at 77 K for (a) MMT and OMMT, and (b) MMT–Ag and OMMT–Ag samples.
All samples exhibited type IV isotherms according to the IUPAC classification [30]. In general, these isotherms presented type H3 hysteresis loop, which was related to materials with plate-like particle aggregates. The adsorption isotherms for all the samples showed a rapid increase in N2 adsorbed volume at high relative pressures (near 1) corresponding to N2 adsorption on larger mesopores or narrow macropores (of the interparticle spaces). It is important to remark that at low relative pressures, MMT and MMT–Ag samples exhibited type I isotherms suggesting a small contribution of micropores.
With respect to the isotherms of OMMT samples, the following behaviors could be observed with the increase in HDTMABr loading: (1) a decrease in N2 adsorbed volume at low relative pressure, possibly because of the entrance of HDTMA+ by cation exchange into the interlayer region of MMT; (2) a decrease in N2 adsorbed volume in the mesoporous region (at p/p0 > 0.1), which could be because of HDTMA+ adsorption onto the external surface of the MMT with the consequent ordering in the layers; and (3) the gradual increase in the relative pressure value of the hysteresis loop closure, from 0.45 to 0.8 of p/p0, which could be related to the disappearance of the percolation phenomenon (which occurs when the hysteresis loops close at a relative pressure near 0.45) on the desorption branch. This fact indicated that the pores (of the pore network structure) with sizes less than ∼5 nm (in MH1 and MH2 samples) and greater than 5 nm (in MH2 sample) were occupied by the HDTMA+.
The above discussed results are reflected in the textural properties of these materials, as shown in Table 1.
Textural properties of the OMMT and OMMT–Ag materials.
| Samples | SBET (m2/g) | VμP (cm3/g) | VTP (cm3/g) |
| MMT | 39 | 0.004 | 0.09 |
| MH0.5 | 14 | 0 | 0.07 |
| MH1 | 7 | 0 | 0.06 |
| MH2 | 1 | 0 | 0.01 |
| MMT–Ag | 65 | 0.010 | 0.07 |
| MH0.5–Ag | 14 | 0 | 0.07 |
| MH1–Ag | 6 | 0 | 0.07 |
| MH2–Ag | 2 | 0 | 0.07 |
It is important to point out that the isotherms for OMMT and OMMT–Ag samples followed the same behavior (Table 1), which indicated that the incorporation of Ag into OMMT did not generate significant textural changes.
However, by comparing the isotherms of the MMT–Ag sample with MMT sample (Fig. 1) it is possible to note that (1) the adsorbed volume of N2 at low relative pressure increased, which could be assigned to the exchange of Ag+ by Na+ (ionic radius 0.126 and 0.097 nm, respectively) [31] with the consequent increase in the MMT interlayer space and amount of micropores (Table 1); and (2) the N2 adsorbed volume at high relative pressures decreased (near 1), which can be attributed to an MMT macrostructure reorganization with the Ag+ incorporation, as is indicated by the curves of cumulative pore volume versus pore size obtained from mercury intrusion data (Fig. 2).
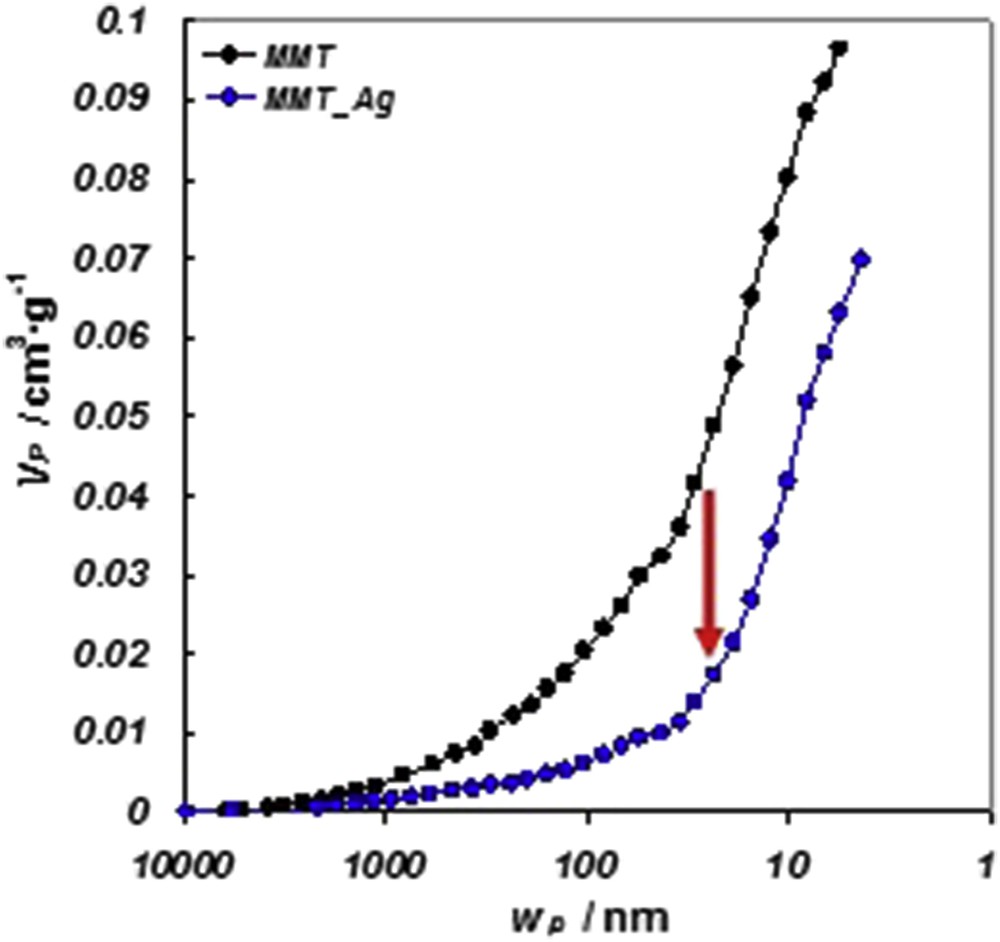
Curves of cumulative pore volume obtained from mercury intrusion data on MMT and MMT–Ag samples.
Fig. 3 a and b shows the PSD of OMMT and OMMT–Ag samples, respectively, obtained with the NLDFT method.
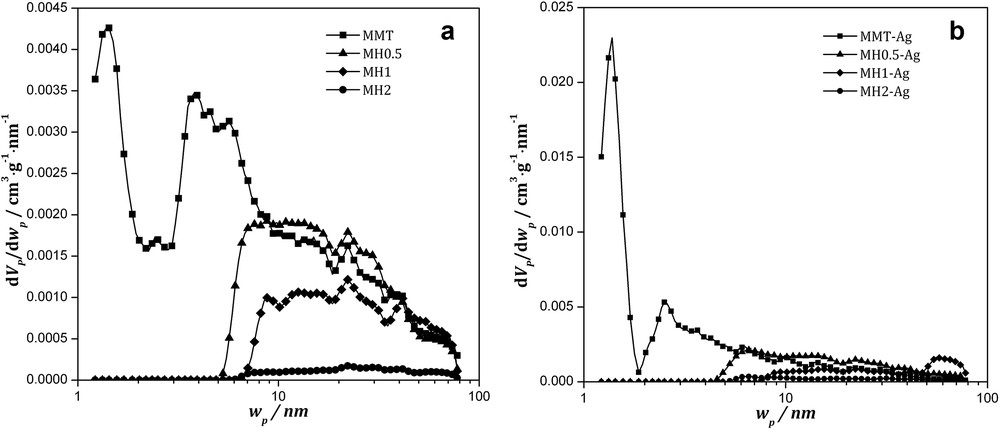
PSD for (a) MMT and OMMT, and (b) MMT–Ag and OMMT–Ag samples.
For OMMT samples, with the increase in HDTMA+ loading, the mesopore size distribution shifted to higher pore size values, because HDTMA+ was initially adsorbed on the smaller MMT mesopores. In addition, it was observed that the quantity of mesopores decreased as the amount of surfactant loaded on the samples increased. The addition of Ag to the OMMT samples did not significantly change the behavior found in the OMMT samples. The PSD of the MMT and MMT–Ag samples indicated the presence of a small amount of micropores (Fig. 3), as mentioned previously. The MMT–Ag sample exhibited one additional broad peak (at ∼2.5 nm of pore-size mode), which could be related to interstitial pores of Ag agglomerates (clusters) in this material, generating a two times higher SBET than that obtained for MMT (Table 1) [32].
3.2 Fourier transform infrared analysis
The characteristic stretching vibrations of the C–H bonds at 2926 and 2853 cm−1 (asymmetric and symmetric –CH2–, respectively) of OMMT samples [33]were not modified by the presence of Ag (Fig. 4). The presence of an absorption band at 1382 cm−1 in the MMT–Ag sample was assigned to the H–O–H vibration [34] corresponding to the feldspar impurity of MMT (around 12%) [22]. However, the increase in this absorption band (at 1382 cm−1) for the MH2–Ag sample could be assigned to some NO3− remaining for the silver exchange [35]. The characteristic peak of scissoring modes in methyl groups of ammonium headgroup at 1419 cm−1 was also observed [36]. The absence of the absorption band at 1419 cm−1 in the MMT–Ag sample (Fig. 4, inset) supports the modification of MMT with surfactant cations [37].
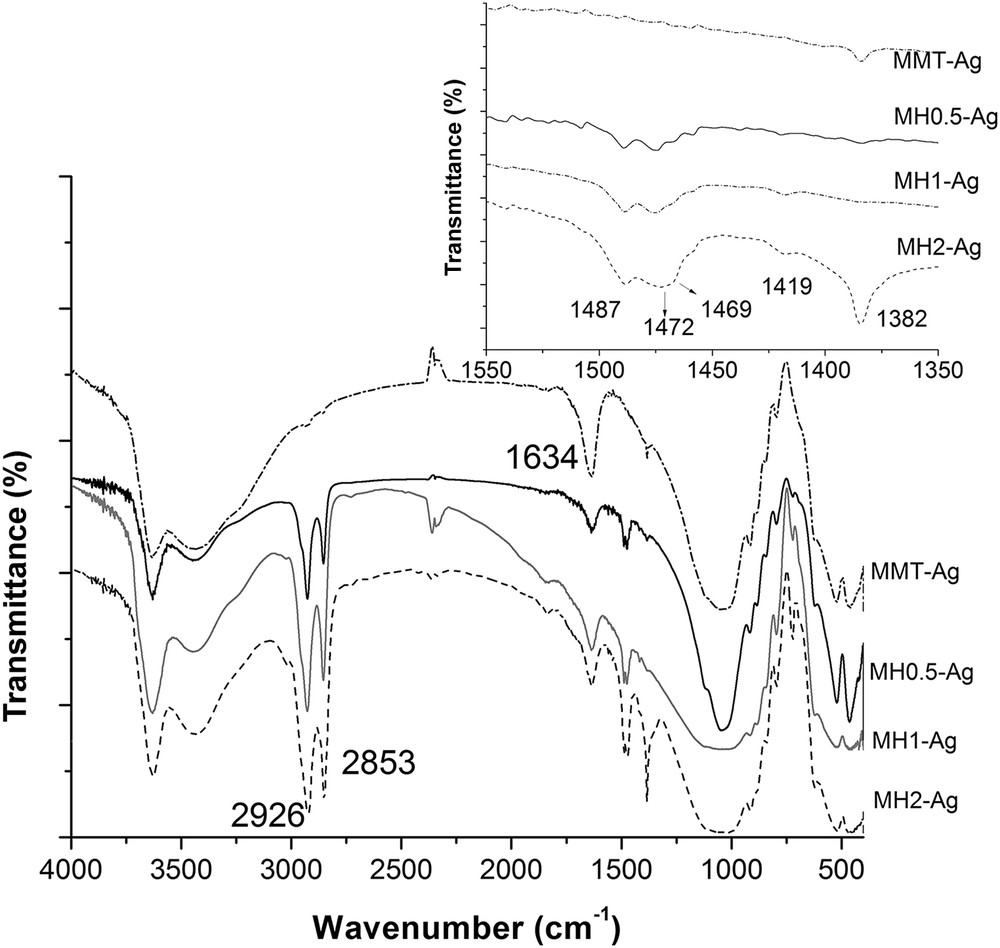
FTIR spectra of the indicated samples. Inset: magnification of the 1550–1350 cm−1 range.
The bands observed between 1639 and 1634 cm−1 in all adsorbents correspond to the OH deformation of water, whose intensity decreases with the increase in surfactant loading at the interlayer. The peaks of methylene scissoring mode were observed within 1480–1450 cm−1 [38] (Fig. 4 inset), and the shoulder at 1469 cm−1 would indicate the Br-Ag bond effect on CH3-N+ vibration of Ag–HDTMABr complex at the MH2–Ag surface [39]. Evidence of the HDTMA–Ag complex formation in solution is shown in Fig. S1 (in Supplementary information).
3.3 Thermogravimetric results
TG and DTG were performed to achieve a more complete understanding of the interactions or mechanisms of association between the clay and surfactant and the effect of subsequent Ag+ addition.
The DTG curve for MMT sample (Fig. 5a) showed a first broad peak located at 123 °C assigned to a dehydration process of the physisorbed water present in the external surface and interlayer space, and a second one at 669 °C attributed to the dehydration of hydroxyl groups [40]. The Na+ exchange by Ag+ in MMT–Ag sample caused a decrease in the first broad peak at 80 °C (Fig. 5c), in agreement with the decrease in hydration energy due to the increase in ionic radius from 0.097 to 0.126 nm for Na+ and Ag+, respectively [31].
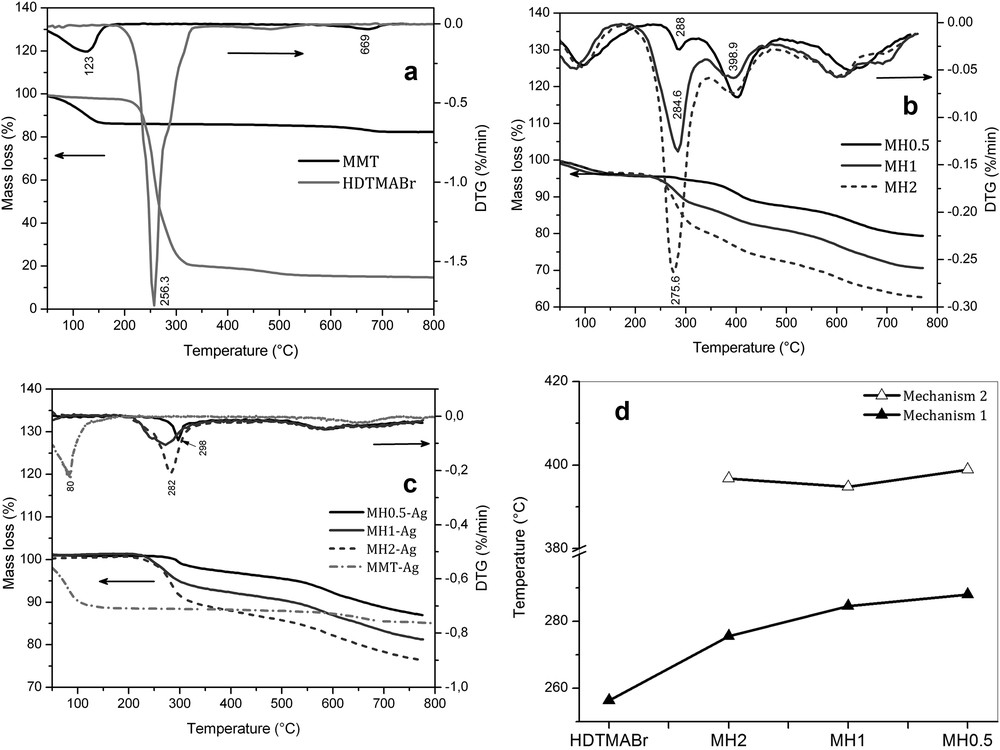
DTG curves of (a) MMT and HDTMABr, (b) OMMT samples, (c) OMMT–Ag samples, and (d) interaction mechanisms.
The DTG pattern of HDTMABr surfactant (Fig. 5a) shows a single broad and well-defined peak at 256.3 °C corresponding to the organic material decomposition. The surfactant loading in OMMT samples (Fig. 5b) showed two different decomposition temperatures, indicating the existence of different interactions or association mechanisms between the clay and surfactant [41]. The first peak at around 280 °C was associated with van der Waals interactions (labeled mechanism 1), whereas the second one (labeled mechanism 2) with a stronger interaction at 398.9 °C was attributed to the cation exchange process [42].
In MH0.5 sample mechanism 2 prevailed (as indicated in Table 2) in comparison to the other OMMT samples because of the low concentration of HDTMABr used (below the CEC of MMT). In all OMMT samples remaining adhered through electrostatic forces and a constant decomposition temperature of 398.9 °C, the HDTMA+ was exchanged with the Na+ cations of the interlayer [42] (Fig. 5d). In contrast, in MH1 and MH2 samples, mechanism 1 (Table 2) was favored with the increase in HDTMA+ loading in the clay (Fig. 5b). This latter mechanism was attributed to surfactant adsorption on the external clay surface, which can occur either as HDTMA+ ion or HDTMA+ Br− ion pair through van der Waals forces [43]. It is also important to point out that the increase in HDTMA+ loading by physical adsorption produced a shift in the decomposition temperature toward lower values, from 288 to 275.6 °C (Fig. 5b and d), in agreement with He et al. [43], approaching the decomposition temperature of the bulk state of HDTMABr (Fig. 5a).
Mass loss (TG) of samples under study and actual surfactant loading expressed as % cationic exchange capacity (CEC).
| Samples | 25–150 °C (%) | 150–350 °C (%) | 350–550 °C (%) | 550–700 °C (%) | Actual surfactant loading (% CEC) |
| HDTMABr | 2.4 | 77.6 | 4.4 | 0.86 | |
| Loss of water | van der Waals | Cation exchange | Dehydroxylation layered silicate | ||
| MMT | 13.3 | 0.8 | 0.8 | 2.6 | – |
| MH0.5 | 4.3 | 2.1 | 7.4 | 6.9 | 23.7 |
| MH1 | 4.1 | 9.4 | 7.4 | 7.0 | 72.5 |
| MH2 | 3.6 | 16.6 | 9.3 | 6.5 | 117.1 |
| MMT–Ag | 11.4 | 0.3 | 0.6 | 2.2 | – |
| MH0.5–Ag | 0 | 2.3 | 3.4 | 5.6 | 20.2 |
| MH1–Ag | 0 | 6.8 | 4.1 | 6.0 | 39.9 |
| MH2–Ag | 0 | 10.8 | 5.0 | 5.9 | 70.9 |
The DTG patterns of OMMT–Ag samples (Fig. 5c) showed only the presence of peaks corresponding to mechanism 1, and from Table 2 it is possible to see that the mass loss percentages due to mechanisms 1 (150–350 °C) and 2 (350–550 °C) generally decrease with respect to that of OMMT samples. This percentage decrease would be because of the displacement of some HDTMA+ by Ag+ ions located on the external and interlayer surface of the clay, respectively. Besides, the disappearance of the peak located at less than 200 °C in OMMT–Ag samples was attributed to the replacement of remaining Na+ by Ag+ ions, and consequently to the Na+-associated water of OMMT samples.
Mass loss percentages for MMT were close to those previously indicated elsewhere [44]. The mass loss percentages obtained (Table 2) were consistent with the previously assigned mechanisms in OMMT samples, where the increase in HDTMA+ loading correlated with mechanism 1 [41,44], whereas mechanism 2 remained almost constant because of the CEC value of the MMT sample (Fig. 5d).
The actual surfactant loading for all exchanged samples was obtained by calculation from the mass loss values in the temperature range from 150 to 700 °C, taking into account the mass loss of MMT structural hydroxyl groups [45]. Table 2 summarizes the actual surfactant as percent loading (with respect to the CEC of MMT) of the samples under study. It is important to note that the actual % CEC of HDTMA+ increased in OMMT samples as the initial surfactant amount increased, and in OMMT–Ag samples a percent decrease of HDTMA+ with respect to OMMT samples was found. The latter behavior indicates the release of HDTMA+ bonded by van der Waals forces to the surface (mechanism 2) because of further washing after Ag+ adsorption and/or also some HDTMA+ exchanged by Ag+ at the interlayer (mechanism 1).
3.4 SEM observations and apparent diameter (Dapp)
Previously, SEM images of the same MMT and OMMT samples that exhibited curved plates either with face-to-edge contacts between particles or covered by small and well-separated particles, and less curved plates and aggregate formation [41,46], respectively, were reported. An important morphology difference between the MMT–Ag and OMMT–Ag samples was found at low SEM magnification (Fig. S2 in Supplementary information) where the formation of larger aggregates in OMMT–Ag can be evidenced. To better evaluate the presence of Ag species in MMT–Ag and OMMT–Ag samples, the SEM images with higher magnification are shown in Fig. 6. The Ag+ addition generated small spherical particle growth with different diameter sizes between 9 ± 2 and 21 ± 4 nm in the MMT–Ag sample (Fig. 6a), whereas in the MH0.5–Ag sample a more controlled particle size growth with close to a single-modal distribution and average size of 9 ±1 nm was observed (Fig. 6b). Elemental microanalysis of these particles determined by energy dispersive X-ray spectroscopy (EDS) indicated the presence of silver (Fig. 3 in Supplementary information). The high particle size dispersion, as well as silver species that were found in the MMT–Ag sample that could be either as Ag+ ions in the interlayer or as particles on its surface, could explain the significant changes in the texture of MMT–Ag with respect to the same raw MMT sample reported previously [46], such as the increase in microporosity and the presence of an additional peak at ∼2.5 nm in PSD (Fig. 3b).
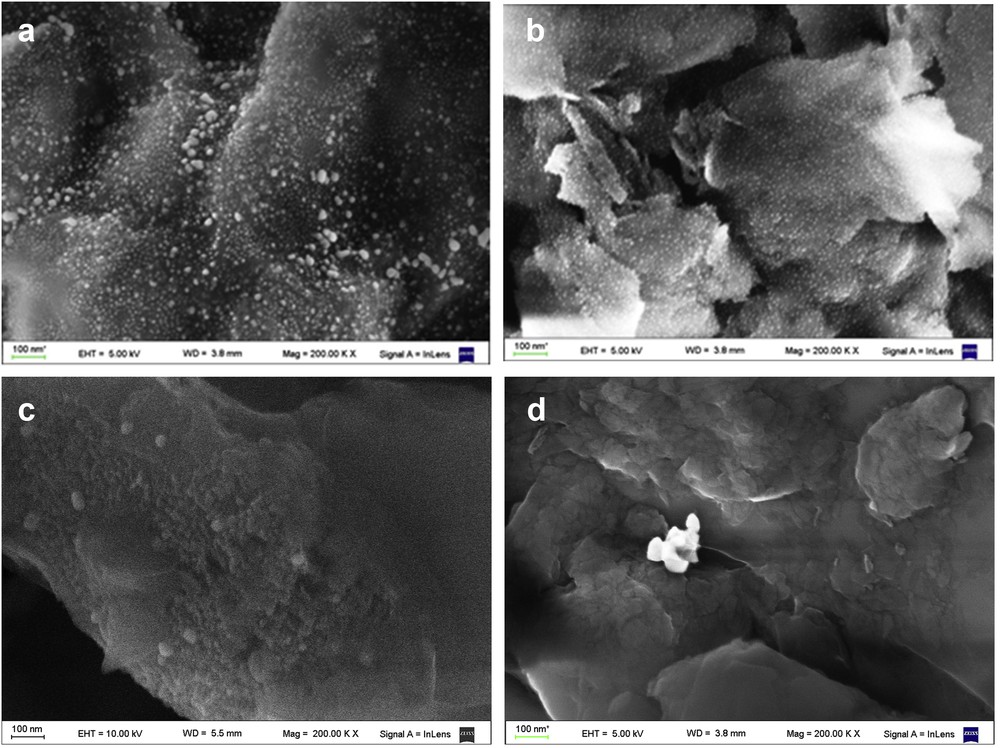
SEM images of the surface of following samples: (a) MMT–Ag, (b) MH0.5–Ag, (c) MH1–Ag, and (d) MH2–Ag samples.
The MH1–Ag and MH2–Ag samples (Fig. 6c and d) did not show the formation of the same scattered silver particles as those found in MMT–Ag or MH0.5–Ag samples (Fig. 6 a and b). However, the silver agglomerates (of around 30–50 nm or greater than 50 nm for MH1–Ag and MH2–Ag samples, respectively) present (see also Fig. S2 in Supplementary information) indicated that the amount of HDTMA+ strongly influences the formation and growth of Ag nanoparticles.
The Dapp values obtained in aqueous media for all samples are summarized in Table 3. An increase in agglomerates size, up to five times the initial Dapp value of the MMT sample, with surfactant loading was found. However, the presence of Ag produced a lower difference in Dapp value (ΔDapp in Table S1, in Supplementary information) with surfactant loading increase than those obtained for the respective OMMT samples, with the exception for MH2–Ag with respect to MH1–Ag samples, where the formation of Ag nanoparticles was evidenced (Fig. 6d). Moreover, the relative increase within OMMT–Ag samples attained up to almost seven times that of the MMT–Ag sample.
Dapp values for indicated samples.
| Sample | Dapp (nm) | |
| Without Ag | With Ag | |
| MMT | 540 ± 28 | 357 ± 7 |
| MH0.5 | 1079 ± 54 | 785 ± 28 |
| MH1 | 1925 ± 382 | 876 ± 38 |
| MH2 | 2714 ± 275 | 2492 ± 227 |
3.5 XRD analysis
To identify the presence of silver crystalline species, as observed using SEM (Fig. 6), the full XRD patterns of OMMT–Ag and MMT–Ag samples were recorded (Fig. S4 in Supplementary information). For OMMT–Ag samples the presence of peaks at 38.44 and 44.68° (2θ) was attributed to the (111) and (200) planes of metallic silver, respectively [47]. Furthermore, MH2–Ag sample exhibited three intense peaks at 30.94, 44.36, and 55.04° (2θ) associated with the (200), (220), and (222) crystallographic planes of AgBr, respectively [47,48]. In the MMT–Ag sample the (111) and (200) reflections of Ag0 were not observed. This behavior was in agreement with that found in previous work, where the presence of Ag2O or AgO compounds and/or the formation of SiOAgOH− at the MMT surface were identified using X-ray photoelectron spectroscopy in a similar MMT–Ag sample [9].
Changes in the interlayer space thickness of the MMT sample because of the incorporation of Ag and/or HDTMA+ were followed through the shift in the basal peak (001) (Fig. 7). The basal peak asymmetry indicated heterogeneous interlayer thickness. To solve the peaks that generate this asymmetry, mathematical deconvolution was applied.
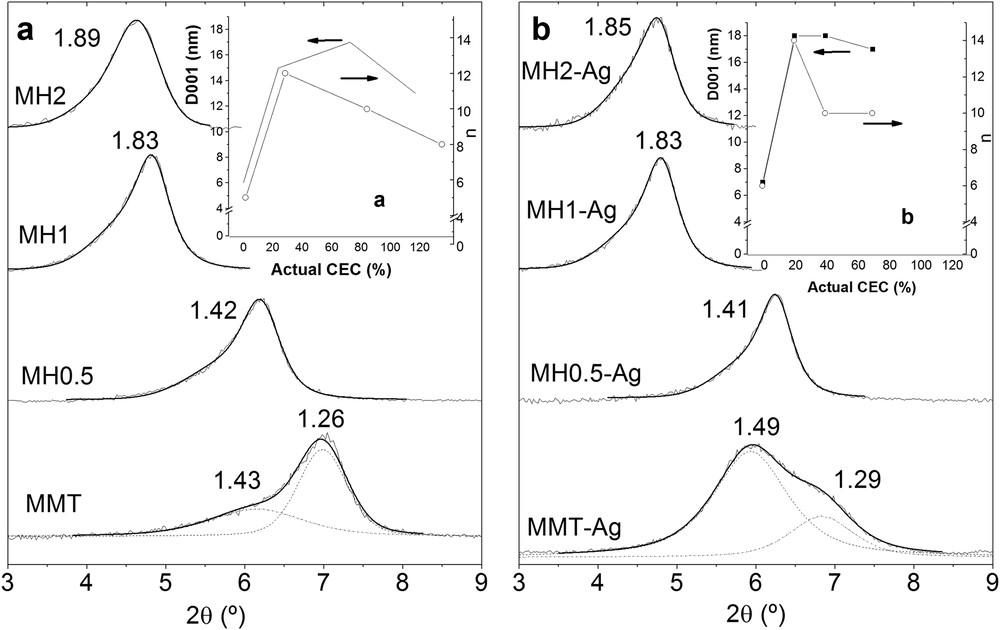
XRD patterns of (a) MMT and OMMT and (b) MMT–Ag and OMMT–Ag samples. Insets indicate the D001 value versus the actual CEC. Basal space values are expressed in nanometers.
The peak deconvolution (R2 = 0.99) of MMT sample indicated 001 values at 1.26 and 1.43 nm, assigned to the presence of hydrated Na+ and Ca2+ in the interlayer [49], as indicated by the structural formula.
Basal peaks of OMMT samples shifted to lower angles with respect to the MMT sample and also showed asymmetry at lower angles, which indicate the increase in interlayer thickness and different arrangements of HDTMA+, respectively. The basal spaces for MH0.5, MH1, and MH2 samples were 1.42, 1.83, and 1.89 nm, and by subtracting the space of dehydrated MMT (0.97 nm), the interlayer thickness was 0.46, 0.86, and 0.92 nm, respectively, which reveals the HDTMA+ entrance at the interlayer with different arrangements [46]. The previous TG analysis indicated that the percentage of organic mass loss by exchange cation, which is produced at the interlayer (mechanism 2), in MH0.5 and MH1 samples (Table 2) remained almost constant, whereas the interlayer thickness of MH1 sample was 0.4 nm wider than that of MH0.5 sample, pointing out a reorganization of HDTMA+ inside the interlayer of MH1 sample, in agreement with He et al. [44]. However, the interlayer expansion of MH2 sample arose from an increase and also a reorganization of HDTMA+ in the interlayer, without reaching a full cation exchange that was of around 23% CEC calculated from the TG mass loss of mechanism 2 (Table 2).
The Ag+ addition to MMT sample (MMT–Ag) produced a broadening of the 001 reflection peak (Fig. 7b) with respect to that of MMT sample, with a shoulder at high angle values, which indicated a different heterogeneous interlayer space than that found for the MMT sample. This reflection peak deconvolution (R2 = 0.997) indicated 001 values at 1.49 and 1.29 nm with an area ratio = 3.25. The first peak evidenced the presence of Ag+ ions in the MMT interlayer, as tetra-aquo (Ag[H2O]4+) [9], whereas the peak at 1.29 nm could be because of some hydrated Na+ remaining in the interlayer.
There was no evidence of significant changes in the 001 value of OMMT–Ag samples (Fig. 7b) with respect to those of the counterpart OMMT samples (Fig. 7a). This behavior cannot confirm the entry of Ag+ in the interlayer, because of the larger size of the HDTMA+ than the Ag+ molecule that can screen this entry.
To determine whether silver addition affects the crystalline domain size (D001) and/or the average number of clay platelets (n) with high crystalline order, both of these parameters were calculated and plotted as a function to the actual % CEC (Fig. 7 insets).
For OMMT samples (Fig. 7a inset), D001 increased with HDTMA+ loading up to 17 nm for the MH1 sample, and further HDTMA+ loading produced a fall to 13 nm for the MH2 sample, in agreement with [29], pointing out the impact of different surfactant loading in the (001) direction. Also the average number of platelets (n) increased with the presence of surfactant up to 20% actual CEC exchange (MH0.5 sample, Table 2) and decreased with further surfactant loading. This behavior was assigned previously [29] to a bridging interaction of the monolayer arrangement of organic cations between different clay basal planes resulting in an interconnecting function and the increase in stacking order. Although the bilayer arrangement when actual % CEC was higher than 20%, a disorder in the stacking direction of the layers was introduced, generating a lower average number of stacked platelets.
The presence of silver in OMMT–Ag sample (Fig. 7b inset) did not modify the D001 attaining a constant value of around 17 nm from 20.2% to 70.9% actual CEC (Table 2), because of the surfactant loss after Ag addition and washing process. However, the n value increased up to 14 for actual 20% CEC (MH0.5 sample) and fell to 10, remaining constant with further surfactant loading (from actual 39.9% to 70.9% CEC, Table 2).
As was indicated in the TG analysis, HDTMA+ adsorption started in the interlayer with a low degree of physical adsorption on the external clay surface (i.e., MH0.5 sample). Both results (XRD and TG) indicated that cation exchange was predominant and progressed even before reaching the CEC value of MMT, where surface adsorption was activated mainly by a van der Waals force mechanism, as was seen for MH1 and MH2 samples (Table 2). This HDTMA+ surface increase could decrease the negative electric charge of MMT [46], inducing the adsorption of HDTMA+ together with its respective counterion Br− (i.e., as HDTMABr) in the MH2 sample [28]. This behavior would explain AgBr formation in MH2–Ag sample (Fig. S4 in Supplementary information) and its absence in the MH1–Ag sample.
3.6 ζ Potential measurements
The ζ potential values obtained for MMT and OMMT samples (Fig. 8) agree with that obtained in previous work [46].
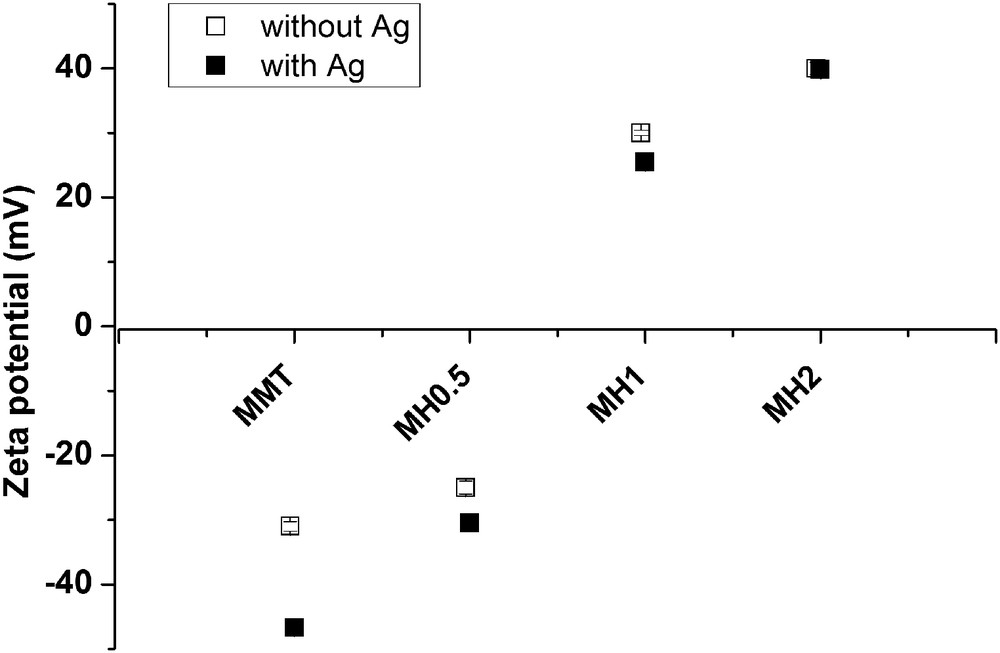
ζ Potential of the indicated samples at pH 6.
An increase in negative surface electric charge obtained for the MMt–Ag sample with respect to MMT (Fig. 8) was assigned previously to the appearance of SiOAgOH− at the MMT surface [9]. Also the important surface coating of the MMT–Ag sample by nanosilver particles (Fig. 6a) can contribute partly to the negative ζ potential value increase [50] with respect to that of MMT sample, because of the nanosilver particle negative ζ potential value (−40 mV, at pH 6 and KCl 10−3 M) [51,52].
Another likely effect that could lead to the increase in the negative surface electric charge of MMT–Ag with respect to that of MMT sample can also be considered, that is, a decrease in the support electrolyte concentration (KCl) [53] due to the formation of AgCl originated in the Ag desorption of this sample, as will be shown in Section 3.7 (Fig. 9). To calculate the decrease in the KCl concentration, the concentration of silver desorbed (16.4 mg L−1) in 10−3 M NaNO3 for the MMT–Ag sample was taken into account (Fig. 9), which originated 1.5 10−4 M of AgCl and consequently, the same decrease in the support electrolyte concentration (KCl). This decrease in the support electrolyte concentration could also partly justify the increase in the negative surface electric charge found.
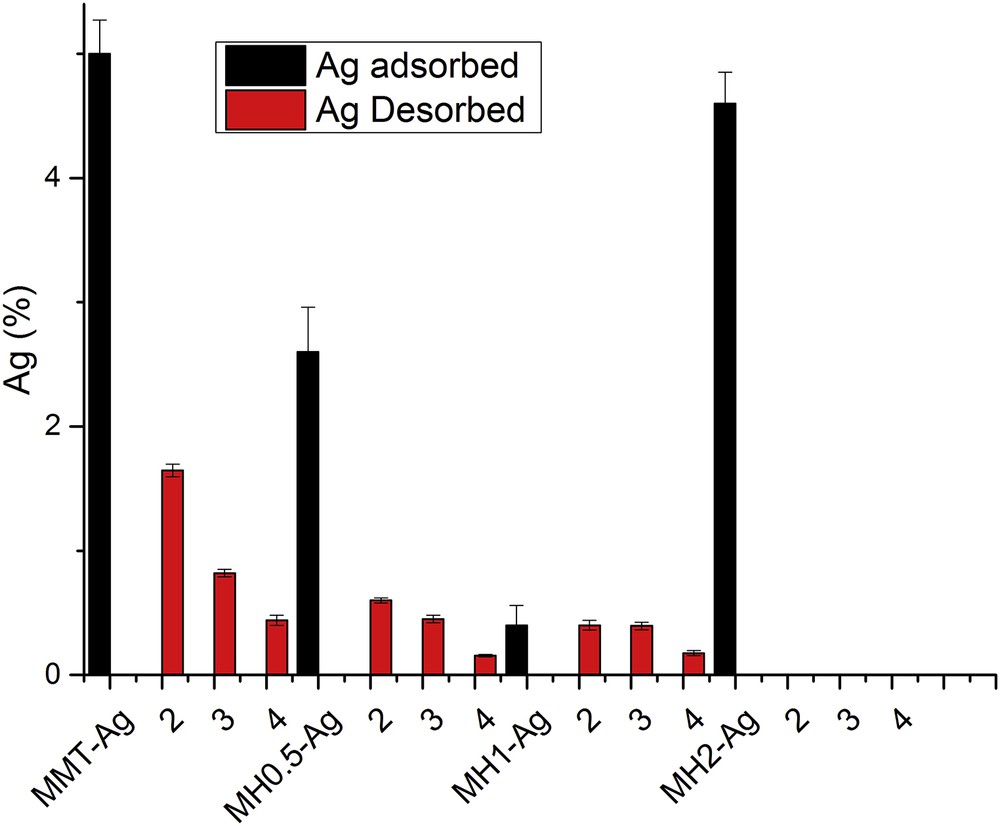
Ag percentage adsorption and desorption in different Na+ solutions after 24 h in the indicated samples. Numbers (2, 3, and 4) indicate 10−2, 10−3, or 10−4 M NaNO3, respectively, used in the desorption experiments for each sample.
Nanosilver particle coverage of the MH0.5–Ag sample (Fig. 6b) could also be responsible for the slight variation in the ζ potential value with respect to the MH0.5 sample, although their size was lower than those found in the MMT–Ag sample (Fig. 6b).
The ζ potential value of MH1–Ag sample shifted to a lower positive value with respect to the MH1 sample, a behavior that was in line with MH0.5–Ag sample, despite the larger nanosilver particle size of the first sample (Fig. 6c).
The close ζ potential values of samples MH2 and MH2–Ag (40 mV) could be explained by the generation of BrAg (Fig. S4 in Supplementary information) and the large size of Ag aggregates that should influence the electrical charge of the surface to a lesser extent.
3.7 Silver adsorption–desorption
The Ag% adsorption and desorption in all samples is summarized in Fig. 9. The amount of Ag% determined by X-ray fluorescence in the MMT–Ag sample corresponded to 56% of the MMT CEC, indicating that half of the initial Na+ has been exchanged by Ag+. An important decrease in adsorbed Ag was found with the actual HDTMA+ loading increase from 20.2% to 39.9% CEC (Table 2), attaining a minimum amount of Ag loading (0.4%) for the MH1–Ag sample, being assigned mainly to the increase in occupancy of the surface sites by the surfactant.
The Ag adsorbed when the actual HDTMA+ loading was 70.9% CEC (MH2–Ag sample) was 4.6% (or 42.3 mm equiv/100 g). This great amount of loaded Ag (around 50% CEC) could be assigned partly to an HDTMA+ interlayer exchange by Ag+, although around 23% CEC of the surfactant remained bound by cation exchange (Table 2). Also, the formation of BrAg, as shown by XRD analysis (Fig. S4 in Supplementary information), and the large size of Ag aggregates (Fig. 6d) could have contributed to the high Ag amount found.
The Ag+ desorption in the presence of different NaNO3 concentrations is also shown in Fig. 9. Malachová et al. [11] demonstrated that Ag+ loaded on raw MMT was almost fully exchanged at a Na+ concentration of 10−1 M. In agreement with previous reports, the MMT–Ag sample exchanged almost half the amount of Ag+ when 10−2 M NaNO3 was used, and subsequent decreases in electrolyte concentration produced a similar decrease in Ag+ desorbed. This behavior was explained by the reduction in the surface charge density resulting from the decrease in the electrolyte concentration [54].
The greater amount of silver desorbed for MMT–Ag than for OMMT–Ag samples could be explained by different surface sites available for Ag+ adsorption and its corresponding binding strength. In the MMT–Ag sample, Ag+ was bound to the interlayer (or inner surface) by ion exchange, whereas at the edges or sites of the outer surface it was bound to Al-OH or Si-OH by electrostatic bonding [9], which in turn modified the aggregate size (Table 3) due to different electrostatic attractions between the particles. The main Ag+ exchange by Na+ of the electrolyte within this sample would have also promoted the high silver desorption of around 33% of the initially adsorbed amount in the presence of 10−2 M NaNO3.
For OMMT–Ag samples different behaviors can be assigned for the silver desorption found. Particularly, for MH0.5–Ag, where an actual 20.2% CEC (Table 2) was exchanged by the surfactant, and silver adsorption was close to half of that of MMT–Ag sample (Fig. 9), 24% silver desorption was attained as compared with the initially adsorbed amount in the presence of 10−2 M NaNO3. For MH1–Ag and MH2–Ag samples, where the interlayer was more occupied by the surfactant (actual 39.9% and 70.9% CEC, Table 2), two opposite behaviors were found for the desorption of silver, attaining 100% and almost 0%, respectively, in the presence of NaNO3 10−2 M. The complete silver desorption found for the MH1–Ag sample indicated Ag-surface bonds with low strength. The null silver desorption found in the MH2–Ag sample would be assigned to the formation of BrAg (Fig. S4 in Supplementary information) and large size Ag aggregates (Fig. 6d).
3.8 Fungicidal activity
Fig. 10 shows the diffusion test results against A. alternate expressed as the mean ± SD of three experiments.

Inhibition zone diameter by agar diffusion tests against A. alternate for the indicated samples.
Raw MMT did not show fungicidal activity. However, all OMMTs presented clear inhibition zones against A. alternate around the samples, directly related to the HDTMA+ amount loaded. The presence of Ag in MMT–Ag sample increased the inhibition zone diameter as compared with the same sample without Ag+, and could be related to Ag desorption as shown in Fig. 9. For OMMT–Ag samples a synergistic effect against A. alternate with respect to the same samples without Ag was found. This synergistic effect was less than the sum of the individual fungicidal activities of loaded Ag or the surfactant, that is, the value of the inhibition zone diameter for the MH2–Ag sample was lower than the sum of those obtained for the MMT–Ag and MH2 samples (Fig. 10), despite the similar Ag amount found for MMT–Ag and MH2–Ag samples (Fig. 9). This behavior could be ascribed to a higher amount of silver nanoparticles in MH2–Ag than in MMT–Ag samples, as was indicated previously by SEM analysis.
The complex synergistic effect of the fungicidal activities found within the samples assayed can be assigned to different antifungal mechanisms reported for Ag+, nano-Ag particles, and HDTMA+ alone or loaded in different clays, as well as to the different sensitivities exhibited by the various species of fungi evaluated in the bibliography. Summing up, for Ag+ it has been suggested that the antifungal action is due to damage caused in the cell walls [11,55]. For nano-Ag particles, damage to the cell membrane, mitochondria, chromatin, and ribosome [56] and the activity exerted on the mycelia have also been indicated [57]. However, for cationic surfactants, the main mechanism is not cell lysis, but reversal of the electrical charge of the cell surface, from negative to positive [58], probably because of interfacial micelle formation of the HDTMA as aggregates at the cell surface as a step in the binding process [59].
4 Conclusions
OMMTs with different HDTMABr loading and further silver addition were obtained with the purpose of studying their influence on surface and structural changes, Ag loss, and fungicidal activity.
Textural changes and the decrease in specific surface values were found within OMMT with the increase in surfactant content, whereas further incorporation of Ag+ did not modify them.
FTIR and XRD revealed the presence of HDTMA–Ag complex and AgBr formation in the MH2–Ag sample.
The coexistence of HDTMA+ at the MMT interlayer and outer surface was identified by XRD and ζ potential measurements, and DTG pointed out two main interaction mechanisms: cation exchange and van der Waals forces. At low surfactant loading the cation exchange mechanism prevailed over van der Waals forces, inversely to what occurred at high surfactant loading.
The appearance of different Ag0 nanoparticle sizes in OMMT–Ag samples (and also AgBr in MH2–Ag sample) determined by XRD and SEM analyses, as well as the previously reported formation of SiOAgOH−, originated different changes in the electrical surface charge.
The sample with higher surfactant loading retained a silver amount close to that of MMT with null silver lixiviation. The bioassays against A. alternata showed a direct relation between fungicidal activity and surfactant loading, and a synergistic effect was produced by the additional silver load. These results would enable the use of these systems in protective coatings.
Acknowledgments
Financial support of MINCyT-ANPCyT, PICT-2014-0585, is gratefully acknowledged. J.V.-R., G.C., M.L.M, K.S., and R.M.T.S. are members of National Council of Scientific and Technical Research (CONICET), and A.M.F.S. and C.F.M. acknowledge CONICET fellowships. The authors thank Dr. N. Bellotti from CIDEPINT for the antimicrobial activity determinations.