

1 Introduction
Both anthropogenic activities (e.g., industry, energy production, transport, agriculture) and natural processes (biomass burning, lightning, vegetation, etc.) emit carbonaceous (CO, hydrocarbons) and nitrous species (NOx). When injected into the troposphere, these compounds are oxidized, and they can produce ozone (O3), a secondary trace gas species. At the global scale, ozone has a significant greenhouse effect [14]. At the subcontinental scale, close to inhabited areas, ozone impacts air quality through smog events and is responsible for both human health problems [45] and vegetation damages [2,12].
During the last 15 years, the drastic efforts to reduce ozone precursor emissions in Europe [44] led to a significant downward trend for highest ozone values (such as 90th percentiles), but were accompanied by an increase of the minima [22,42]. These changes of lowest values were due to reduced O3 titration in urban areas [22,24,26], to changes in stratospheric influence on tropospheric background [27] and to potential increase of background ozone [32]. Since adverse effects on human health and ecosystems are not only due to high ozone episodes, but also to long-term exposure to elevated background ozone levels, policy initiatives designed to reduce photooxydative pollution have to consider sustainable air quality in terms of both peaks and background elevation.
In the next decades, the emission of O3 precursors is expected to decline in the European Union (EU-25) until 2020, even under the assumption of accelerated economic growth [1,8]. However, air quality also depends on global background levels that influence regional ozone through long-range transport [3,11,21,23,28,29].
The global tropospheric O3 response to worldwide emission changes in 2030 was investigated by 26 state-of-the-art global chemistry–transport models in the framework of the PHOTOCOMP experiment [9,33] under three emission scenarios. They represent respectively the implementation of current air quality legislation in each individual country around the world (CLE scenario), the maximum reduction of emissions currently technically feasible (MFR scenario), and the scenario SRES-A2 developed by the Intergovernmental Panel on Climate Change. These scenarios can be considered respectively as ‘likely perspective’, ‘most optimistic’, and ‘most pessimistic’ [9]. The 26 models’ ensemble mean shows an 8% decrease in global surface O3 level in the most optimistic scenario (MFR) and increases of 5.2% and 15% for the CLE and SRES-A2 scenarios, respectively [9].
Furthermore, climate changes will occur, leading to global circulation modifications, temperature and precipitation changes able to affect chemistry itself, but also biogenic emission of ozone precursors [19]. These global changes can also be a threat for ozone abatement strategies.
Using a downscaling approach from a global into a regional chemistry–transport model, Szopa et al. [34] have quantified the respective effects of both worldwide and intra-European emission changes on surface ozone maxima over western Europe. The present study extends the analysis by describing modifications of global background ozone per regions due to emission changes. The change of human health exposure in Europe at the horizon 2030 is also assessed under various hypotheses on changes of emissions and meteorological conditions.
2 Modelling set-up
The global simulations are performed using the LMDz-INCA chemistry-climate model. The LMDz atmospheric General Circulation Model is run with a horizontal resolution of 3.75° in longitude and 2.5° in latitude, and uses 19 vertical σ–p levels extending from the surface to 3 hPa. A detailed description and evaluation of LMDz-INCA is given in Hauglustaine et al. [18] and Folberth et al. [13]. The simulations were done with the meteorological fields relaxed toward the 2001 ECMWF ERA40 reanalysis, which is a representative year in terms of both surface O3 variability and episodes over Europe over the 1997–2002 period [22]. For these runs, the simulations were spun up for three months and performed over one year.
For global anthropogenic sources, the monthly global emission datasets generated by IIASA [7] for CO, NOx and CH4, at 1° × 1° resolution, are used. They were extended to non-methane hydrocarbons (NMHC) emissions by Dentener et al. [9]. These emission projections show large geographical disparities (see Fig. 1). Considering the ‘maximum feasible reduction’ scenario, a systematic decrease of precursor emissions is predicted in 2030, affecting mainly the CO and NOx and, to a lesser extent, the NMHC fluxes in all regions. The NOx emission reduction reaches −59 to −71%. An equivalent CO reduction is planned in North and South America, whereas it is comprised in the −37 to −50% interval in Asia, Africa and Europe. The NMHC decrease ranges in the −36 to −52% interval. The pessimistic SRES-A2 projection infers an increase from a few tens of percents in North America and Europe to several hundreds of percents in South America, Asia and Africa. Finally, for the most realistic scenario (current legislation), the emission changes are smaller, but contrasted in terms of amplitude, sign, and family ratio. Over Africa, all emissions are expected to grow with a maximum increase for NOx emissions (+75%). In Asia, NOx emissions increase largely with a +47% augmentation compared with present-day emissions, whereas CO emissions decrease from 13% and NMHC increase slightly. Over Europe, both NOx and CO emissions are reduced by almost 26% with an increase of NMHC emissions from a few percents. Over America, emissions of carbonaceous species are expected to decline particularly for CO over South America, whereas NOx emissions increase slightly (<5 to 7%). Other sources of ozone precursors are kept to present-day values and are described in Folberth et al. [13]. Four global simulations were performed with LMDz-INCA using the present-day and future emissions (see Table 1) in order to evidence the impact of emission changes on ozone.
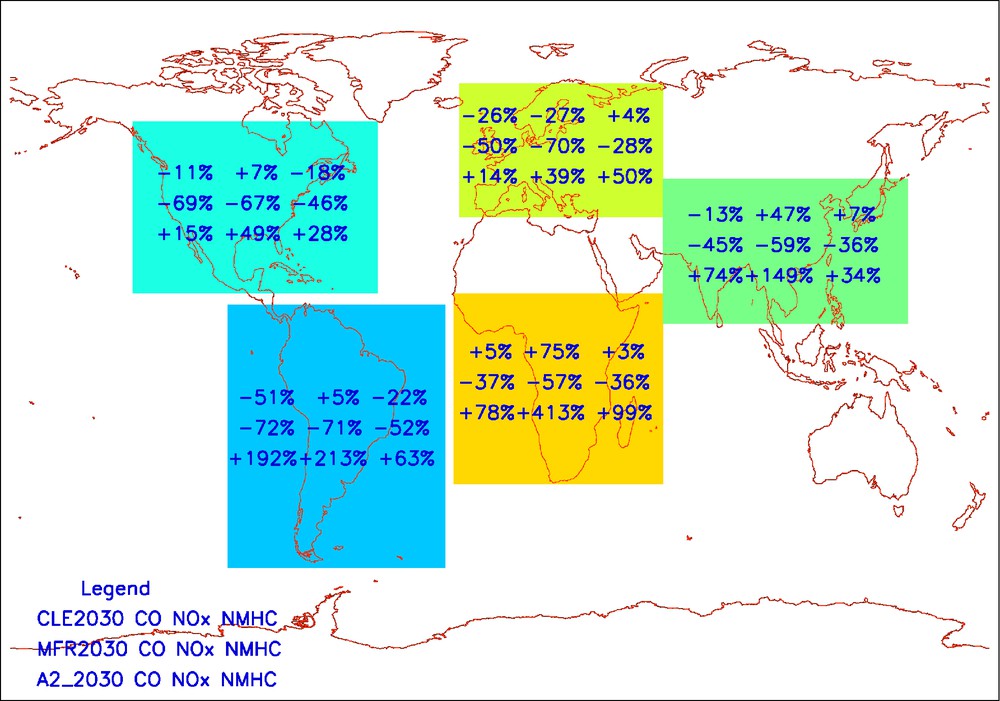
Relative changes of CO, NOx and NMHC continental emissions in 2030 compared with 2000 per region considering the CLE, MFR and SRES-A2 scenarios.
Fig. 1. Changements relatifs d’émissions continentales de CO, NOx et NMHC en 2030 par rapport à 2000, par région, pour les scénarios CLE, MFR et SRES-A2.
Set-up of the simulations performed
Tableau 1 Description des simulations effectuées
| Model | Emissions | Climate/Meteo | Boundary conditions from LMDz-INCA simulations | |
| W0 | LMDz-INCA | CLE 2000 | Winds from 2001 | |
| W1 | CLE 2030 | |||
| W2 | MFR2030 | |||
| W3 | A2 2030 | |||
| E0W0 | CHIMERE | EMEP2001 | 2001 (W0) | |
| E1W1 | EMEP 2001*CLE2030/CLE2000 | 2030 (W1) | ||
| E2W2 | EMEP 2001*MFR2030/CLE2000 | 2030 (W2) | ||
| E3W3 | EMEP 2001*A2_2030/CLE2000 | 2030 (W3) | ||
| E0W1 | EMEP 2001 | 2001 (summer) | 2030 (Wl) | |
| E1W0 | EMEP 2001*CLE2030/CLE2000 | 2001 (W0) | ||
| E0W2 | EMEP 2001 | 2030 (W2) | ||
| E2W0 | EMEP 2001*MFR2030/CLE2000 | 2001 (W0) | ||
| E0W3 | EMEP 2001 | 2030 (W3) | ||
| E3W0 | EMEP 2001*A2_2030/CLE2000 | 2001 (W0) | ||
| E1W1c | EMEP 2001*CLE2030/CLE2000 | 2003 (summer) | 2030 (W1) |
The daily averaged LMDz-INCA concentrations are taken as boundary conditions for the CHIMERE regional model [4,30], which has been used in many air quality studies (e.g., Vautard et al. [40]) and for operational air-pollution forecast in the Prev’air platform [20]. For this study, CHIMERE calculates gaseous chemical concentrations over Europe within a horizontal domain ranging from −10.5°W to 22.5°E and from 35°N to 57.5°N. The horizontal resolution (0.5° × 0.5°) allows one to capture roughly the local O3 maxima in large city plumes and downwind. Eight vertical hybrid σ–p levels represent the atmospheric column from the surface to 500 hPa. The dynamical fields are computed using the MM5 model (PSU/NCAR mesoscale model) driven by the ECMWF analysis for the years 2001 and 2003.
The regional simulation for present-day conditions uses the anthropogenic EMEP 2002 emissions [43]. For each of the three 2030 scenarios described previously (CLE, MFR and SRES-A2), these emissions were rescaled, for CO, NMHC and NOx, using, at each grid point, the ratios between the 2030 and the present-day emissions from the IIASA global inventories. As described in Table 1, CHIMERE was applied, with the LMDz-INCA boundary conditions, to investigate the response of European summer pollution to (1) both global and European changes in anthropogenic O3 precursor emissions (runs E1W1, E2W2, E3W3); (2) changes only in global anthropogenic emissions (present-day emissions for Europe; runs E0W1, E0W2, E0W3); (3) changes only in western European emissions (present day emissions for global chemistry in LMDz-INCA; runs E1W0, E2W0, E3W0). In the future, due to global climate change, the European climate is expected to be warmer, with increasing occurrence of heat-wave events [5]. A supplementary simulation was performed in order to quantify the impact of such a heat wave based on the 2003 meteorology (run E1W1c) in a context of future emissions. Biogenic sources are computed interactively, based on the Guenther et al. [17] parameterization, which depends on the meteorology via the PAR and temperature parameters. The summer 2003 simulation uses thus different biogenic emissions than the nine summer 2001 simulations.
Because they were not built to address the same scientific questions, there are numerous differences between the two models LMDz-INCA and CHIMERE. Among these differences, the spatial and temporal resolutions are critical. Hence, except for the first level, which is 70 m high, LMDz has a vertical resolution that varies between 300 m in the second layer to 500 m in the upper planetary boundary layer, whereas the first layer of CHIMERE is about 40 m high and the next levels in the boundary layer have vertical resolutions from 90 to 500 m. Moreover, emission fluxes in the global simulations vary on a monthly basis, whereas in the regional ones, emissions are hourly varying and both diurnal variations and segregations between week and weekend days are considered. Despite these differences, Fig. 2 shows that absolute differences of surface ozone due to emission changes between 2030 and 2001 simulated with both models are consistent for every emission scenario. Thus, the downscaling approach allows us to consider global ozone changes and their subsequent effects on the intercontinental transport via the global model, and to quantify the effects of these changes on air quality using the regional CTM.
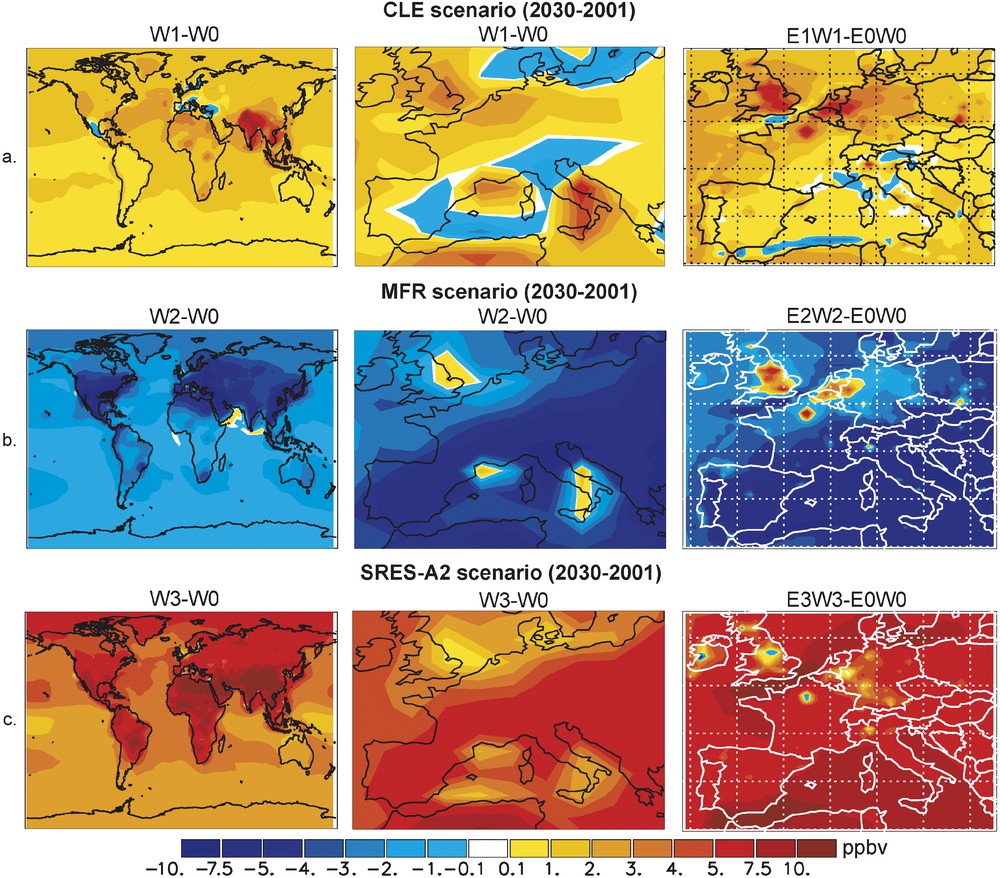
Summer (April–September) mean surface ozone differences in 2030 (compared with 2001) simulated over the world and over Europe with LMDz-INCA (left and middle rows) and over Europe with CHIMERE (right row) for a. the CLE scenario (top), b. the MFR scenario (middle), c. the SRES-A2 scenario (bottom).
Fig. 2. Différences d’ozone de surface en été en 2030 (comparé à 2001) simulé pour l’ensemble du globe et en Europe avec LMDz-INCA (à gauche et au milieu) et sur l’Europe avec CHIMERE (à droite) pour a. le scénario CLE (en haut), b. le scénario MFR (au milieu), c. le scénario SRES-A2 (en bas).
3 Present-day simulation and skills of the models
The global LMDz-INCA results for present day conditions have been widely evaluated during the PHOTOCOMP experiment by comparison with observations as well as by intercomparisons with the results of 25 other models [9,33]. The skills of LMDz-INCA in simulating CO and NO2 columns were investigated respectively by Shindell et al. [31] and van Noije et al. [39] and the nitrogen deposition fluxes were compared with measurements by Dentener et al. [10]. Over most part of the troposphere, the LMDz-INCA zonal mean ozone distribution has a deviation lower than ±25% from the climatology of Fortuin and Kelder [15], obtained by merging satellite and sonde measurements covering the 1980–1991 period [16]. This deviation reaches 25 to 40% only locally in the equatorial upper free troposphere and in the northern tropical boundary layer as well as at high latitudes. These discrepancies are low considering the fundamental differences between a climatology based on scarce background observations and simulations performed for a specific year. From comparison with climatologies based on ozonesonde measurements [25,36,37], Stevenson et al. [33] showed mean biases of −0.96 and −2.57 ppbv (for the CTM and GCM versions respectively) and a RMSE reaching 4.96 and 5.04 ppbv, which is comparable with the ensemble mean statistics (bias = 4.80 and RMSE 5.0 ppbv). Finally, the response in term of O3 changes simulated by LMDz-INCA lies in the middle of the range of the 26 models [33].
Fig. 3 displays, for 254 European ground-based stations (located in rural, suburban, as well as urban areas), the correlation between ozone measurements and CHIMERE model's results for daily maximum over the entire summer 2001 (1 May to 31 August). This map confirms the good skill of the model in simulating such results as shown by van Loon et al. [38] and Vautard et al. [42]. Based on the same observational dataset, Szopa et al. [34] found, for this 2001 base-case simulation, a root mean square error of 9.14 ppbv, an averaged correlation (r) of 0.826, and a standard deviation ratio (σmod/σobs) of 0.88. However, the average correlation falls to 0.667 when considering the hourly values due to unfaithful simulation of nighttime ozone in CHIMERE. Furthermore, the occurrence of highest ozone values is found to be underestimated by the model due to its resolution (∼50 km), which does not allow us to capture smaller size patterns, such as city and industrial plume cores.
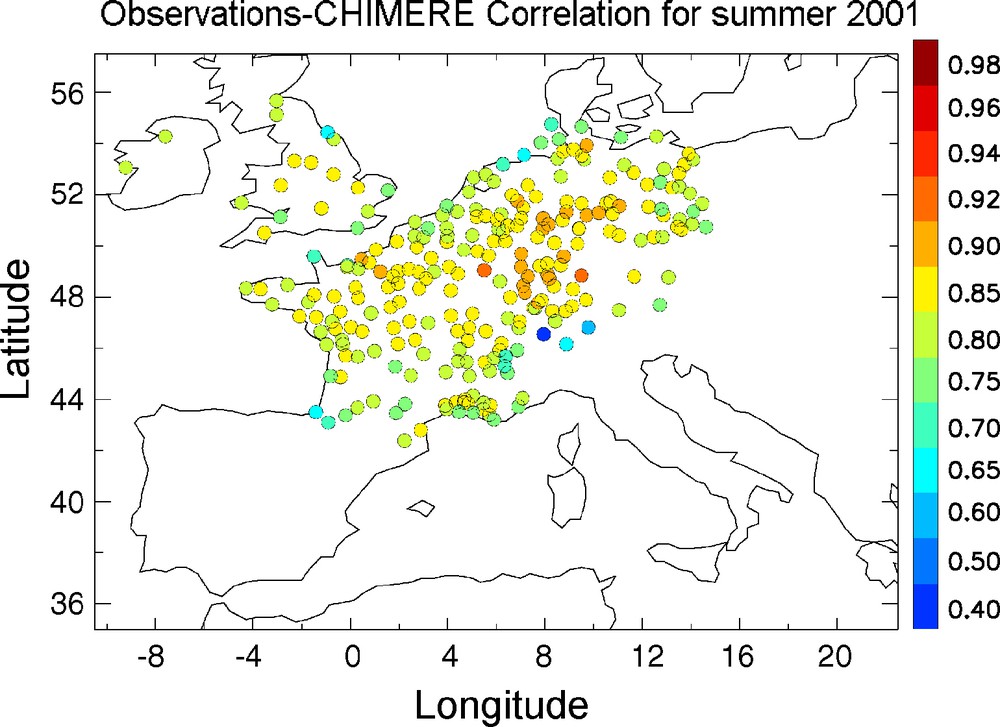
Correlation (r) between daily maximum surface ozone observations recorded at 254 stations and CHIMERE results over summer 2001.
Fig. 3. Corrélation (r) entre les maximums journaliers d’ozone de surface observés sur 254 stations et les résultats de CHIMERE sur l’été 2001.
4 Global impact of the 2030 worldwide emission changes
Fig. 4 shows the seasonal cycle of surface ozone and the surface ozone changes per region for several scenarios simulated by LMDz-INCA. As already shown in Fig. 2 for summer, the highest ozone deviation is found when considering the SRES-A2 scenario. It leads to an increase of the annual mean surface ozone concentration of 5–6 ppbv over Europe, South America, and North America, and of 8–10 ppbv over both Africa and Asia. These changes exceed 30% in April and May in South America and in April in Africa during the annual minima. Considering the most optimistic scenario, the lowest surface ozone decreases are calculated over South America and Africa (respectively −2.2 and −1.4 ppbv in average). These reductions are almost constant throughout the year. On the contrary, over North America, Europe, and Asia, the absolute ozone decrease is greater from April to September, with relative changes of the surface ozone exceeding 10% during these months. For the ‘current legislation’ scenario, a slight increase is simulated for the five continental regions. The absolute increase is quasi-constant all year long over South America (<1 ppb), North America (<2 ppb), Africa (∼2 ppb), Asia (∼4 ppb). The ozone change over Europe is characterized by a larger increase during winter (2–3 ppb increase between November and March) than during summer (0.6–1.6 ppbv). Since winter ozone levels are weak, such changes correspond to 5 to 10% of the surface ozone during these months.
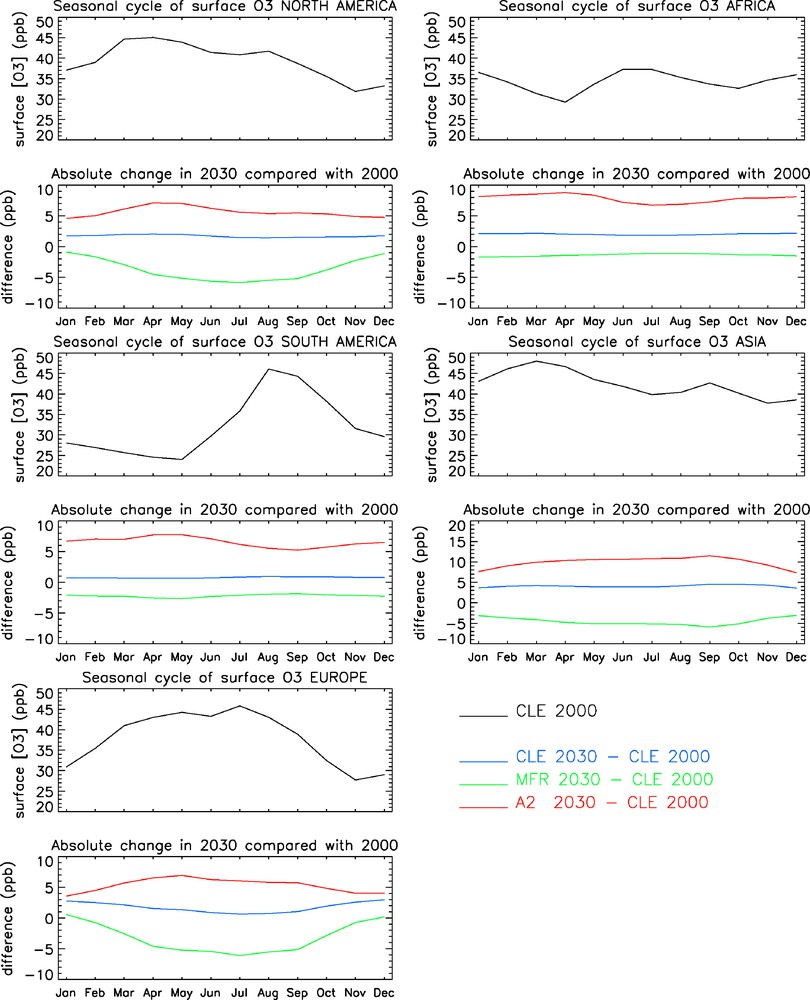
Seasonal cycle of surface ozone for 5 regions (shown in Fig. 1) and changes of this seasonal cycle induced by emission changes for three 2030 scenarios.
Fig. 4. Cycle saisonnier de l’ozone de surface pour cinq régions du monde (présentées sur la Fig. 1) et changements de ce cycle saisonnier induits par les changements des émissions pour trois scénarios pour 2030.
5 Impact of 2030 emission changes on summertime surface ozone over Europe
The SOMO35 index constitutes a relevant criterion for human health exposure as discussed in Amann et al. [1]. This criterion is defined as the sum of daily maximum 8-h mean ozone concentrations determined with a cut-off at 35 ppbv:
The SOMO35 index computed over the whole summer 2001 for the E0W0 simulation (base case) is displayed in Fig. 5a. This figure also depicts the ratio between the different CHIMERE simulations and this base case. The two extreme scenarios (MFR and SRES-A2) provide opposite, but spatially homogeneous responses with respect to the SOMO35 change. Hence, the health exposure is reduced by a factor of 0.4 to 0.8 over most part of western Europe in the MFR case and increased by a factor of 1.4 to 1.8 in the SRES-A2 case. However, the MFR scenario (E2W2) induces an increase of the integrated surface O3 in 2030 up to a factor of 1.6 over northern high emission spots. Such an increase is due to NOx saturated regimes (=VOC limited regime) in these areas due to both high emissions and low VOC/NOx ratio due to low biogenic VOC emissions [35]. In such chemical regimes, a decrease of NOx emissions leads to an increase of O3. As shown in Fig. 6, the number of hours with exceedance of the 90-ppb threshold (i.e. the information threshold in the existing EU Ozone Directive) undergoes similar changes. In the MFR case, the threshold becomes nearly never exceeded, except around Paris, Düsseldorf, Brussels, and Milan. On the contrary, in the SRES-A2 scenario, both the spatial extent of exceedance and their occurrence are greatly increased.
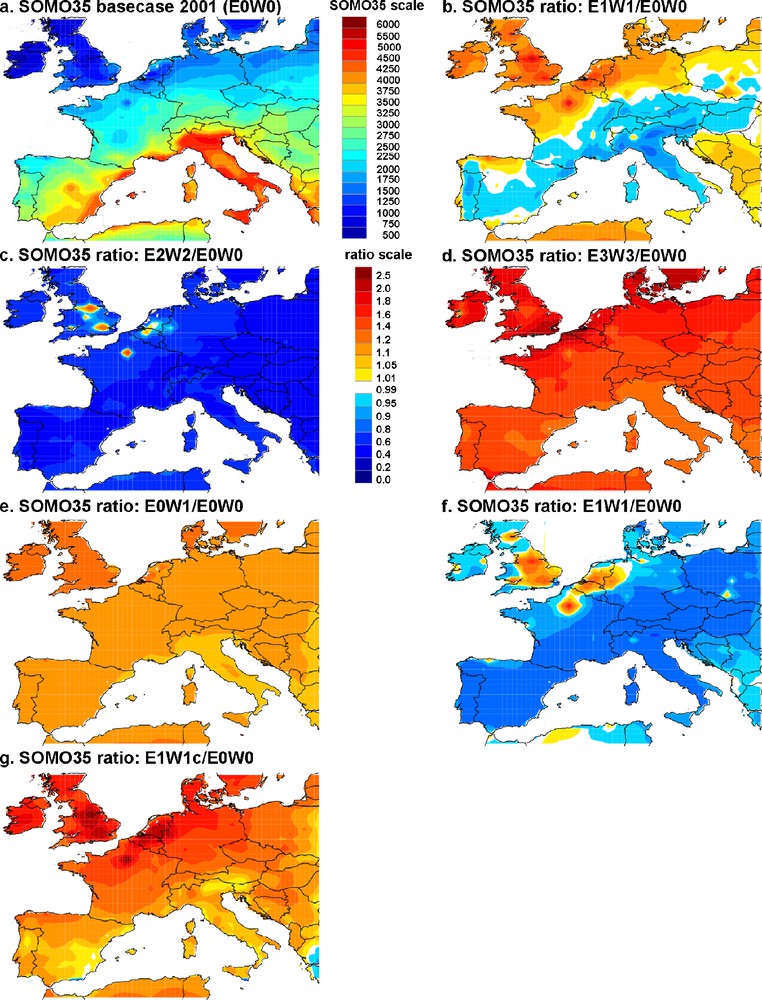
SOMO35 index for the summer 2001 a. and ratios between the summer 2030 and the summer 2001 simulated over Europe, with CHIMERE for b. the CLE scenario, c. the MFR scenario, d. the SRES-A2 scenario, e. the effect of CLE2030 at global scale (no emission change within Europe), f. the effect of CLE2030 emissions within Europe (no emission change in the world), g. the CLE2030 scenario and 2003 meteorology.
Fig. 5. Index SOMO35 pour l’été 2001 a. et rapports entre été 2030 et été 2001, simulés en Europe avec CHIMERE pour b. le scénario CLE, c. le scénario MFR, d. le scénario SRES-A2, e. l’effet des émissions CLE2030 prises en compte dans le monde (sans changement d’émission en Europe), f. l’effet des émissions CLE2030 prises en compte en Europe (sans changement d’émissions dans le monde), g. le scénario CLE en 2030 et la météorologie de 2003.

Number of hour with ozone exceedance of 90 ppb from 1 April to 30 September for a. the present-day CLE scenario, b. the CLE 2030 scenario, c. the 2030 MFR scenario, d. the 2030 SRES-A2 scenario, e. the effect of CLE2030 at global scale (no emission change within Europe), f. the effect of CLE2030 emissions within Europe (no emission change in the world), g. the CLE2030 scenario and 2003 meteorology.
Fig. 6 Nombre d’heures avec une teneur en ozone dépassant 90 ppb entre le 1er avril et le 30 septembre pour a. le scénario CLE en 2001, b. le scénario CLE en 2030, c. le scénario MFR en 2030, d. le scénario SRES-A2 en 2030, e. l’effet des émissions CLE2030 prises en compte dans le monde (sans changement d’émission en Europe), f. l’effet des émissions CLE2030 prises en compte en Europe (sans changement d’émissions dans le monde), g. le scénario CLE en 2030 et la météorologie de 2003.
For the most realistic future emission scenario (E1W1), the North and East of the CHIMERE domain (North of France and Germany, UK, Belgium, Netherlands, South of Denmark and Poland) are subjected to an increase of the SOMO35 index, whereas the South (Portugal, Spain, South of France, Italy, Switzerland, Austria, Hungary, Slovenia and South of Germany, Czech Republic and Slovakia) sees a decrease of ozone exposure (Fig. 5). The northern increase of human health exposure reaches widely a factor of 1.10 to 1.60 in the North and West of Europe and is lower than 1.10 in the eastern part of the domain. The decrease of exposure in the South is low, the factor of change being mainly comprised between 0.90 and 0.99, except in the North of Italy, where it reaches 0.80 to 0.90. The number and spatial extent of exceedances of the 90-ppb threshold are also reduced over the southern areas enumerated previously. In the northern area, except around Paris, both the horizontal extent and the number of peaks fall. Since similar conclusions are inferred when considering the AOT40 metric which is representative of the exposure of vegetation to ozone, it confirms that the 2030 changes tend to decrease the highest values, but to increase the mean and lowest values [34], and thus to modify the type of human and vegetation exposure.
6 Impact of European emission changes versus background and long-range transport modifications
In the two ‘extreme’ MFR and SRES-A2 scenarios, both worldwide and European changes lead to convergent effects (respectively reduction and increase) on SOMO35 index and 90 ppb threshold exceedances (not shown). As an exception, in northern cities where chemical regimes are NOx saturated, the intra-European emission changes induce opposite responses to the general behaviour. Figs. 5e,f and 6e,f separate for the CLE2030 scenario the respective effects of global emission changes (considering at the same time the present-day emission within Europe) and of European emission changes solely (considering present-day boundary conditions). Contrary to MFR and SRES-A2 cases, for the CLE2030 scenario, global ozone change induces an effect conflicting with that of regional modifications. Hence, the modifications of background ozone levels induce a slight but general increase, corresponding to a factor 1.05 to 1.34 of the SOMO35, due to long-range transport and background chemistry modifications. The highest increase (factor >1.2) is found over the United Kingdom and corresponds in fact to a relatively clean area, with a fairly low SOMO35 index for present-day conditions. The efforts done at the European level to improve air quality are opposite and would lead, if considered solely, to a decrease of SOMO35 ozone exposure by a factor of 0.80 to 0.99 relative to the 2001 level over most parts of continental western Europe. An exception is made in the northern highly inhabited regions, where the European emission change implies a significant SOMO35 increase of a factor of 1.2 to 2 around big cities of England, Belgium, the Netherlands, and the North of France and Germany. This contrasted response is due to the chemical regimes driving the O3 production. In this CLE2030 emission scenario, the VOC/NOx ratio increases in all Europe and, consequently, the O3 production is enhanced in these NOx-saturated areas. Regarding the 90-ppb threshold, the changes in boundary conditions (when neglecting European emission changes, run E0W1) almost do not affect the number of exceedances, showing that their impact is mainly on low ozone values. The decrease of the horizontal extent and the number of exceedances is almost entirely due to European emission changes. As the effect of background ozone modification is in some areas as large as the gain due to reduction efforts achieved by the European Union, it can counterbalance it and then lead to an O3 increase, despite the downward trend of European emissions (parts of Spain and France, northern Germany, Poland, Denmark, South of Sweden). However, the analysis of simulated exceedances of thresholds have to be considered with caution, as the highest maxima are underestimated by the model due to its horizontal resolution, impeding to capture the sharp and strong plumes in the vicinity of urban areas.
7 Consequences in a warmer Europe
Because of the global warming, the annual mean temperature is likely to increase in Europe in the future even more than the global mean, and the risk of summer drought is likely to increase in central Europe and in the Mediterranean area [5]. During summer 2003, Europe was subjected to a particularly extreme anomaly, characterized by exceptionally high temperatures and large precipitation deficits [6]. Such exceptionally long heat wave induced unusually persistent high ozone concentrations [41]. Vautard et al. 2005 [41] demonstrated the capability of CHIMERE to reproduce the effect of the 2003 heat wave on the surface ozone observed this summer. In the E1W1c simulation, we investigate the ozone levels that could be reached in such meteorological conditions, assuming the CLE2030 emissions. As shown in Fig. 5g, in such conditions, the SOMO35 is increased by a factor greater than 1.4 in the northern part of the domain and exceeds a factor of 2 around big cities compared with the 2001 level. In the South and East of the CHIMERE domain, the increase is smaller and comprised within a factor of 1.00 to 1.20. The exceedances of 90 ppbv rise also in intensity, mainly around Paris, London, Brussels, and in the Netherlands and northeastern Germany. Such results show that, even by carrying out realistic reduction of ozone precursor emission in Europe, the ozone levels are expected to increase significantly in the context of climate and ozone background changes both in term of integrated human/vegetation exposure and in exceedances of the information threshold.
8 Conclusion
A combination of global and subcontinental chemistry–transport models was used to investigate surface ozone changes in 2030 over western Europe under several anthropogenic emission scenarios. The consequences of (i) European emission changes and (ii) background composition and long-range transport modifications on summertime O3 were investigated under summer 2001 meteorological conditions. This modelling study shows that, for the most plausible future emission scenario based on the worldwide application of current local legislations, emission changes increase the globally averaged surface O3 concentration. This effect competes and locally offsets the potential gain in air quality that would be obtained thanks to the western European emission reductions solely. Accounting for both global and local emission changes would lead during summer to a degradation of the human health exposure to ozone in northwestern Europe and to an enhancement of the air quality in the South. However, except around Paris, the number of ozone peaks that exceed 90 ppbv is found to be reduced in 2030 for the ‘current legislation’ emission scenario. Assuming the increasing probability of heat wave occurrence in Europe in a global warming climate, a simulation with anthropogenic future emissions and with the specific 2003 meteorology and biogenic emissions was carried out. These conditions, which might be more frequent in the future, lead to a significant degradation of summertime air quality in terms of SOMO35 exposure as well as of occurrence and spatial extent of exceedance of the information threshold.
Acknowledgments
The authors acknowledge EMEP, IER (University of Stuttgart) and the UK Department of Environment for providing present-day emissions in Europe. The global emissions were provided by IIASA. They were reprocessed for the Photocomp experiment by F. Dentener (JRC) and D. Stevenson (IAES). The study was supported by the RETRO European project under contract No. EVK2-CT-2002-00170.