

1 Introduction
The livelihood of over 60% of the world's population depends upon the monsoons, of which the Asian summer monsoon is the largest. The monsoons (which mean “season”) are directly controlled by the annual course of the sun and represent in the tropics the most important phenomena in the seasonal cycle. Local agriculture and water resources can be greatly affected by the timing and the intensity of this event which brings, during some months, most of the total annual rainfall. Actually, while the main component of the monsoon is highly regular as it occurs every year, anomalies in the resultant rainfall total and in the daily distribution can be high, and impact greatly on crop yields. These anomalies are present at all time scales: intraseasonal (meaning here fluctuations of less than 90 days), interannual, decadal and multidecadal, and more or less expected in the climate change scenarios. They are controlled both through internal atmospheric dynamics and by oceanic and continental anomalies on local, regional or global scales, including complex scale interactions. In consequence, accurate and useful prediction of the monsoons is presently difficult to provide.
In this article, we focus on the Africa–India monsoon sectors during the northern summer. These two monsoon systems have been shown to share common temporal ranges in their fluctuations, being linked to common or contrasted climate processes. Various investigations using proxi data and recent climate models have demonstrated that both African and Asian monsoons have been very sensitive to paleoclimate fluctuations due to the variation of astronomical factors. For instance, it has been shown that these two monsoons were stronger or weaker during the mid-Holocene at 6000 BP or the Last Glacial maximum at 21,000 BP, respectively, providing higher or lower precipitation, respectively, during northern summer over the northern subtropical latitudes of Africa, India and East Asia [5]. In the following, we present over the present the main features of these monsoon systems variability from intraseasonal to multidecadal time scales and we detail the associated climate mechanisms. Then we analyse the climate change scenario for the 21st century.
2 Annual cycle of the monsoon systems and monsoons onset
Fig. 1 shows on the upper panel (left) the averaged July–September mean sea level pressure and 1000 hPa wind fields. Due to the contrast in the thermal capacity of the land surface and the ocean, the hot land masses in the northern hemisphere are located in a low pressure area (extending to 10°S in Central Africa) while high pressures, located over the oceans outside of the equatorial band, correspond to the subtropical anticyclones of Azores in the northern tropical Atlantic, and of Santa Helena and Mascareignes in the southern tropical Atlantic and Indian oceans, respectively. The large-scale cross-equatorial pressure gradient induced leads to southerly transequatorial low-level winds which bring a high content of moisture from the ocean to the land areas. When crossing the equator, these “trade” winds pass from an easterly to a westerly component and become the monsoon winds. They converge in the low-pressure areas with dry winds coming from the northeast and form a cyclonic circulation. The lower panel (left) of Fig. 1 shows half of the difference in the pressure and wind fields between the summer and the winter. This computation enables one to characterize the annual cycle of these low-level fields. It enhances the cross-equatorial pressure contrast seen on the upper panel, but the wind field is very similar to the summer one over the Indian Ocean and the Asian sector. This highlights the very large-scale character of the monsoon phenomena in this area. In the Atlantic–Africa sector, the signal is limited north of the equator, showing the more continental scale of the African monsoon.
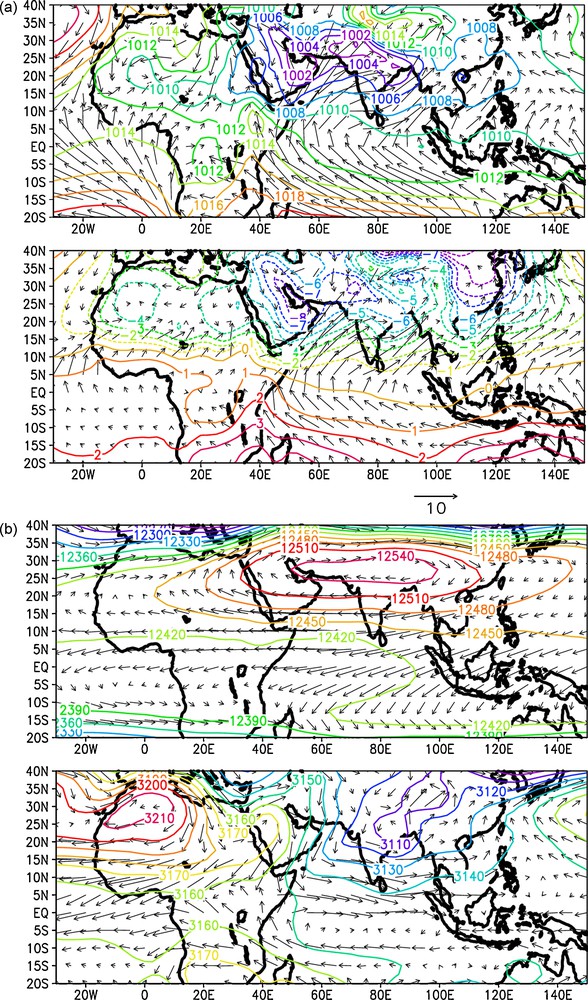
(a) upper Mean sea level pressure (contours; hPa) and 1000 hPa wind (vectors; scale 10 m/s) on July–September 1979–1998. (a) lower Half of the difference between July–September and December–February mean sea level pressure and 1000 hPa wind (m/s). (b) upper Geopotential height (contours) and wind (vectors; scale 30 m/s) fields at 200 hPa. (b) lower Geopotential height (contours) and wind (vectors; scale 10 m/s) fields at 700 hPa.
Fig. 1. (a) haut Pression réduite au niveau de la mer (contours ; hPa) et vent à 1000 hPa (vecteurs ; échelle 10 m/s) en juillet–septembre 1979–1998. (a) bas Moitié de la différence de la pression réduite au niveau de la mer et du vent à 1000 hPa entre juillet–septembre et décembre–février (m/s). (b) haut Hauteur géopotentielle (contours) et vent (vecteurs ; échelle 30 m/s) à 200 hPa. (b) bas Hauteur géopotentielle (contours) et vent (vecteurs ; échelle 10 m/s) à 700 hPa.
Fig. 1 also shows the mean summer atmospheric circulation at 700 hPa (bottom right panel) and at 200 hPa (top right panel). At 700 hPa, the circulation is highly contrasted between the Asian and the African monsoon. The high thickness character of the Asian monsoon circulation is highlighted by the maintenance of a clear cyclonic circulation at this level, while over Africa the low-level monsoon circulation has been replaced by a high pressure cell and an anticyclonic circulation controlling northeasterly winds over the Sahara and easterly winds over West Africa. This circulation corresponds to the top of the Saharan heat low and is associated with divergent winds inducing, in particular, a northerly return flow at this level. The mean easterly winds maximum over West Africa corresponds to the so-called African Easterly Jet, an unstable jet in which easterly waves develop and can trigger the initiation of mesoscale convective systems [66]. At 200 hPa level, a high geopotential height belt extends from East Asia to Africa controlling easterly winds on its southern border, the so-called Tropical Easterly Jet [33]. This is the sign of the continental scale monsoon system and of the associated meridional Hadley-type circulation transporting high energy air from the monsoon areas towards the southern hemisphere [60].
The large-scale extension and strength of such monsoon circulations is explained by the large release of latent heat by convective systems within this circulation, due to the low-level large scale convergence and mid-level upward motions in the southern Hadley-type circulation. This is well highlighted by the satellite detection of the InterTropical Convergence Zone (ITCZ), the area of convective systems development and rainfall maximum (Fig. 2). Consistent with what is observed through the large-scale atmospheric circulation, the Asian monsoon rainfall field has a wide extension covering, in summer, the area from 10°S to 30°N east of 60°E, while the African monsoon rainfall field is limited between the equator and 20°N. The meridional cross-sections of the rainfall field are shown on Fig. 2 over West Africa (top right) and over India (bottom right).
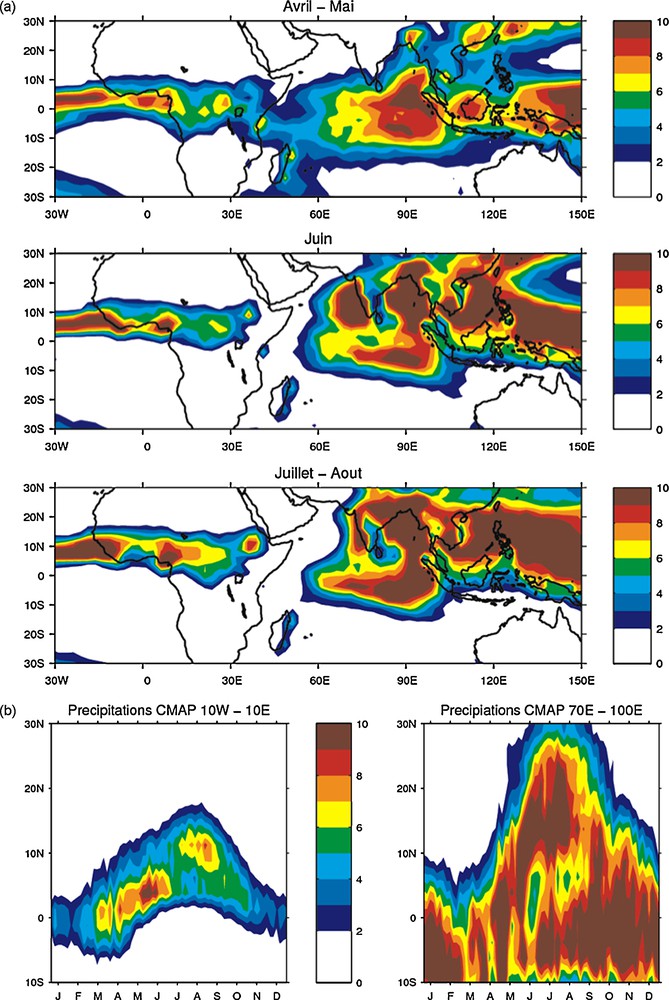
Satellite rainfall estimate (mm/day, CMAP data set). Mean fields of April–May, June and July–August averaged over 1979–2006 (a). Meridional cross-section from January to December averaged over 10°W–10°E ((b) left) and over 70°E–100°E ((b) right).
Fig. 2. Estimation de précipitation par satellite (mm/jour, données CMAP). Champs moyens avril–mai, juin et juillet–août moyennés sur 1979–2006 (a). Section méridienne de janvier à décembre moyennée sur 10°W–10°E ((b) gauche) et sur 70°E–100°E ((b) droite).
Over West Africa, the meridional displacement of the ITCZ is not a smooth one, but is characterized by a succession of active phases and pauses in the convective activity. These different steps have been identified statistically [44]. Two of them are located at the time of the first rainy season along the Guinean Coast in April and May; the third one is what is called the “monsoon onset” at the end of June, and a weaker one occurs during the monsoon season in August. The monsoon onset is the strongest one and corresponds to a temporary weakening of the convective activity followed with an abrupt shift to the north of the ITCZ, from 5°N to 10°N [19,43,62]. Its average date is June 24th, with a standard deviation of 7 days. The mechanism associated to this abrupt ITCZ shift is still unclear. An hypothesis highlights the role of the Saharan thermal low, which increases at the time of the onset, leading to higher moisture advection inland, and which could be due to some interactions with the North Africa orography [13,62] combined with the spatial distribution of albedo and net shortwave radiative budget at the surface [55]. Recently, a more comprehensive explanation has been provided based on the concept of inertial instability of the monsoon system [20,65]. A net supply of moisture and condensational heating into the lower troposphere around the end of spring is destabilizing the monsoon circulation, creating a pressure gradient that introduces an inertial instability. This is followed by a meridional shift of mid-tropospheric meridional wind convergence maximum from the coast into the continental interior. This, in turn, introduces a net total moisture convergence, net upward moisture flux and condensation in the upper troposphere, and an enhancement of precipitation in the continental interior.
In the Indian sector, the convection is centred near the equator until mid-May. Then the monsoon sets up with a rapid northward shift of the ITCZ, which reaches its northernmost latitude in mid-July while another rain belt is still present between the equator and 10°S. The simultaneous occurrence of these two rain belts at two different latitudes is due to the existence of active and break phases in the Asian monsoon characterized by a SW–NE propagation of rain bands ([17]; see next section). However the dynamic and thermodynamic conditions over the Indian region must be ready for the onset, otherwise these pulses could lead to a “bogus” onset. The monsoon onset phase of Asia is lasting about one month: it is observed over the Bay of Bengal at the beginning of May, then over the South of the China Sea around mid-May et finally over the Indian sub-continent and China at the beginning of June [9]. The precise onset dates depend on the phasing of the northward propagating activity, which can lead to either delayed (as in 1979) or early (as in 1984) onset [17].
Thus the seasonal cycle of these two monsoon systems is not regular, but is evolving step by step where the intraseasonal time scale plays a very important role. In particular, the convective and circulation activity at such a time scale during spring and the beginning of summer has a significant impact on the onset of the monsoons.
3 Intraseasonal variability
Fig. 3 provides an example of such intraseasonal rainfall variability in the African (left) and the Indian (right) monsoon for one particular year. Over the Sahel for the year 1968, the seasonal cycle of rainfall over this area is clear with low rainfall in May and October and the highest values during the northern summer when the ITCZ is at its northernmost latitude. Day-to-day fluctuations are also evident, characterizing the influence of synoptic scale weather systems like the African easterly waves and of the mesoscale convective systems. Moreover, we can notice sequences of more than 10 days of persistent high or low rainfall amounts. A wavelet diagram (not shown) enables one to quantify this intraseasonal time scale variability as a intermittent signal with more variance within two period intervals, between 10 and 25 days, and between 25 and 60 days [24]. Over India, synoptic disturbances are also presented with time scales of 5 to 7 days even if their characteristics (monsoon depressions) are different from the African easterly waves. At longer time scales, a characteristic feature of monsoon rainfall is prolonged spells of dry and wet conditions often lasting for 2 to 3 weeks, leading, as seen in 1972, to extended periods of above-normal rainfall conditions (active phase of the monsoon), followed by extended periods of below-normal rainfall conditions (break phase of the monsoon).
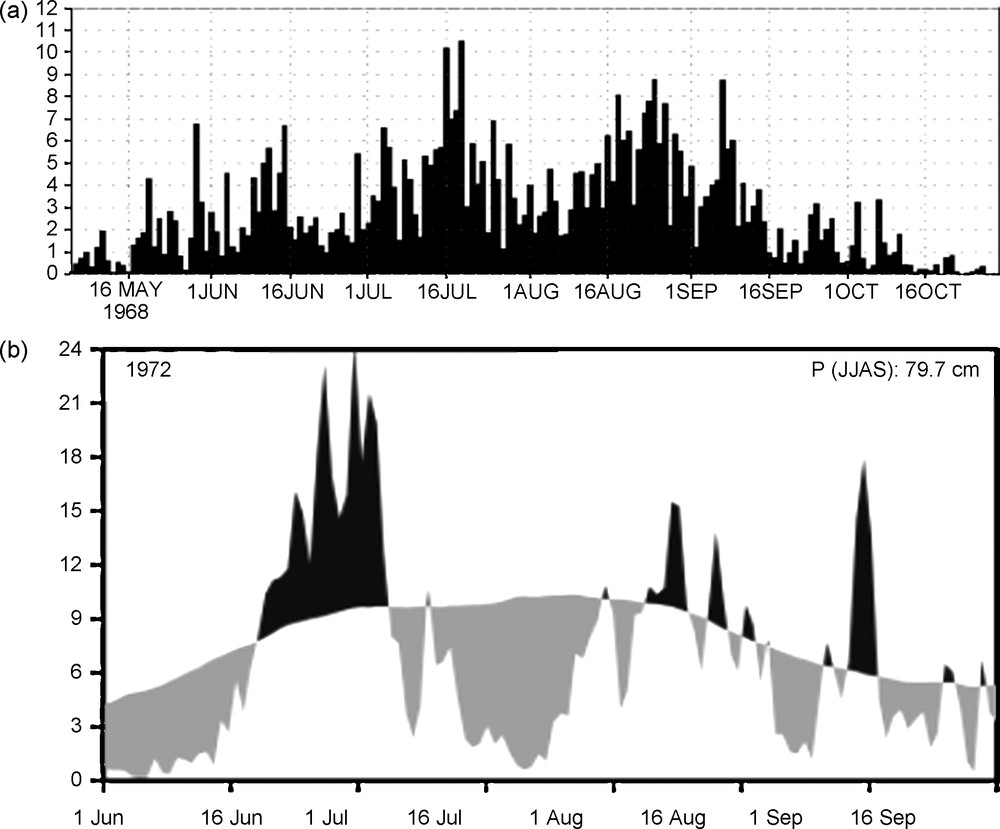
(a) Daily Sahel rainfall index (mm) in May–October 1968 averaged over 12.5°N–15°N/10°W–10°E (IRD data set). (b) Daily India rainfall index (mm) in June–September 1972 averaged over 10°N–25°N/72°E–87°E from Indian stations [16].
Fig. 3. (a) Indice régional de précipitations quotidiennes sur le Sahel (mm) en mai–octobre 1968, calculé sur la zone 12.5°N–15°N/10°W–10°E (données IRD). (b) Indice régional de précipitations quotidiennes sur l’Inde (mm) en juin–septembre 1972 calculé sur la zone 10°N–25°N/72°E–87°E à partir de données stations [16].
Many studies have investigated for several decades the atmospheric patterns and associated dynamics to explain the observed intraseasonal rainfall variability over India, while similar studies over Africa are recent and not so numerous. In the following, two examples of such patterns are shown over Africa and over India. These two examples have been chosen because they represent the dominant modes of variability at these time scales and because they are not embedded to only one monsoon system but also show some connections with the other monsoon system. A few other modes exist but the space is too limited here to detail them. Their description can be found in the list of references provided in the text.
Fig. 4 shows the time sequence of the main mode of intraseasonal variability of convection over West and central Africa filtered between 10 and 25 days (defined from an extended orthogonal function analysis), called here the “Guinean mode” [46,48]. This is shown through Outgoing Longwave Radiation (OLR) variations that characterize the intensity of convection within the Tropics (low OLR values correspond to cold top clouds associated with deep convective activity and high precipitation amount). This composite sequence is based on strong minus weak convective intraseasonal events. We retained the dates t0 where a Guinean mode index is maximum (respectively minimum) and its deviation from its mean for each year is greater (respectively lower) than one standard deviation to define a dry (resp. wet) phase. This time sequence goes from t0 – 6 days to t0 + 6 days. It shows that the ITCZ convection increase is associated with a quasi-stationary zonal dipole of convection whose dimension is larger than the West African monsoon domain, with its two poles centred along the Guinean coast and between 30°W and 60°W in the equatorial Atlantic [47]. This dipole pattern is controlled both by equatorial atmospheric disturbance propagating eastward between its two poles and by land surface processes over Africa, inducing combined fluctuations in surface temperature, surface pressure and low-level zonal winds off the coast of West Africa. When convection is at a minimum over West and central Africa, a lack of cloud cover results in higher net shortwave flux at the surface, which increases the surface temperatures and lowers the surface pressures. This creates an east–west pressure gradient at the latitude of both the ITCZ (10°N) and the Saharan heat low (20°N), leading to an increase in eastward moisture advection inland. The arrival from the Atlantic of the positive pressure signal amplifies the low-level westerly wind component and the moisture advection inland leading to an increase in convective activity over West and central Africa. Then the opposite phase of the dipole develops. This time sequence enables to point out a mean periodicity of about 12 days. Propagation of the convective envelope and of the associated 200 high-levels velocity potential anomalies (describing the large-scale vertical velocity patterns, with negative values for upward motions) is detected from the eastern Pacific to the Indian Ocean.
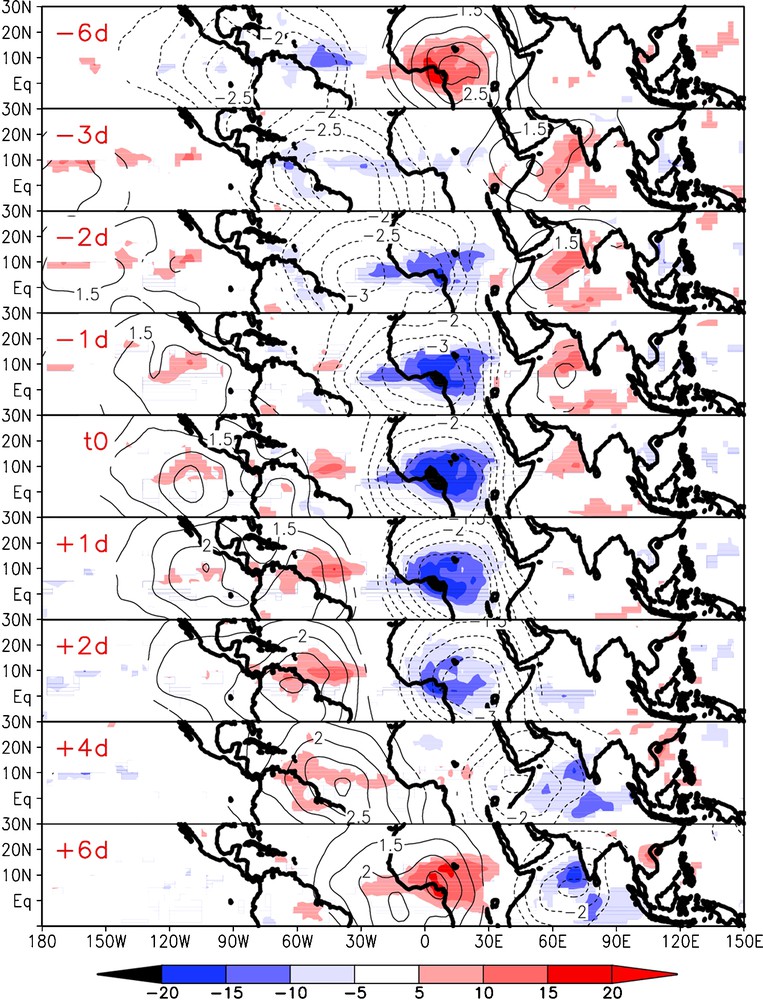
Composite time sequences based on the Guinean mode index. We retained the dates (t0) where this index is maximum (minimum) and its deviation from its mean is greater (lower) than one standard deviation to define a weak (strong) convective phase of the Guinean mode. The respective strong minus weak convective composite sequence is shown for the 10–25-day filtered OLR (W m−2; shaded) and unfiltered 200 hPa velocity potential (106 m2 s−2; contours) fields on June–September 1979–2000. This sequence goes (top to bottom) from t0 – 6 days to t0 + 6 days with irregular lags (days are marked in the left upper corner). OLR and velocity potential values are displayed when significant at the 90% level.
Fig. 4. Séquence composite basée sur l’indice du mode guinéen. On a retenu les dates (t0) où cet indice est maximum (minimum) et son écart à la moyenne supérieur (inférieur) à un écart-type pour définir une phase convective faible (forte) du mode guinéen. La séquence composite de la différence entre phases fortes et faibles est montrée pour le signal filtré 10–25-jour de l’OLR (W m−2 ; couleurs) et le potentiel de vitesse à 200 hPa non filtré (106 m2 s−2 ; contours) sur juin–septembre 1979–2000. Cette séquence va (de haut en bas) de t0 – 6 jours à t0 + 6 jours, avec des pas de temps irréguliers (les jours sont inscrits dans le coin en haut à gauche). Seules les données significatives à 90 % sont tracées.
A similar analysis has been performed on the 25–90-day periodicity domain. Fig. 5 shows the resulting time sequence of the main mode of intraseasonal variability of convection over West and central Africa within this range. This time sequence goes from t0 – 20 days to t0 + 10 days. These patterns at t0 show an enhancement of convection at t0 over most of West and central Africa, with values higher than 15 W m−2 and peaking at 25 W m−2 over the Cameroon highlands. The time sequence of this mode shows a westward propagation on its northern part, negative OLR anomalies beginning to occur just northeast of Lake Chad. They grow and propagate westwards north of 7.5°N up to t0 and finally dissipate over the northwestern part of Africa. South of 7.5°N, the signal appears mainly as stationary, increasing and weakening simultaneously along the Guinean coast and central Africa.
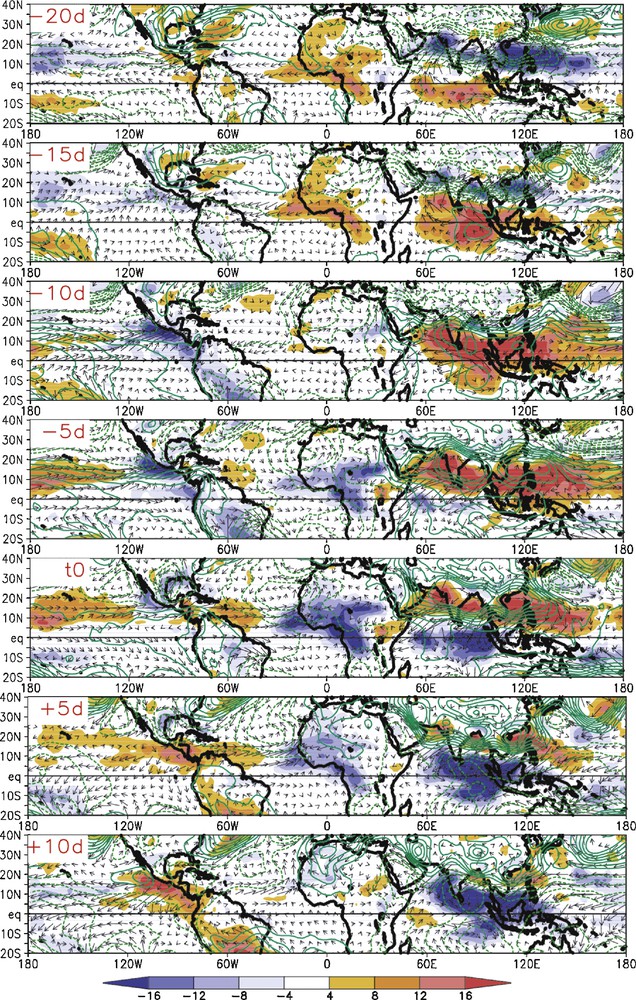
Composite sequence based on the first mode of the EOF analysis of 25–90-day filtered OLR. Time sequence of strong minus weak convective events for June–September 1979–2000 based on the corresponding PC time series for OLR (W m−2; colours), 925 hPa geopotential height (contours; step 2 mgp) and wind (vectors; m s−1) from t0 – 20 to t0 + 10 days with a time lag of 5 days.
Fig. 5. Séquence composite basée sur le premier mode d’une analyse en EOF du signal d’OLR filtré 25–90-jours. La séquence composite de la différence entre phases fortes et faibles est montrée sur juin–septembre 1979–2000 basée sur la première composante principale pour l’OLR (W m−2 ; couleurs), la hauteur géopotentielle (contours ; intervalle 2 mgp) et le vent à 925 hPa (vecteurs ; m s−1) de t0 – 20 to t0 + 10 jours, avec un pas de 5 jours.
While this detection has been performed over Africa, the main mode highlights a strong signal in the Asian sector associated with the break and active phases of the Indian monsoon [25]. As shown in other studies (see [17], for instance), this signal is characterized by two axes of propagation. There is first a meridional dipole of convection moving northward. At t0 – 20, a positive OLR anomaly pole is located at the equator while convection is enhanced over India, corresponding to an active phase in the Indian monsoon. The equatorial positive OLR anomaly grows and reaches India at t0 – 10 consistent with the occurrence of a break in the Indian monsoon up to t0 + 5. Then an active phase begins with the northward propagation of the following negative OLR anomaly. Second, we see also an eastward propagation of these positive OLR anomalies across the tropical Pacific and towards the eastern Pacific along approximately 10°N. This signal propagates in an east-northeastward direction at the same time as the positive OLR anomaly pole moves northward over the Indian–West Pacific sector. The positive OLR anomalies reach the coast of California and central America at t0 + 5 with their highest values at t0 + 10. The decrease of convection off the coast of California is preceded by an opposite phase of enhanced convection at t0 – 10, meaning an approximate periodicity of 40 days.
The atmospheric pattern associated with the development of the equatorial positive OLR anomaly pattern over the warm pool at t0 – 15 depicts an equatorial Kelvin–Rossby wave pattern [45]. East of this positive OLR anomaly, a positive geopotential height front propagates rapidly eastward along the equator leading to the enhancement of low-level westerly winds over the whole tropical Pacific and increasing convection off the coast of California at t0 – 10/t0 – 5. This Kelvin wave pattern has its positive geopotential high centred along the equator at 80°W at t0 extending over the eastern equatorial Pacific and the western equatorial Atlantic. At t0 – 15 west of the equatorial Indian positive OLR anomaly, an equatorial Rossby wave is slowly growing, characterized by a horseshoe shape pattern symmetric about the equator with positive geopotential height anomalies developing northwestward and southwestward of the equator at t0 – 10/t0 – 5. This westward propagation of a positive geopotential height front signifies enhanced low-level easterly winds, which converge over Africa with the anomalous westerly winds linked to the Kelvin wave, helping to increase convection over equatorial Africa.
Strictly speaking, only 50% of the active/break events in the Indian monsoon are associated with the propagating phenomenon described above, the other 50% are independent northward moving events [28,71]. Other studies [7,35,36,49] have shown the existence of a 10–20-day oscillation as a westward propagating mode closely related to monsoon active/break conditions. This mode, which has received very little attention, looks like an equatorial Rossby wave centred around 5°N with anticlockwise circulations located at 18°N and 3°S. It could be driven unstable by convective feedback and modified by the summer mean flow [6].
4 Interannual variability
We have shown in the previous section the important role of intraseasonal variability of rainfall in these monsoon systems. The interannual variability has also a significant weight on rainfall variability and life of the inhabitants. This is especially true for the African Sahel. Fig. 6 shows the well-known time series of rainfall anomalies over the Sahel, updated over the period 1905–2006. While the first part of the 20th century has been characterized by a succession of short wet and dry periods, the second part of the century has known a very unusual evolution of rainfall with a 20-year wet period followed by another 20-year dry period. This long-term negative trend of rainfall has an amplitude that has not been observed anywhere in the world during this century (not shown). Since the mid-1980s, we see a tendency towards some recovery, even if the rainfall anomalies are still mostly negative. This tendency is more marked over the eastern part of the Sahel than the western part (not shown). For the Gulf of Guinea coastal region, the interannual variability dominates the rainfall time series for the last century [57,72]. Fig. 7 shows the time series evolution of all-India rainfall anomalies, expressed as percent departures from its long-term mean, over more than a century in the past. It is interesting to note that there have been alternating periods extending to 3–4 decades with less and more frequent weak monsoons over India. For example, the 44-year period 1921–1964 witnessed just three drought years; during such epochs, the monsoon was found to be less correlated with the ENSO. During the other periods like that of 1965–1987 that had as many as 10 drought years out of 23, the monsoon was found to be strongly linked to the ENSO [53].
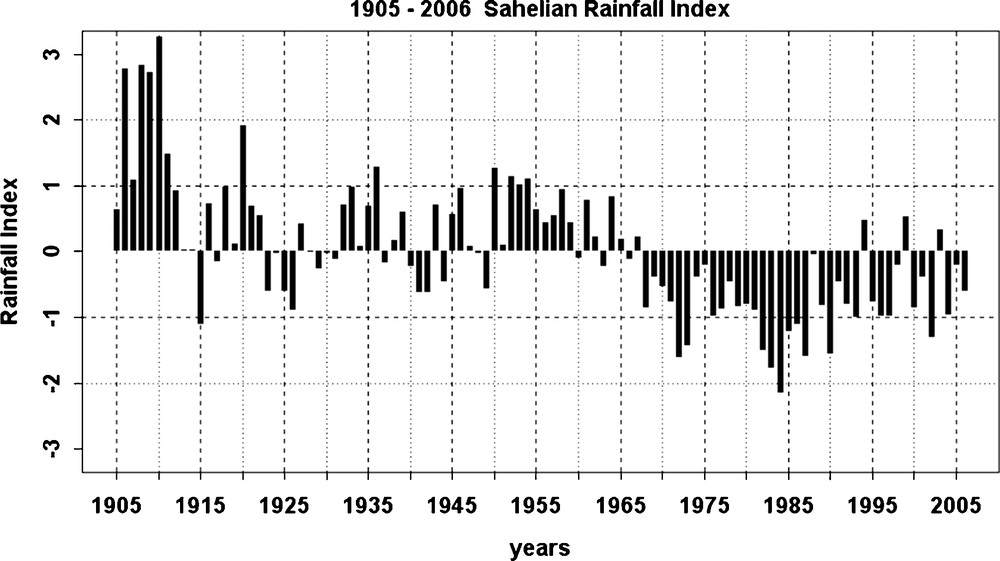
A May–September Sahelian rainfall index, expressed in normalized anomalies, computed from 1905 to 2006 by averaging rainfall data between 13°N–17°N/17°W–22°E. Source of the data: AGRHYMET.
Fig. 6. Indice pluviométrique sahélien mai–septembre en anomalies standardisées de 1905 à 2006, moyenné sur le domaine 13°N–17°N/17°W–22°E. Source des données : AGRHYMET.
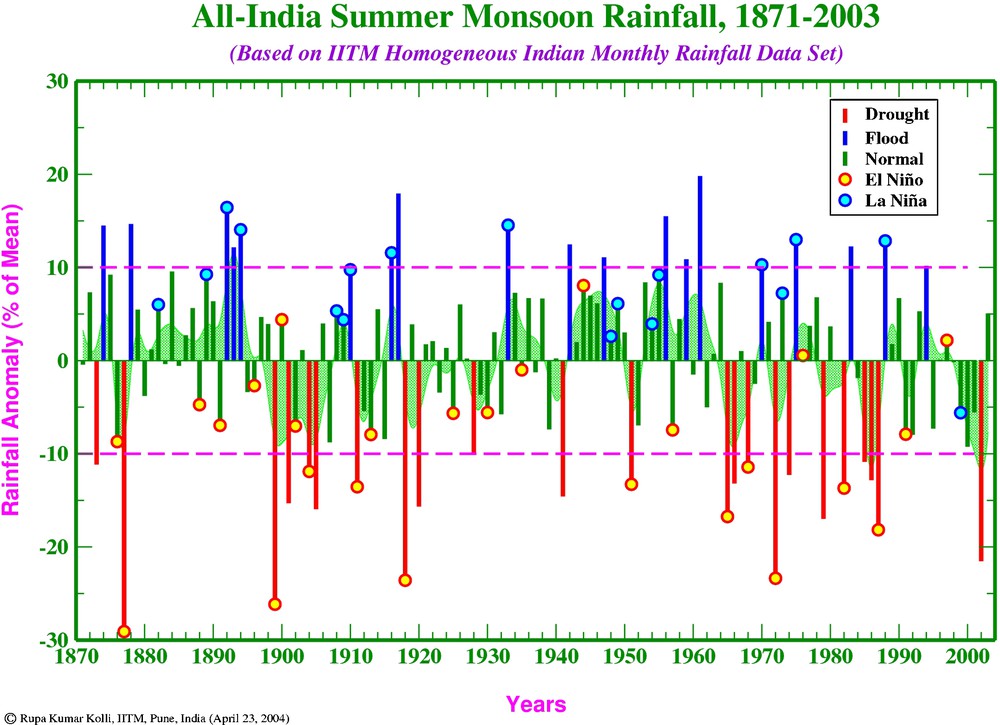
All-India summer monsoon rainfall index, expressed in relative anomalies respect to the mean (%), computed from 1871 to 2003. Source http://www.tropmet.res.in/∼kolli/MOL/Monsoon/frameindex.html. El Niño and La Niña years are also indicated.
Fig. 7. Indice pluviométrique « All-India » de la mousson d’été indienne en anomalies relatives à la moyenne (%) de 1871 à 2003. Source http://www.tropmet.res.in/∼kolli/MOL/Monsoon/frameindex.html. Les évènements El Niño et La Niña sont aussi indiqués.
The research of the last 30 years has established that the interannual variability of West African seasonal rainfall exhibits distinct spatial modes of behaviour, and that some of those modes are forced by large-scale sea surface temperature (SST) anomaly patterns. These seasonal rainfall anomalies tend to be of:
The dipole rainfall behaviour has been linked to the interannual variability of tropical Atlantic SST anomaly patterns (e.g., [39–41,57,72]). Sahel–Soudan drought accompanied by Gulf of Guinea wetness is associated with cold (warm) SST anomalies north (south) of 10°N, and vice versa. In contrast, the extension of drought conditions all the way from the Sahara Desert to the Gulf of Guinea coast has been found to coincide with El Niño events in the tropical Pacific Ocean [14,16,51,52,57,72]. Pacific and Atlantic SST signals can also be combined as ENSO has some impact on the tropical Atlantic SST variability [23]. Another Ocean–African monsoon relationship at the regional scale concerns the role of the SST anomalies in the Mediterranean; positive Mediterranean SST anomalies lead to a wetter Sahel through advection of moister air towards the ITCZ [30,59].
At the interannual time scale, the impact of El Niño events of Sahel drought has been described in several papers including for the most recent ones [16,26,58]. Rowell [58] examined in detail the mechanisms of this atmospheric teleconnection between the Pacific Ocean and Africa. He demonstrated the existence of a mechanism similar to the one describing the links between intraseasonal phases in the Indian sector and African convection variability [45]. Janicot et al. [26] showed that this Sahel–El Niño teleconnection has not been strong during the whole second part of the last century, but has been significantly modulated by the decadal time scale SST anomaly pattern during this period. The long-term warming of the global SST mode, not only favours the long-term drying over the Sahel, but helps also to enhance the atmospheric teleconnection pattern linking El Niño events to Sahel rainfall deficits after 1980, through a fill-in of the monsoon trough and a moisture advection deficit over West Africa. El Niño events have also a significant impact on the Indian monsoon. Fig. 8 shows the main coupled mode between tropical Pacific SST variability and rainfall in the Asia–Africa–Europe sector at interannual time scale [72]. The SST mode corresponds to El Niño events (not shown) and it is associated with negative rainfall anomalies both over the Indian and African monsoons area. However, as for the Sahel, the strength of this anticorrelation between ENSO indices and the Indian monsoon rainfall varies along the decades [29,73] and it weakened substantially during the 1980s and 1990s [67]. A tropospheric biennal oscillation has also been detected in the Indian monsoon, but its origin is still discussed [64].

Singular value decomposition analysis between July and September interannual tropical Pacific SST and rainfall in the Asia–Africa–Europe sector. Rainfall mode 1 pattern. From [71].
Fig. 8. Analyse de décomposition en valeurs singulières entre les anomalies interannuelles de températures de surface de mer sur le Pacifique tropical et les précipitations sur le secteur Asie–Afrique–Europe en juillet–septembre. Représentation du premier mode de précipitations. D’après [71].
The substantial multidecadal rainfall variability experienced in the Sahel during the 20th century has been associated with an interhemispheric SST anomaly difference, especially marked in the Atlantic, and including warmer-than-average low-latitude water in the Indian oceanic basin [1,16,26,72]. More recently, the Atlantic Multidecadal Oscillation (AMO) pattern has been highlighted [63], strongly associated to the strength of the Thermo-Haline Circulation (THC; [18]). The AMO appears to present a dominant part of the decadal scale SST variability that has been impacting Sahel rainfall [2,31]. A present debate concerns the relative impact of AMO and the Indian Ocean evolution on the recent recovery of Sahel rainfall since the mid-1980s. This is a key issue for the future of the West African climate, since it is known that one of the impacts of a Green House Gas (GHG) concentration increase might be a weakening of the TCH, which would impact the AMO pattern and lead to Sahel rainfall decreasing. The AMO has been also implied to explain a part of the multidecadal variability of Indian rainfall [74], as well as the recent decadal scale weakening of the ENSO–Indian monsoon anticorrelation [37,38].
5 Predictability
The above results provide a basis for a seasonal prediction of West African rainfall from the expected evolution of tropical Atlantic and Pacific SST anomaly patterns during the months leading up to the monsoon season. Both statistical and numerical modelling approaches have been employed with mixed but significant success. These operational forecasts are provided every year in May at the PRESAO forums to predict the July–September rainfall anomalies over West Africa. A major challenge that persists is the difficulty of predicting the evolution of the tropical Atlantic SST anomaly pattern prior to and during the African monsoon season. Unfortunately, at present, neither observations nor models are fully adequate to characterize quantitatively the variability and predictability of SSTs in the tropical Atlantic. The problem is rooted in prediction inadequacy for the average state and the seasonal cycle that propagates through to the interannual time-scales.
In contrast to the above dominant role that tropical Atlantic and Pacific SST anomaly patterns have been found to play for the interannual variability of African monsoon rainfall, the contributions of land–atmosphere interactions are considered to be of subordinate (but possibly amplifying) importance on this time-scale [10,16]. Fundamentally, rainfall anomalies are expected to result in anomalies in the surface conditions, notably through impacting soil moisture and vegetation. These surface anomalies will impact the energy and water budgets. There is some evidence to suggest that the seasonal African monsoon rainfall is impacted by the rainfall at the end of the previous rainy season [54]. Recently, Douville et al. [11] have reactivated this debate by showing that the phasing of equatorial Pacific and Guinea Gulf SST might explain such an apparent “memory” effect. Fontaine et al. [15] showed, however, that using information related to land surface properties during spring (meridional gradient of low-level entropy over West Africa and over the Guinean Coast) enables one to increase significantly the scores of statistical seasonal forecast skills. This is consistent with various theoretical works showing that such meridional circulation located close to the equator is highly sensitive to low-level meridional gradient of entropy, which is less the case for the Indian monsoon system located more northward.
In India, seasonal forecasts schemes have been developed since 1884 [4] using the Himalayan snow coverage extension. This was followed by the work of Sir Gilbert Walker [68–70] using worldwide variation of weather elements such as pressure, temperature and rainfall to develop an objective method of long range forecast. These findings are still relevant today. Subsequent to Walker's work, very little progress was made until the early 1980s when several studies have re-established the strong link between the Indian monsoon rainfall variability and ENSO using better data sets [34]. Four types of predictors are usually referenced, pertaining to:
- • the preceding winter and spring seasons representing ENSO indicators that play the dominant role;
- • regional conditions (surface pressure and thermal fields, 500 hPa ridge location and upper tropospheric winds over India);
- • cross-equatorial flow;
- • global/hemispheric conditions (Eurasian/Himalaya snow cover, northern hemispheric surface air temperature, quasi-biennal oscillation).
Most of these predictors show the highest scores over northwestern and central India, and the lowest scores over northeast and extreme southern parts of the Peninsula [34]. As we have seen in the previous section, there is a decadal scale variation in the predictors and in the correlation links with Indian rainfall, which is not completely elucidated. The perturbation of the links between the Indian monsoon and the ENSO phenomenon by the recent warming of the equatorial Atlantic and its impact on the atmospheric teleconnections within the Tropics might be an explanation [37,38]. Moreover, the relative part of atmospheric intraseasonal variability in respect to the surface forcing is stronger than in the African monsoon, limiting the scores of seasonal forecast.
Progress on this issue will come only from a significant improvement of the climate models. However, these models are based on a more or less accurate representation of the atmospheric, oceanic and land processes as well as their respective interactions. They have specific difficulties in the Tropics since for example they cannot simulate a realistic diurnal cycle of the atmospheric convection. They present also some regional failures as, for instance, a warm SST bias in the eastern tropical Atlantic that prevents the ITCZ to move northward enough over Africa during the northern summer. It has also been shown that these models are unable, for instance, to reproduce accurately the relationships between Sahel rainfall and ENSO at interannual time scale [27], which is a key issue for seasonal forecasting. This improvement exercise is very difficult and it is requiring a huge long-term effort for the numerical forecasting community.
6 Climate change scenarios
We have indicated in the introduction that the Indian and African monsoon systems have been very sensitive to astronomical forcing that has been regulating the paleoclimates. So these monsoon systems are probably going to change in the future and especially under the anthropogenic GHG increase forcing. However, simulations of the climate change impact on the African and Indian monsoons must be considered with great caution. Such scenarios are based on integrations of ensembles of coupled ocean–atmosphere climate models combined with projections of various socioeconomical developments. At the global scale, uncertainties come for an equal part from weaknesses of the models and incomplete knowledge of the future economical orientation. As said above, it has been shown that the models used for the fourth report of the Intergovernmental Panel on Climate Change (IPCC4) simulations are unable to reproduce accurately the relationships between Sahel rainfall and ENSO at interannual time scale as well as between Sahel rainfall and the interhemispheric SST gradient at decadal time scale [27]. At the regional scale, uncertainties are larger, due, in particular, to the non-capability of the models to simulate accurately the small-scale processes, such as those associated to the water cycle, convection, cloud-radiation and cloud-moisture feedbacks among others. Another problem, specific to the simulation of the West African monsoon, is the existence of the warm bias in the SST of the eastern oceanic basins in the coupled models. This is true for the eastern part of the southern tropical and equatorial Atlantic, which induces a weaker than normal African monsoon as we have seen above.
In spite of these drawbacks in climate modelling, climate scenarios for the future are regularly produced and scrutinized. The scenarios that have been produced for the IPCC4 in 2007 do not provide a coherent response for West Africa and the Sahel region [3,8,21,42]. Most of the models used provide either moderate positive or negative rainfall anomalies at the end of the 21st century, and two other models simulate a high positive rainfall anomaly for one of them, and a high negative rainfall anomaly for the other one! A primary question is to know whether the recent drought in the 1970s and 1980s (and now the partial recovery if it is confirmed) is more or less a consequence of the global increase of GHG or if it still comes from natural climate variability meaning that the global warming impact has been up to now weak. Some studies have linked the decadal scale interhemispheric SST pattern evolution including the Indian Ocean warming to GHG and anthropogenic aerosol increase [32,56,61], while others argued for natural variability [22]. Biassuti and Giannini [3] explored the whole IPCC4 dataset and estimated that at least 30% of the observed long-term drought during the 20th century was due to external forcing, that is most likely anthropogenic forced. They also highlighted the significant role of aerosols (mainly located in the northern hemisphere) in forcing the Sahel drought since simulations in which GHG is the only forcing do not provide a consistent 20th century response. This is in agreement with [22] who suggested that the recent decrease of aerosols content may explain the recent rainfall recovery in the Sahel. So considering all these results and model drawbacks, future West African climate has remained highly uncertain up to now (see Fig. 9).
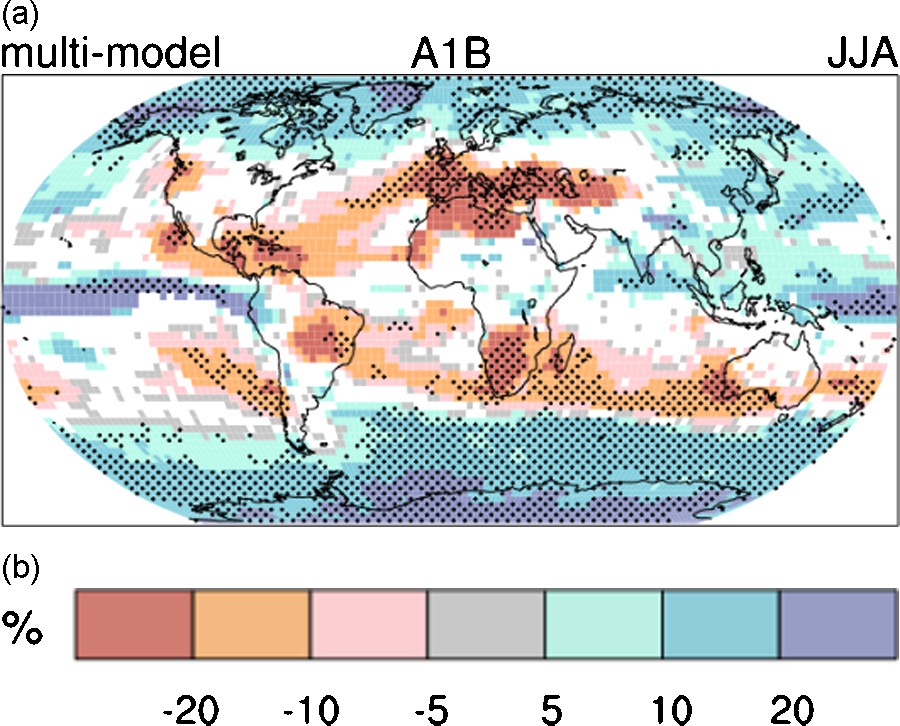
Relative rainfall changes (%) on June–August for the period 2090–2099 respect to 1980–1999. The values come from the multi-ensemble of models based on A1B. White areas represent the zones where less than 66% of the models have the same sign of rainfall change, and hatched areas where more than 90% of the models have the same sign.
Fig. 9. Changements relatifs des précipitations (%) en juin–août sur la période 2090–2099 par rapport à la période 1980–1999. Les valeurs sont issues d’un ensemble multimodèles de simulations basées sur le scénario économique A1B. Les zones blanches représentent les zones où moins de 66 % des modèles donnent le même signe dans le changement des précipitations, et les zones hachurées où plus de 90 % des modèles donnent le même signe.
Considering India, the IPCC4 scenarios suggest that a rainfall increase should occur with an intensification of extreme rainfall events [12] but this response is not statistically significant within the models population (see Fig. 9). These models accurately reproduce the warming of the Indian basin during the 20th century and its acceleration during the recent period, meaning that its origin should not be natural. However, due to an increase of the continental temperatures over India, the meridional temperature gradient over the Indian sector that is instrumental for the monsoon strength, would not evolve significantly, which could explain the inconsistent response of the climate scenarios [64].
So the projection for the end of the 21st century of the intensity of these two monsoon systems remains very uncertain.
7 Conclusion
A short review has been given of the comparison of the two summer monsoon systems in Africa and India and of their variability at different time scales. These monsoon systems have shown a high sensitivity to the climate variations from the past epochs to the present time. While they are differentiated regional systems with a significant larger extent for the Indian monsoon, we have shown some similarities in intraseasonal to decadal scales variability as well as the existence of teleconnections between them. In particular, we have shown the importance of the intraseasonal variability on the monsoon onset and on the occurrences of dry/wet phases within the monsoon season, what has a huge impact in terms of crop yields and planning for farmers.
However, much has to be investigated more. The climate projections for the end of the 21st century are not consistent among the ensemble of climate models used and no forecast can be provided presently. This is mainly due to the deficiencies of such models in representing the ocean–land–atmosphere interactions as well as the processes controlling the climate in these areas like, among others, deep convection, cloud-radiation and cloud-moisture feedbacks at small scale and tropical teleconnections at larger scale.
In order to improve the modelling and forecasting of these two monsoon systems, a huge long-term effort is necessary and must be supported by international bodies. This investigation should be based first on intensive field experiments and long-term geophysical observatory networks to gain knowledge of the processes working at different space and time scales. Then these processes have to be integrated into climate models through a set-up of better parametrizations. In parallel, theoretical studies with conceptual models are also needed to better understand some of the mechanisms involved in climate variability, related for instance to the intraseasonal scale phenomena. The present international coordination and effort being realized within the African Monsoon Multidisciplinary Analyses (AMMA) program is a significant contribution to what must be done.
Acknowledgements
Based on French initiative, AMMA was built by an international scientific group and is currently funded by a large number of agencies, especially from France, UK, US and Africa. It has been the beneficiary of a major financial contribution from the European Community's Sixth Framework Research Program. Detailed information on scientific coordination and funding is available on the AMMA International website http://www.amma-international.org.