

1 Introduction
Ecological proxies are commonly used in order to understand climate change in North Africa since the Last Glacial Maximum (LGM) ca. 18 ka (in the remainder of this paper, ka stands for 103 cal. yr BP). One significant difficulty in linking the presence of vegetation to climatic conditions is the assumption of annual precipitation to be the primary factor in biome repartition. This paper addresses the question of the real climatic regional information recorded in ecological proxies such as pollen.
Previous studies have shown that climate change should not be reduced to variations in annual precipitation, which relationship with vegetation distribution is not always clear [25]. Admittedly, the ecological response to recent climate change can be in the range of decades [19,37] and thus both can be considered synchronous on millennial time-scales. On the other hand, vegetation does not always recover from a climate change, due to other ecological thresholds (annual and seasonal temperature, atmospheric carbon concentration, etc.) [36]. Some observational sites feature particularly long time lags in vegetation response.
North-East Brazil. Jennerjahn et al. [20] observed a 1000 to 2000 years time-lag between vegetation and climate changes during the Heinrich event H1 from the analysis of Brazilian continental margin sediment cores. They interpreted this time-lag by a quick installation of a new annual precipitation regime contrasting with a slow lengthening of the rainy season.
Lake Yoa, Chad. Kröpelin et al. [21] collected a variety of palaeodata (back to 6 ka) in and around the Saharan lake. Three ecological signs of hydrological degradation appear ca. 2.7 ka: marsh vegetation, Saharan plants and salt-loving Anisops hemipters. But fine sand deposition and dust import (both markers of non-local aridity) set on ca. 3.7 ka and hydrographic import from the Tibesti (as recorded by the burst in lake salinity and by the disappearance of high-altitude species taxa) collapses between 4.3 ka and 3.7 ka. This 1000 year-long time-lag can be explained either by a very slow deflation of the Nubian sandstone artesian aquifer that is feeding the lake-system today, or by distant river inputs ([18], this issue), or by the time necessary for a new ecosystem to colonize the area and self-organize.
More generally, the mitigation of climate change effects on lake level – and thus on vegetation signature – by hydrogeological resources has become a known issue in the Sahara and Sahel [34].
These examples show that local annual rainfall does not necessarily play a major role in vegetation distribution, because other hydrological forcing (length of the rainy season, soil water availability) may dominate. Significant discrepancies may as well arise between climate indicators and the vegetation deduced from local proxies. Along with Claussen et al. [6], one might thus question the flourishing of a uniformly “green Sahara” during the Early Holocene (10 ka and later on). Discontinuous local vegetation and, on the contrary, continuous extensive vegetation may yield quite different atmospheric feedbacks. The former would not reasonably induce a retroaction high enough as to soften the abruptness of a climate change.
Here, we discuss to what extent local factors may have influenced vegetation evolution in the Niaye area (Senegal). The niayes are small interdunal endorheic watersheds, located a few kilometers distant from the Atlantic coast. They were part of, or close to, active hydrographic channels during the AHP. They were cross-cut by several dune reshaping during dry events ca. 7 ka and later by NW–SE parabolic dunes ca. 2 ka [27]. The remnants of the former offer a limited and discontinuous protection against subsurface intrusion of the presently high sea waters. They have enjoyed propitious conditions for vegetation throughout the Holocene and are now playing an important economical role in Senegalese market gardening. Cores drilled in the deepest parts of the fens, that have progressively formed in the center of the depressions since 11.5 ka, reveal considerable variations in biome population [24] and in mineralogy [12,32].
This work aims at determining the forcings governing the availability of water to niaye palaeoecosystems and to provide indications on the relative importance of climate on vegetation fluctuations, as recorded by pollens assemblages. The methodology relies on embedded numerical simulations at different scales.
2 Environmental context and past fluctuations
Several cores were drilled at different locations in the niaye system, notably near Touba Ndiaye and Diogo, mid-way between Dakar and Saint-Louis [24] (see Fig. 1). This study focuses on the interpretation of the continuous, better preserved and better dated sample “Diogo II”. Notably, it has not been perturbed by sea intrusions and leveling, sand deposition or wind erosion. Compared to the others, the area can therefore be considered as a very favorable place for vegetation. In particular, notwithstanding correspondence with Diogo, the Touba Ndiaye record is more variable and its vegetation weaker, suggesting a heavier dependence on climate.
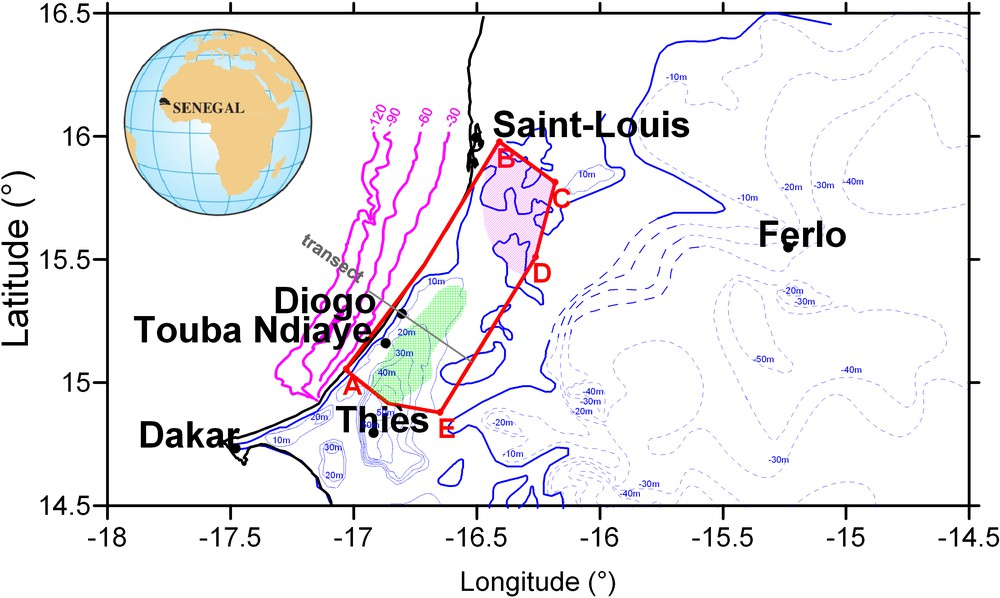
Map of the studied area (red) and location of places of interest: Thiès Plateau, Diogo and Mboro niayes, Ferlo piezometric depression. (Crossed green) Main positive recharge area. (Hatched) Negative recharge. (Blue) Piezometry. (Pink) Bathymetry.
Fig. 1. Carte de la zone d’étude (rouge) et des lieux d’intérêt : Plateau de Thiès, niayes de Diogo et Mboro, dépression piézométrique du Ferlo. (Vert) Principale zone de recharge positive. (Hachuré) Recharge négative. (Bleu) Piézométrie. (Rose) Bathymétrie.
2.1 Past climate fluctuations over the Sahel
Gasse [17] has reviewed the African climate since LGM. According to lake and marine records, the monsoon reactivation occurred in the Sahelian belt in two steps, at ca. 15–14.5 and 11.5–11 ka, separated by a return to drier conditions around 12.4 ka coincident with the Younger Dryas. Maximum wetness occurred during Mid-Holocene, from about 8 to 4 ka, bracketed by two short-term dry events around 8.3–8 ka and 4.2–4 ka. A minor dry spell is also recorded at 7–6.5 ka in Ethiopia and at several Sahelian sites. A marked climate deterioration started at ca. 4.1 ka at Bal Lake and Kajemarum Oasis (12°N, 8°E), consistently with the establishment of dryer conditions in equatorial West Africa, though many North-African sites display a humid phase of low amplitude after 4 ka.
All of the records considered stand east of 8°W, whereas the niayes system is 16.5°W. Therefore, questions arise whether the climate of westernmost Africa follows this general pattern.
2.2 Specificity of the niaye records
Ancient palynological work [24] is used as a reference. Its chronology has been revised. Although the data remain unpublished in the reviewed scientific literature, they are available on the Fossil Pollen Database (http://fpd.mediasfrance.org). Other indirect western-Senegal evidence [10,12,27,35] of climatic fluctuations enrich the analysis, although they are not always consistent, or suffer from imprecise datation.
A concordance with the above chronology resides in: (i) the reinstallation of humid conditions after the end of the Ogolian dune formation ca. 11.5 ka; (ii) heavy precipitation between ca. 10–8 ka, when Guinean vegetation flourished as testified by strong sedimentation, surficial groundwater and active hydrography; (iii) the slight increase of precipitation between 6.5–4 ka such as to maintain Diogo niaye inundation and meander-like channels.
However, severe discrepancies also appear, notably: (i) the dating of the end of the AHP, because forest degradation occurred around 7.5 ka, whereas the “8.2 ka dry event” is reputed to have ended ca. 8 ka; (ii) a forest expansion in Diogo niaye centered around 3.5 ka in both Diogo and Touba Ndiaye niaye, with no conclusive sign of the “4 ka dry event”; (iii) vegetation turned slowly to its present dry state after 3–2.5 ka only, while parabolic dunes formed and gave their present shape to the depressions, concomitantly with the end of the recharge to the “Maestrichtian” aquifer around the Senegal river. It is therefore important to understand whether these differences arise from asynchronous climatic changes in latitude and longitude, from local climatic features related to the littoral proximity, or from equivocal relationships between climate and its proxies (vegetal, geochemical or sedimentological) induced by local specificity.
2.3 Hydrogeology and sea level
The watertable resides locally in the Quaternary Sands Aquifer (QSA), which is linked to two other surface aquifers, forming a single continuous hectokilometric unit. It interacts with the “Maestrichtian” confined aquifer below mainly around the Senegal river (North and North-East, outside the study area) [35]. The direct recharge by diffuse infiltration through the permeable soil differs from the more concentrated modes usually encountered in Sahel [14,22]. Long-term recharge is higher along the hillside than on the plateau, which endures higher evaporation of rainfall in relation to the water-table depth [26]. Infiltration fluctuations according to soil texture and microtopography makes the extrapolation of point-scale data (up to 30 mm/y) to square-kilometers difficult. Previous model estimation has present-day (before 1975) infiltration range between a positive balance of 5 mm/y to the south, to an interannual net loss of 3 mm/y to the north, which undergoes weak head gradient1, marine intrusion and poor precipitation (Fig. 1) [33].
The oceanic outlet is a major forcing to the position of the watertable as it influences directly the groundwater level near the coast, assuming connection of the aquifer to the palaeocoast. Relative sea level has changed dramatically since LGM, when it was 120 m lower than now [13,30]. It is generally accepted to have been maximal during the Nouakchottian (7 ka–4 ka), up to +1 or +2 m.
Moreover, low sea levels may have drained continental groundwaters during the last glaciation. Whether the geographical extent of this depletion had been limited to the Quaternary sands and Lutetian limestone aquifers, or went as far as hundreds of kilometers in-land, is still debated. In the latter case, as assumed by Dieng and de Marsily [11], the piezometric depression of the Ferlo (Fig. 1) would still be replenishing now with groundwaters coming from the western recharge zones through the semipervious marly-limestone formations. In the former case, the marly-limestone formations would be impervious and the Ferlo depressions –– as deep as 80 m –– would have an evaporative origin. However, recent studies on the evaporation and transpiration rates from very deep aquifers cannot support such a view [7,8,23]. Therefore, the scenarios here rely on Dieng and de Marsily's assumptions. By use of a numerical model and a climatic scenario, their study indicated that regional piezometry would have risen at the eastern border of the study area as much as 40 m during the Holocene (Fig. 3). The increase rate is related to the distance from the recharge areas (the flanks of Plateau de Thiès to the south-west and the Ferlo and Senegal rivers to the north), to their piezometry, and to the permeability of the formations the groundwaters had to cross. The Ferlo depression would have roughly stabilized around 2.5 ka, because of the shift of climate to present-day dry conditions, that would have strongly limited recharge. This transient hydrogeological forcings certainly affected the hydrology of the niaye area, yet with an intensity that is largely unknown because of the presence of a piezometric ridge between the sea to the west, and the Ferlo piezometric depression to the east. The position and amplitude of the ridge modulated the amount of water effectively reaching the ocean under or through the niaye system.
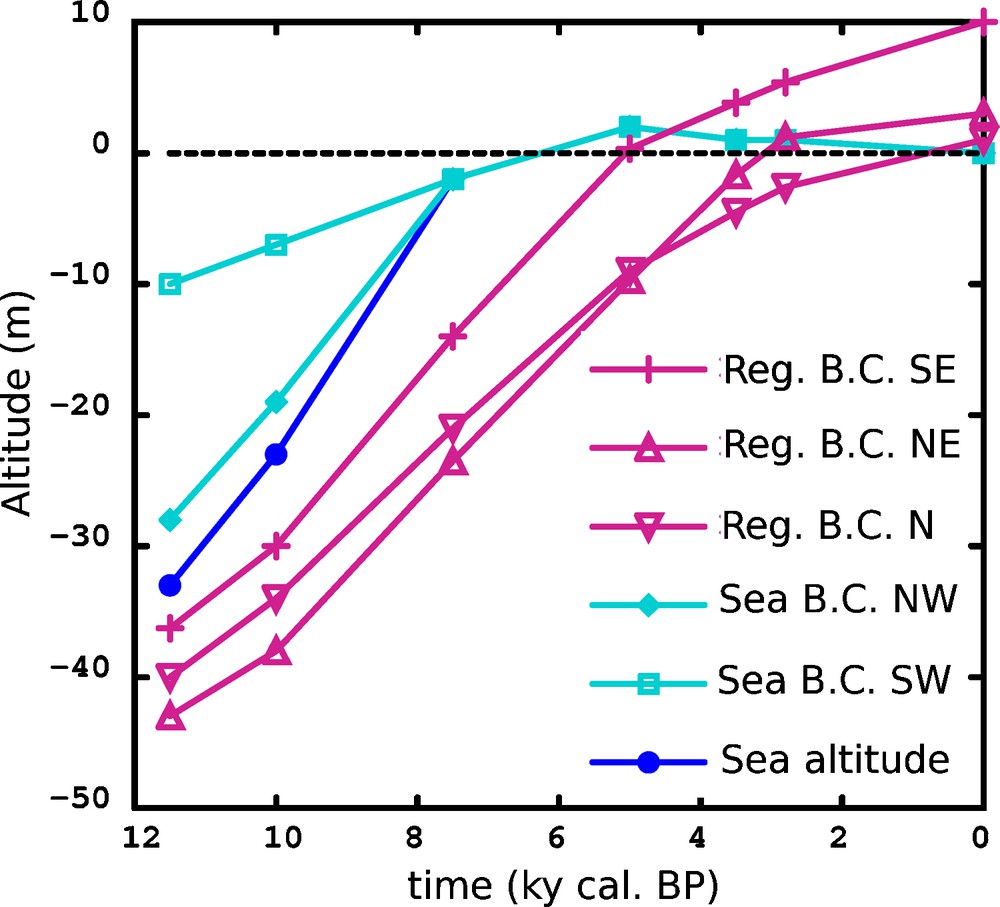
Values of the prescribed head at few locations, at the different considered dates (only very humid scenarios are plotted for the two oldest dates): (Violet) at the south-eastern (point E, Fig. 1), north-eastern (D) and eastern (C) ends of the inland boundary; (Light blue) at the northern (B) and southern (A) ends of the western boundary; (Blue) relative sea altitude.
Fig. 3. Valeurs de la charge imposée en quelques points, pour les différentes époques considérées (scénarios très humides seulement pour les deux dates les plus anciennes) : (Violet) aux extrémités sud-est (point E, Fig. 1), nord-est (D) et nord (C) de la frontière continentale intérieure ; (Bleu clair) aux extrémités nord (B) et au sud (A) de la frontière ouest; (Bleu) altitude relative de la mer.
3 Purpose and strategy
This study focuses on hydrological events common to the Sahel, and on the niaye-specific events described above. The objective is to screen out the contribution of hydrology from the pollen assemblages, in order to clarify when and how climate changed during the Holocene. Comparison of hydrological scenarios, along with subsidiary sensitivity analysis, are used to discriminate the strengths of the considered forcings. A quantitative tool is necessary to go beyond purely intuitive understandings. The present work is a first step in this direction.
The methodology is limited by the complexity and the number of the processes involved, and by the scarcity or even unavailability of observational data. For instance, only guesses can be made on: (i) the palaeotopography before Ogolian dune remobilization; (ii) the geometry and properties of the geological formation of the formerly exonded bathymetry, before sea rise and Nouakchottian rectification; (iii) hydrodynamical properties of the geological formations in regions where they are insufficiently characterized; and (iv) the pattern of precipitation, recharge and hydrography. This justifies the focus on groundwater only, less sensitive to surface conditions, and heavy simplifications of the boundary conditions. Although it has been calibrated on present-day measurements, this work does not pretend to reproduce reality, but to give insight on the relative weights of selected forcings.
3.1 Numerical model
The modeling work relies on the considerable and continuous efforts of prospecting, characterization and modeling, that has been undertaken during last forty years ([4,5,9,16,28,29,31], among others). The model focuses on the surface aquifer only. It comprises a band 40 km wide and 120 km long, parallel to the coast, including the main recharge area to the south (the flanks of Thiès Plateau) and the evaporative land to the north (Fig. 1). The coarseness of the modeling grid limits the application of our results to Diogo niaye as such, because local topography, pedology, and probably microclimate due to ocean proximity are not taken into account. Moreover, the calculated head is not directly related to watertable level at the niaye location, thus limiting a precise comparison to depression depth and to vegetation. 3D Mixed Hybrid Finite Elements were used with prismatic cells, 3.6 km wide, and a vertical subdivision into 12 horizontal layers of varying depth, according to the depth of the substratum (Fig. 2). Non-linearities were included by a subrelaxed Picard's algorithm, with a special treatment of phreatic aquifers that assumes abrupt capillary fringes in the unsaturated zone.
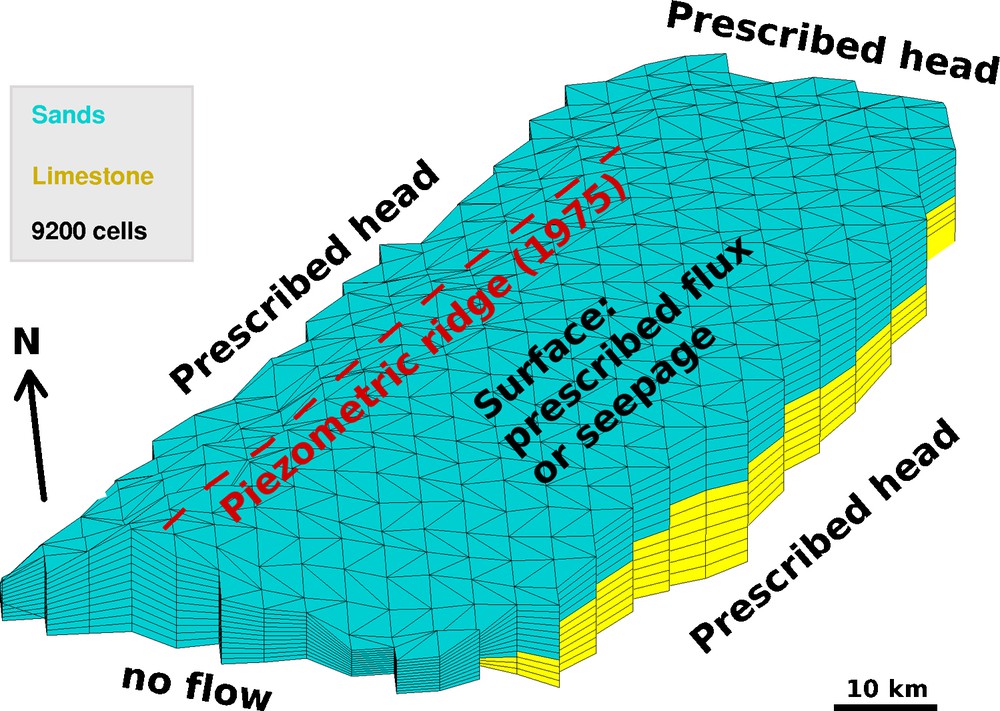
Mesh of the numerical model (9200 cells), including the sand upper formation and the underneath very permeable fractured limestone. Boundary conditions are figured. The southern drainage divide (no-flow) is assumed constant throughout the Holocene whereas the dotted one should move according to the equilibrii.
Fig. 2. Maillage du modèle numérique (9200 éléments), incluant la formation sableuse supérieure et le calcaire fracturé et très perméable en-dessous. Les conditions aux limites sont représentées. On suppose que la ligne de partage des eaux au sud (flux nul) reste fixe pendant l’Holocène. En revanche, celle en pointillées est susceptible de se déplacer en fonction des forçages.
Underground marine intrusion is neglected but sea-level variations are included as a prescribed head boundary condition HBC. The latter is estimated iteratively at several points and is linearly interpolated along the western boundary, to account for sea-shore retreat with low sea levels. HBC is first given an arbitrary value. The subsequent calculated outflow allows the estimation of the head at the desired sea-shore distance HSS, by use of the 1D analytical solution of surface groundwater flow in homogeneous medium (permeability, recharge, and substratum depth being the same as at the boundary). HBC is lowered by a fraction of HSS − Zsea for the next iteration until convergence is reached. For instance, 10 ka sea-level was lower than now by ca. 25 m but due to seashore distance, the head at the model boundary with a very humid scenario should have ranged only from −19 m to −7 m (Fig. 3). This solution was preferred to a moving boundary because of the uncertainties in the geometry and the properties of the sand aquifer, its marly-limestone basement, and topography. To the south-west, a no-flow boundary condition transecting the slopes of the Plateau de Thiès assumes that the flow direction follows the topography along this line, assuming that this elevation had kept its role of recharge area during the Holocene. Surface run-off is included into the boundary condition at the surface of the model, which consists of a prescribed net algebraic flux including all contributions (in-, exfiltration, evapotranspiration, run-off, etc.), doubled with a seepage condition that prevents the head from exceeding topography. The model accounts for the surface aquifer only.
Decadal watertable fluctuations in the niaye area in accordance with recent climate changes are in the range of meters [1,2]. This high kinetics of the subsurface flows allows for the assumption of equilibrium with the atmospheric forcing (millennial time-scale), sea rise and continental hydrogeology (a few decimeters each century); in other words, steady-state. Therefore, long-term and large-scale transient conditions are represented by step-changes in the boundary conditions (Fig. 3).
Topography, in our model, was constructed from NASA SRTM data and coarsened to alleviate computation costs. The derefining method is not an issue since run-off routing does not appear explicitly in the model. The geometry of the sand and limestone aquifers were interpolated from Noël [28]. The parameter fitting procedure of permeability and recharge is based on present-day (1975) observed head and permeability, following Dieng [10] and Faye [15], except that only the steady-state head data were used. With a range of 5 × 10⁻⁶ to 10−3 m/s, sands are globally less permeable than the karstified Lutetian limestones which permeability ranges within 6 × 10⁻⁵–10−3 m/s. Anthropogenic withdrawals were included in the calibration but were ignored for the computation of the present-day reference scenario. Dieng's [10] transient numerical modeling of the regional hydraulic head provided the continental boundary conditions (Fig. 3). Finally, sand remobilization, dune edification and channel incision or banking up, actively modified the topography and the soil properties during the Holocene. These processes, especially the absence of the coastal strand before 7 ka, were not taken into account but certainly impacted the hydrology along the coast at the local scale.
Head values are defined conventionally with the present sea level as a reference for H = 0.
3.2 Modeling scenarios
Calculations were conducted for different scenarios including the present (Table 1). They focus on special periods of changes, or of apparent steadiness, notably:
Summary of the scenarios and numerical results.
Tableau 1 Récapitulatif des scénarios et des résultats numériques.
| Period (ka) | Observation at Diogo | Scenarios | Results | ||||||||
| Sea(1) | Depression type(2) | Z(3) (m) | Vegetation indication | Climate | R(4) (mm/y) | A, B (m) | C, D, E (m) | H(7) (m) | H′(8) | ΔI(9) | |
| 11.5 | −33 m | Palustrine | −12.4 | Periaquatic | Dry | [−3; 6] | −20,−33 | −40,−43,−36 | −10.7 | −18.8 | −6.4 |
| 7 km | Channels | Very humid | [−5; 14] | −10,−28 | 6.3 | −1.8 | 10.6 | ||||
| 10 | −23 m | Palustrine | −10.0 | Tropical | Dry | [−3; 6] | −15,−23 | −34,−34,−30 | −6.6 | −14.7 | −4.7 |
| 5 km | Channels | Humid forest | Very humid | [−5; 14] | −7,−19 | 8.9 | 0.8 | 10.8 | |||
| 7.5 | −2 m | Lacustrine | −6.0 | Idem | Dry | [−3; 6] | −2 | −21,−23,−10 | 5.0 | −3.1 | 2.9 |
| – | ? | More open | Humid | [−4; 10] | −2 | 10.7 | 2.6 | 8.6 | |||
| Very humid | [−5; 14] | −2 | 14.3 | 6.2 | 12.2 | ||||||
| 3.5 | +1 m | Lacustrine | −4.0 | Forest | Very humid | [−5; 14] | +1 | −4,−2,+4 | 16.1 | 8.0 | 12.0 |
| – | Ponds | Expansion | |||||||||
| 2.5 | +1 m | Lacustrine | −2.8 | Forest | Dry | [−3; 6] | +1 | −3,+1,+5 | 8.6 | 0.5 | 3.3 |
| – | Ponds | decline | |||||||||
| 0 | +0 m | Palustrine | 0 | Periaquatic | Dry | [−3; 6] | 0 | +1,+3,+10 | 8.1 | 0 | – |
| – | Ponds | & sahelian |
- • the onset of sedimentation (11.5 ka);
- • the establishment of a humid vegetation (10 ka);
- • the forest opening (7.5 ka) after the AHP maximum;
- • the maximum humid vegetation state during the 4–3 ka humid pulsation (3.5 ka);
- • the slow decline of humid vegetation, despite more drastic conditions (2.5 ka).
Three different infiltration rates were used along with three climate qualifications: dry, humid and very humid. Since the past interannual recharge rate R is unknown and since climate models are of little help because they consensually predict no change in precipitation (P) nor evapotranspiration (ETR) in this area [3], qualitative trends were the only option at that stage. Present-day (1975) climate was assumed to reflect dry conditions. Then we chose to characterize humid (very humid) conditions by 50% (100%) higher P and 48% (97%) higher ETR, with R = P − ETR. ETR was chosen not to raise as fast as P to prevent unrealistically low piezometry in the northern lands that have a net evaporative balance. This is consistent with the decrease of ETR/P when P increases due to the concomitant atmospheric cooling. Moreover, the proposed doubled recharge is sufficient to generate a heavy seepage on the northern flank of the Thiès Plateau whatever the scenario. This means that: (i) higher values of R would generate more run-off but little more net-infiltration; (ii) head gradients downhill would not be much affected. Except if significant reinfiltration occurs, the very humid scenario can be considered as an upper-limit infiltration forcing.
4 Results and discussion
The main model outputs are: (i) the watertable general morphology; and (ii) the hydraulic head in the mesh that contains the Diogo niaye, and along a transect perpendicular to the sea. Each of the contrasted forcings yield different piezometric responses (Fig. 4), that are confronted with pollen-reconstructed vegetation.
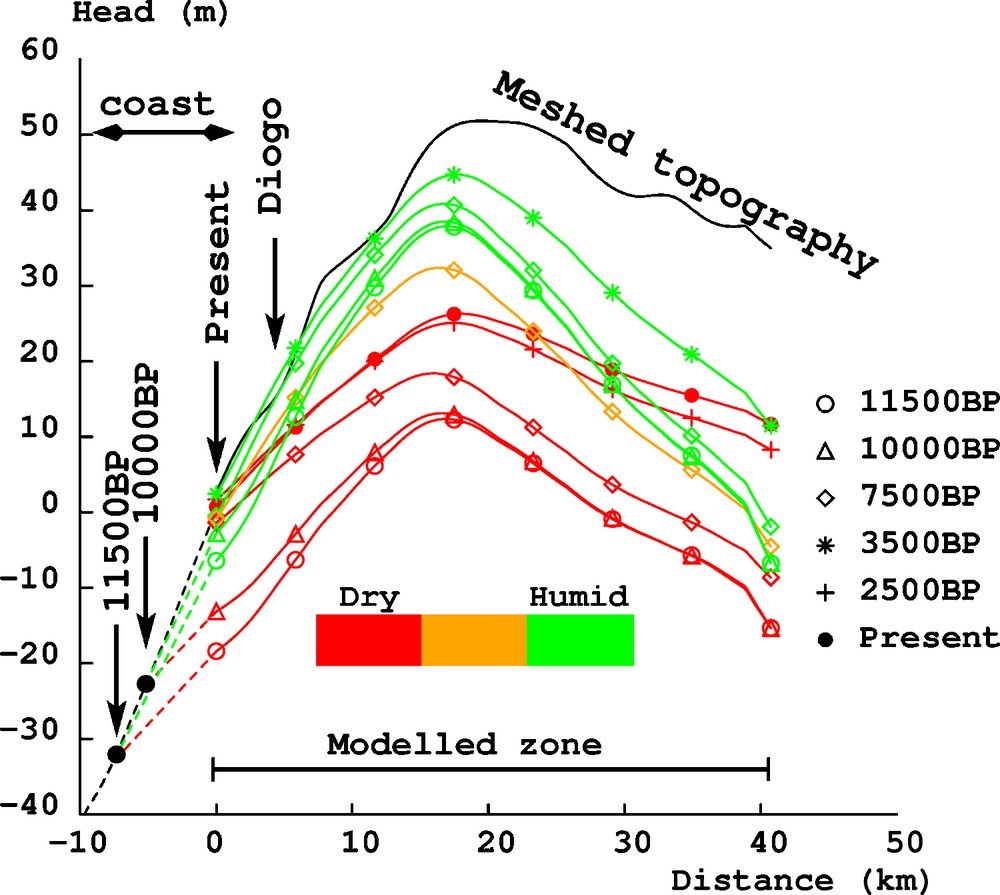
Model results for the different scenarios along the transect drawn Fig. 1. Curves were smoothed for visibility but hence are less precise than the values presented on Table 1. Dashed lines show in black the present-day bathymetry, and in color the position of the extrapolation of the head to the palaeocoast for the lowest sea-levels. Colors indicate the recharge scenario: (red) present, (orange) intermediate, (green) high.
Fig. 4. Résultats du modèle pour les différents scénarios, le long du transect représenté Fig. 1. Les courbes ont été lissées pour plus de lisibilité, et sont moins précises que les résultats bruts du Tableau 1. Les pointillés correspondent, en noir à la bathymétrie actuelle, en couleur à l’extrapolation de la charge jusqu’au rivage d’alors. Un code couleur indique l’intensité de la recharge : (rouge) actuelle, (orange) intermédiaire, (vert) élevée.
4.1 Zonal hydrogeology
Some general features persist independently of the simulated forcings: the main recharge occurs at the flanks of the southern elevation, and the centrifugal flows are directed towards the coast, inland, and sometimes to the Senegal river. The eastern boundary sucks water from the Plateau when rainfall is sufficient but dry events associated with deep continental piezometric depressions induce eastward flows as high as to drain saline oceanic water directly from the northern part of the coast. The watertable always remains more than 40 m below ground in the north-eastern part of the studied region. It may, however, have been close to the surface in some places along the coast even if sea level was low, mainly because of the gentleness of the topography. The cross-section of the head perpendicular to the coast (Fig. 4) shows clearly that infiltration controls the overall level of groundwater. The influence of the eastern boundary condition remains beyond the central piezometric ridge. It is stronger in a dry climate because of the associated weakening of the head gradients. The sea level is the dominant factor close to the coast but its influence diminishes quickly landwards, so that equal groundwater levels at Diogo can occur under different combinations of forcings. Head gradients increase with infiltration but are limited by the topography, that allows excess-water seepage on the flanks of the Plateau, thus producing additional run-off. Consequently and despite significantly permeable media, subsurface flow to the coast did not vary by a factor higher than 2 or 3. This means that transfers of water would have mainly occurred by surface run-off during the wet episodes.
4.2 Close-up on hydrogeology at the Diogo niaye location
4.2.1 Estimation of local head
The influence of zonal hydrogeology on underground-water import to the Diogo depression is accessible to analysis by focusing on the head calculated in the 13 km2 cell that contains the niaye. The underlying assumption to such a methodology is that the head variations at the surface of this 3D mesh (zonal) is representative – in sign and amplitude – of the head variations at the bottom of the Diogo niaye (local); thus a constant bias would exist between the local and the zonal variables. The present-day estimate is calculated as Hcalc = 8.1 m at the central point of the triangular surface of this cell, and the altitude Zmesh of this node equals 16.1 m. The inundation of Diogo niaye in 1975 being very light (Hreal1975 ≈ Hreal button), writing Hcalc − Zmesh −ΔHbias −Hreal 1975 − Zreal button ≈ 0 leads to a shift −ΔHbias ≈ 8 m. This value needs to be subtracted to forthcoming Hcalc to account for the scale effect, as well as other artifacts pertaining to global model error, imprecise parameters, local topography, etc. For comparison, Hreal 1975 must have been slightly higher than Zreal button = 7.5 m because the niaye was inundated at that time. The calculated value Hreal 1975 = 8.1 m is thus very close to the actual one. In the following, will stand for Hcalc − ΔHbias in Diogo mesh. Results are summarized in Table 1.
4.2.2 Local head variations
is highest in the humid scenario at 3.5 ka, when all forcings are positive and it is symmetrically lowest in the dry scenario of 11.5 ka. In this framework, the total range in head is about 28 m, decreasing to 18 m (resp. 10 m) if only dry (very humid) scenarios are considered, which stresses the stronger sensitivity to nonclimatic forcings if infiltration is poor. The infiltration rate selected for very humid scenarios is yet insufficient to counterbalance the combined effects of low sea-levels and highly draining inland piezometric depressions such as the ones prevailing during the Late Pleistocene (11.5 ka and 10 ka). When they get closer to their present-day value, these two factors loose their appreciating or depreciating potential.
Infiltration alone changes HDiogo by a maximum of 13 m. Additional sensitivity analysis showed that sea level variations between −33 m and +2 m generate associated fluctuations of HDiogo by 10 to 14 m only. The effects of low sea-levels were thus significantly mitigated by the smooth topography of the coast and of the continental margin. Similarly, the hydrogeological continental forcing has a modest impact at Diogo of no more than 4 m. On its side, intense groundwater recharge mitigates low sea-level depleting effects. High sea levels prevent significant incidence of continental depressions but is unable to compensate failing infiltration. Hence, we conclude that the trade-off between the forcings investigated here is high: precipitation and sea-level have commensurate effect on the local piezometry; continental hydrogeology is less important. After ca. 7.5 ka (and probably earlier), the local water availability is modulated by precipitation around an averaged level controlled by the proximity of the coast.
4.2.3 Inundation
Here, the consistency of the computed ΔI (increase of hydraulic head excess above the depression bottom, compared to present) is checked versus the observation in the niaye of: (i) lacustrine/palustrine conditions; and (ii) vegetation.
Lacustrine conditions are consistently obtained in the 7.5 ka scenarios and later, but the model fails to relate the observed palustrine conditions of Late Pleistocene–Early Holocene, described as “wetlands without flow” by Fall [12], to the humid conditions that Gasse reports at that time [17]. Intermediate infiltration is necessary for the model to yield palustrine conditions (ΔI lower or close to 0 m) at Diogo before 10 ka. At this stage, it is hard distinguish the reasons for this discrepancy among equivocal sedimentological indicators, imprecise datation, model errors or local-scale effects.
High groundwater recharge at ca. 11.5 ka yields a high and stable inundation of the niaye between 11.5–10 ka, despite the specified change in the boundary conditions. This contrasts with the dominant periaquatic vegetation and the absence of tropical trees, that would rather correspond – if equilibrium were assumed – to a more moderate recharge. The pollen record shows tropical humid forest flourishing around 10 ka only. Non climatic triggers may explain such a long time-lag (see below) without questioning the return of a wet phase after the 12.4 ka event [17]. After 7.5 ka, all very humid scenarios yield ΔI above 10 m; in dry ones, ΔI ≈ 3 m only and conventionally reaches 0 m for present. The vegetation transition ca. 8.2–7.5 ka may then be explained by minored infiltration. While forest persistence in Diogo suggests a moderate decrease, Touba Ndiaye record (then very similar to present) would rather suggest a more drastic collapse. More investigation is needed to understand the role of local specificity. The forest expansion ca. 3.5 ka and its decline ca. 2.5 ka in Diogo and Touba Ndiaye are consistent with high groundwater recharge and present one respectively. Since subsidiary water influx did not change significantly since 7.5 ka, it can be deduced from the model and its assumptions that the presence of forest in Diogo niaye around 3.5 ka resulted from an increased recharge to the aquifer. It appears thus out of phase with the 4.0 ka dry spell over the Sahel described by Gasse [17].
These results also highlight sedimentation as an important factor in controlling the inundation of the depression.
Assuming that the onset of vegetation at ca. 11.5 ka is a sign of climate moistening, what could then explain the 1500 yr time-lag before tropical forest installation? On the one hand, this could be the time necessary to tropical humid biomes, absent from the area, to migrate from the subtropical belt. On the other hand, tropical forests require soil water availability all year long, so that rainy seasons (no matter how long or strong) must be backed up by groundwater during the dry seasons. Sporadically flooded dead meanders and depressions are good candidates for perennial humid soils and they are controlled by groundwater level, contrarily to river banks that dry out seasonally. The computations show that 11.5 ka is a time at which head depletion by low sea level had become light enough to allow shallow groundwaters at the bottom of the Diogo depression, even during low infiltration periods. Rising sea levels may then have triggered a year-long groundwater availability in the niaye, at a date during Pleistocene that would have depended on the altitude of their bottom, their distance to the sea, and local hydrogeological features. Then patches of tropical forest near the coast would have made possible their progressive migration uphill, according to sea level rise and without significant ecosystemic delay. Evidence of the presence or absence of tropical forest taxa in the 30–40 m deep continental margin along the niaye coast before 10 ka would help in determining which of these two colonization scenarios occurred.
5 Conclusion
The mesoscale hydrogeological modeling of groundwater equilibrium for different representative scenarios of the Holocene has shown the complex trade-off between precipitation, sea-level variation, seashore distance, sedimentation rate, and large-scale transient hydrogeology. These factors affect, at the local scale, the hydrogeology of the niaye area, with their own respective dynamics. They generate contrasting and complex hydrological patterns. Precipitation is definitely a primary forcing. Groundwater depletion by low sea-levels was significantly mitigated by the subsequent coast distancing, so that the gentleness of the topographical and bathymetrical slope became also an important factor. Continental boundary conditions related to inland depression refilling played a role in the morphology of the groundwater at the scale of the modeled area, but did not have a decisive impact on the local hydrogeology of the niayes.
On the whole, the pollen assemblage record is consistent with the general evolution of climate since Late Pleistocene [17] if not for a few discrepancies: (i) The first development of vegetation in the niaye system is consistent with the end of the 12.4 ka dry event, with a notable delay before tropical forest installation. However, the sea level was so low before the Early Holocene that, combined with low continental groundwater levels, it had a higher impact on hydrogeology than infiltration rate. A sea level rise may then have acted as a trigger on soil water availability at the bottom of the depressions during dry seasons, and may have prevented the year-long soil humidity required by a tropical forest before 10.5 ka. Such a forcing would be pertinent in the case where tropical biomes were available nearby for colonization. Otherwise, the slow ecosystemic transition of biomes from the subtropical belt would simply explain such a time-lag. (ii) Tropical forest decline in Touba Ndiaye is consistent with the 8.2 ka dry event, but the model predicts low inundation of Diogo niaye under low infiltration rates, whereas degraded forest persistence would rather suggest a moderate infiltration decrease. This indicates a local specificity of Diogo niaye, and the necessity of more detailed studies addressing the precipitation/infiltration relationship. (iii) Since sea-level and continental hydrogeology have very weak impact on niaye groundwater after 7.5 ka, the forest expansion around 3.5 ka in both niayes, as well as its retreat at ca. 2.5 ka, should be directly related to climate, and thus differ from the chronology observed more eastward over the Sahel. Progress in the modeling of climate over western Senegal would certainly help in confirming these discrepancies.
The different observed chronologies of the niaye records remain to be explained. The precise understanding of niaye ecosystem during the Holocene thus requires one to: (i) decrease the size of the modeling scale and include local hydrological specificity; (ii) better identify both localisation and intensity of past infiltration; (iii) incorporate vegetation dynamics and its self-organization with hydric stress; (iv) explore transient water availability; and finally (v) progress towards more a reliable climate modeling of the Sahelian region.
Acknowledgments
This project has been financed by the French National Research Agency (ANR) in the framework of the SAHELP project (Sahara and Sahel vulnerability: lessons from the past). We wish to thank Anne-Marie Lézine for the palynological studies, along with the Fossil Pollen Database that made the pollen assemblage diagrams available. SRTM topographic data are a courtesy of NASA/NGA/USGS. We thank University of Wollongong (Australia) for providing the CatchmentSIM hydrological data processing software until 2007. The geological and hydrogeological data sets were produced by BRGM, UCAD, and the Ministries of Rural Hydraulics and National Hydrographic Network of the Republic of Senegal.
1 Subsurface flow (m/s) is controlled by the gradient of the hydraulic potential H (the piezometric head, or head) and by the hydraulic permeability K, using Darcy's law: U = −Kgrad H. H is reflected by the watertable altitude.