

1 Introduction
Various recent studies have highlighted:
- • the accelerative role of vascular plants on weathering of calcic and magnesian silicate rocks and the decrease of atmospheric CO2 [3];
- • the factors of growth and mortality of trees and the different conditions of vulnerability of forest ecosystems [5];
- • the destruction of the latter as a factor of CO2 increase resulting in the increase of the principal risk of climate change for future decades [19];
- • the impact of “brulis” on the retarded recolonization of savannas by forest [38];
- • the human influence on biosphere and on the interaction of ecosystems and sociologic ones [10].
This article emphasizes the study of tropical forest which plays important ecological and economic roles in many countries. In recent years, they were particularly studied because of their high rate of deforestation [13]. Thus, tropical deforestation proceeded at the rate of 14.2 million ha per year between 1990 and 2000 [14]. This study reported a deforestation rate of 117,000 ha per year in Madagascar, i.e. about 1% of the forest area disappears annually. This rate varied from 100,000 to 300,000 ha per year according to zone and period of evaluation considered according to the method used by the authors. In the South-West of Madagascar, Lasry et al. [28] reported that about 55% of the primary forest was cleared between 1971 and 2001 with a mean rate of 125,000 ha per year. This rate has substantially increased over time, since it has risen from 59,000 ha yr−1 between 1971 and 1986 to about 200,000 ha yr−1 between 1986 and 2001, which is quite alarming for the tropical region.
Such an evolution is correlated with the agrarian dynamics in the region. Maize, partly a cash crop, partly a space consumer, has taken up a primary place through the slash and burn cultivation system, which was well described in [4].
Thus this study is trying to characterise the semi-arid ecosystem's responses to these two levels of disturbance. Its objectives were to follow the variations of some vegetation and soil properties on a set of plots aged of 2 to 30 years and evaluate its resilience.
2 Study site and sampling
2.1 Site studied
The study region is located about 100 km north of Toliara, to the west of the village of Analabo (22°31′50″S; 43°33′50″E), and includes part of the Mikea forest.
The region's climate is semi-arid with an annual rainfall ranging from 600 mm on the coast to 1000 mm in the interior. It is 883 mm in South Befandriana (Fig. 1), which is about 100 km north of our site, over the 1935–1994 period [16], with a mean annual temperature of 24.1 °C (15–20 °C during the coolest month, and 7–8 dry months). In fact, the dry season (with a monthly rainfall below 50 mm) lasts from April until October, whilst the rainy season, including 90% of the rains fall, lasts from November to March [22]. It is now certain that Madagascar was inhabited by man during the major part of the Quaternary. The most probable estimates of man's arrival [11] in the light of present knowledge vary around the middle of the first millennium of our era [2]. Burney [6] had previously suggested that man arrived more early in Madagascar, i.e. circa 2000 yr B.P. However, this arrival only concerned some humans of Indonesian origin who settled on the northeastern coast of Madagascar and did not affect the study's area located on the western coast. The people of the latter region are Mikea which have a special way of life based on hunting and gathering in the forest and in the bush [1,35,46]. This numerically small group has only a slight influence on the environment and the landscape. In fact, except the very weak impact of Mikea people who did not use burning, the forest studied remained intact up to 1945–1950, when deforestation and extrativism started. The forest has very long been considered by natives with revulsion, as an environment hostile to human occupation. The first pluvial cultures developed on slash and burning soils began only in the 1960s in villages with a low population density (lower than 10 inhabitants by kilometre square in the whole region) preferentially settled outwith the forest. Maize is planted in hills with a stick or hoe in the friable sandy surface soil, which is not otherwise disturbed. Farmers abandon the field to savanna re-extension some 4 or 5 years after clearing, mainly because of fertility decrease, presence of weeds and the need to clear new land in order to plant maize.
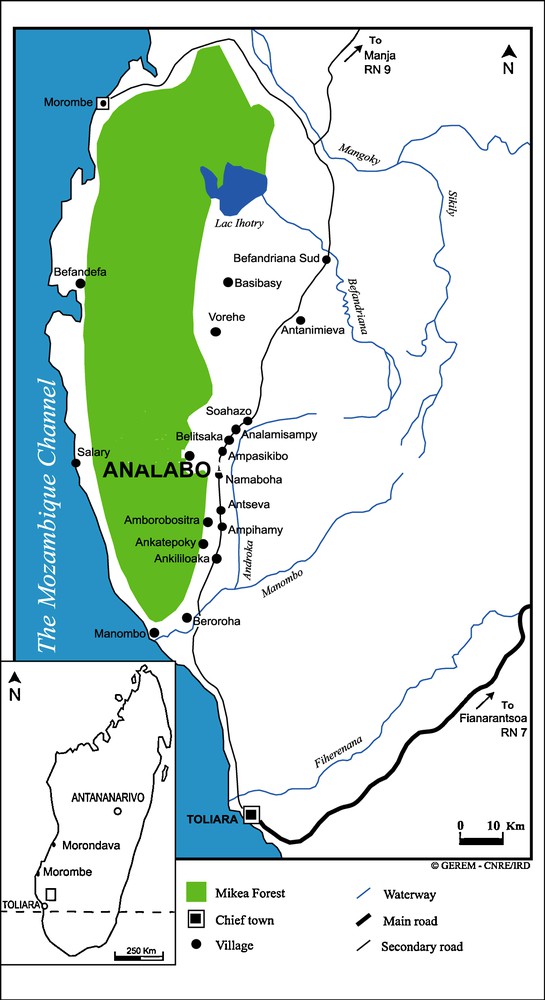
Location of the study zone.
Localisation de la zone d’étude.
Abandoned fields aged 2, 4, 6, 8, 12, 20 and 30 years, hereafter named (A2, A4, …, A30), including different ecological reference systems relative to undisturbed primary forest (PF) and woodland savanna (WS) were sampled within the study zone. On-going studies (isotopic and chemical studies) on the origin of this savanna seem to indicate that the latter is not anthropic. The time elapsed since abandonment was obtained from the owners of the fields, the figures being confirmed by cross-checking among several other villagers. This abandon generally had the same cropping record, consisting of 3–5 crops of maize following slashing and local burning.
After being abandoned fields are usually used for grazing or wood gathering.
The type of breeding is extensive with 0.6 zebu per inhabitant and a small number of cattle heads per herd, i.e., most frequently less than 12. In addition, wood gathering in deforested zones remains marginal around villages. Consequently, breeding and gathering of wood on fallow lands are not activities with an important impact upon the environment.
The original plant community, which was cleared to establish crops, corresponds to the dense primary dry forests of Dalbegia, Commiphora and Hildegardia described by Humbert and Cours Darne [25]. Raherison and Grouzis [41] reported that this multi-layered canopy was composed of a discontinuous upper layer 8–12 m high, topped by emergent Delonix adansonioides R. Vig. Cap., Givotia madagascariensis Baill. and Adansonia za Baill., which may reached 16 m. The middle layer, 3–8 m high, was continuous and dense and was composed mainly by Poupartia sylvatica H. Perr., Anacolosa casearioides Cavaco & Keraudren, Euphorbia laro Drake and Dalbergia greveana. The woody lowest layer, below 3 m was however quite sparse (Adenia olaboaensis Claverie and Diospyros humbertii H. Perr.). There is no herbaceous layer in this primary forest with the exception of Lissochilus humbertii H. Perr.
Forest ecosystems from South-West Madagascar are thus affected by two kinds of perturbation:
- • an intense perturbation occurs during the cropping phases and is related to slash and burn cultivation, yearly culture and fire; it is spatially concentrated and recurrent;
- • other disturbances take place during the post-cropping phase; they are less intense, diffuse, impredictable and more or less extended in time as related to duration of cultivation abandonment.
The study sites are all located on slightly leached or unleached ferruginous tropical soils in the French soil classification [9], or cambic arenosols in the FAO, Unesco classification [12,15], developed on the Quarternary post-Karimbolian dune formations [30]. Thirty pits were opened for field description and sampling.
3 Methods of study
3.1 Biotic parameters
The method of a total estimation of above-ground biomass and of the below-ground biomass was carried out according to [41].
3.1.1 Estimation of above-ground biomass
The method of total harvest used the method of Murphy and Lugo [37]. Five plots of 5 m × 5 m were sampled. The vegetation in each sampling unit was cut at ground level and sorted in six fractions. These samples were oven-dried at 85 °C to constant weight.
3.1.2 Estimation of the below-ground biomass
Soil coring [21] was used to measure root mass. The auger used (internal diameter = 80 mm) was a Lindqvist International XOK-37,00. In the laboratory, the roots were separated from the soil by double sieving under a water jet and oven-dried at 85 °C for 24 h and weighed.
3.2 Soil physical parameters
Bulk density was measured in the different horizons of the soil profile at the study site by two methods: for soils with a single grain structure, a constant volume was weighed; for those with a fragmental structure (A30), the volume of water displaced by a previously-weighed clod coated with paraffin wax was measured. Five replicates were carried out for each soil horizon.
The permeability of the surface layer was recorded using an infiltrometer (a metal cylinder 25 cm long and 10 cm diameter, driven 5 cm into the soil), with 10 replicates at each site, sampled in a straight line. The measurement consisted of recording the time taken for 1 l of water to infiltrate, the results being expressed in millimetre per second. The higher the value, the greater is the permeability.
Compaction of the surface layer was measured with a penetrometer (Proctor penetrometer ASTM D1558, Spring type). The depth of penetration of the probe (probe head 0.5 cm in length) corresponding to a constant force of 100 lbf (70 kgf cm−2) was measured. Twenty replicates were distributed along a line at 2 m intervals at each point. The results were expressed in millimeter per 70 kgf cm−2. Compaction is inversely proportional to the depth of penetration, in other words, the greater the value, the softer the soil. These three parameters were measured at the height of the dry season (July).
Soil samples (four composite samples each of five sub-samples at each site) were taken from the surface (0–10 cm) at the end of the rainy season, i.e. in April. The carbon contents (g kg−1), N (g kg−1), exchangeable K+ (cmol kg−1), Pavailable(mg kg−1), together with those of certain textural fractions (fine sand, coarse silt), were determined by the Antananarivo Radio-Isotope Laboratory. Sand particle size analysis (the 0.05–2 mm fraction) was made by the IRD Soil laboratory in Montpellier by wet sieving and laser diffraction (Malvern Mastersizer). Sedimentological parameters were used to describe the particle size distribution [26]. Three representative percentiles were used: Q1 = first quartile or 25th percentile; Q2 = median quartile or 50th percentile and Q3 = third quartile or 75th percentile. The mode measures the midpoint of the most abundant grain class interval. Dispersion around this mode is an indication of sorting. The Trask Sorting Index (So) = √Q1/Q3 [48] was also used.
3.3 Soil chemical parameters
The Walkley Black's method was used for carbon determination, and that of Kjeldahl for nitrogen. K+ was measured by the cobaltihexamine chloride method (Cohex), and Pavailable by Olsen's method. Analysis of variance and the comparison of means (Newman–Keuls’ test) and principal component analysis were carried out using STAT-ITCF software [20] and the Lyon University ADE4 [47] software respectively.
4 Results
4.1 Biotic parameters
Table 1 shows the following:
- • the presence of a dense original forest, rich in plant species, whose epigeous biomass can reach more than 170 t/ha−1, which is very important and even outstanding in the case of the dry climate and the barren sandy soil observed;
- • as compared with that forest: a strong decrease of the floristic richness of shoots and of epigeous biomass: in fact, after 12 years the floristic richness has been reduced by half and after 8 years the decrease of the epigeous biomass has stabilized but the latter represents only the sixth of that of the original forest: a definitive loss of some forest species, like Gyrocarpus americanus; preservation of other forest species, like Dyospyros manampetsae which disappears after 5 years; species which are foreign to forest such as Fernandoo madagascariensis which appear in the sixth year and are preserved afterwards; appearance of a savanna Graminacea, Heteropogon contortus starting with the 30th year.
Caractéristiques biotiques des sites et écosystèmes de référence échantillonnés. Les binômes en caractères gras correspondent aux espèces ligneuses (fréquence relative) tandis que ceux écrits en caractères normaux correspondent aux espèces herbacées (% de recouvrement). Données extraites de Randriambanona [42] et Grouzis et al. [23].
| Sites | Coordonates | Main vegetation species | Number of plant species (n ha−1) | Tree density (n ha−1) | Above-ground plant biomass (kg ha−1) | Below-ground plant biomass (kg ha−1) |
| PF | 22°30′29′′S 43°31′39′′E |
Gyrocarpus americanus
(7),
Croton elaeagni
(6)
Diospyros manampetsae (6) |
564 | 8628 | 170 590 | 18 510 |
| A2 | 23°31′01′′S 43°33′03′′E |
Dactyloctenium aegyptium (10),Cenchrus biflorus (8) Diospyros manampetsae (30), Hyppocratea urceolus (18) |
344 | 5984 | 8444 | 3527 |
| A4 | 22°31′07′′S 43°33′04′′E |
Dactyloctenium aegyptium (15),Cenchrus biflorus (15) Diospyros manampetsae (27), Hyppocratea urceolus (16) Alchornea humbertii (15) |
356 | 8652 | 11 404 | 4164 |
| A6 | 22°31′32′′S 43°32′54′′E |
Sesbania punctata (12), Boerhavia diffusa (10) Fernandoa madagascariensis (29), Diospyros humbertii (26) |
268 | 6440 | 13 965 | 4963 |
| A8 | 22°31′36′′S 43°33′01′′E |
Abrus precatorius (15–20), Sesbania punctata (5) Hyppocratea urceolus (35), Fernandoa madagascariensis(26) | 344 | 12 404 | 22 629 | 7055 |
| A12 | 22°31′41′′S 43°32′50′′E |
Brachiaria reptans (10–15), Tridax procumbens (10–15) Fernandoa madagascariensis (55), Alchornea humbertii (18) |
260 | 6976 | 26 848 | 10 000 |
| A20 | 22°31′33′′S 43°34′00′′E |
Fernandoa madagascariensis (27), Alchornea humbertii (9), Diospyros manampetsae (7) | 272 | 4112 | 29 939 | 7000 |
| A30 | 22°31′56′′S 43°33′40′′E |
Heteropogon contortus, Sporobolus sp, Fernandoa madagascariensis (33), Rhopalocarpus sp .(13) | 256 | 3380 | 33 804 | 3608 |
| WS | 22°31′54′′S 43°36′41′′E |
Heteropogon contortus (18), Cyperus sp. (3) | 292 | 4508 | 20 000 | 7005 |
4.2 Physical parameters
The variations in clay and silt contents (0–50 μm fractions) are small and are probably due to the origin of the parent material mobilized by the wind: the material on which the soils were developed is always very sandy, the proportion of fine and coarse sand, usually exceeding 85%. Uniformity of the material was checked by granulometric analysis of the sand fraction (0.05–2 mm) in Fig. 2.
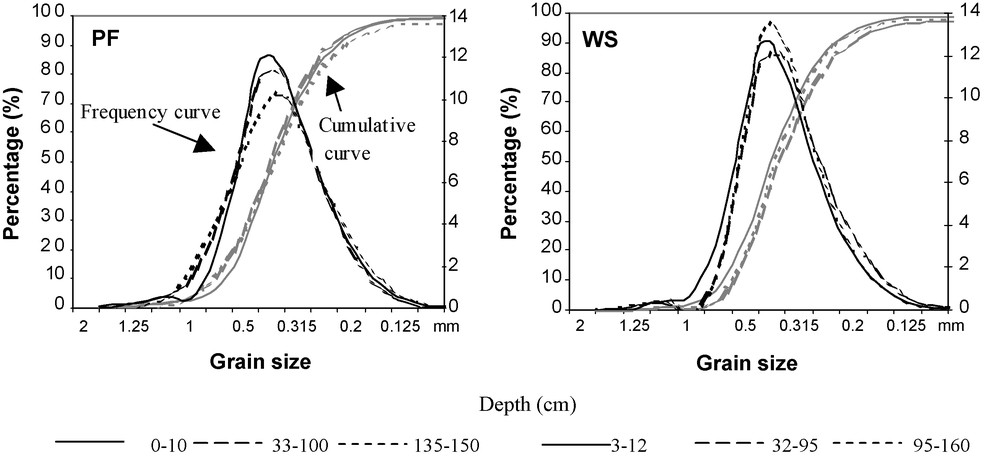
Cumulative and frequency curves of the grain size sand fraction (0.05–2 mm) for different soil layers in the primary forest (PF) and in the woodland savanna (WS).
Courbes cumulatives et de fréquence des grains de sable de la fraction (0.05–2 mm) pour différents horizons de sol de la forêt primaire (PF) et de la savane boisée (WS).
The trends of the cumulative and of the frequency curves in Fig. 3 and the statistical parameter values given in Table 2 are remarkably similar and illustrate the vertical homogeneity of the material.
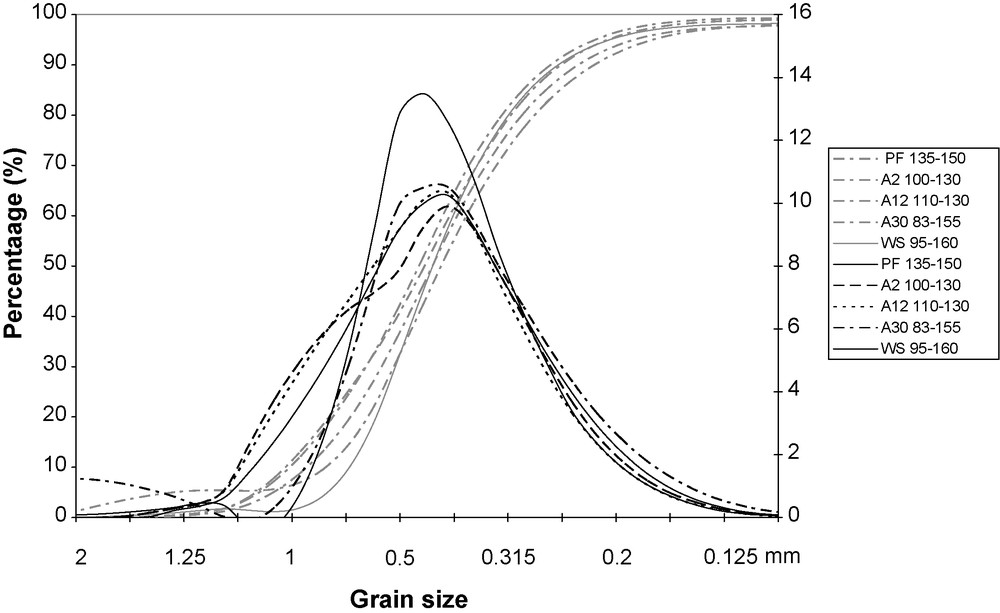
Cumulative and frequency curves of the grain size sand fraction (0.05–2 mm) for different soil layers for deep soil layers of different sequential units. PF: dense deciduous primary forest; A2, …, A30: abandoned fields 2–30 years of age; WS; woodland savanna.
Courbes cumulatives et de fréquence des grains de sable de la fraction (0.05–2 mm) pour différents horizons, à différentes profondeurs, des sols des différents sites de la séquence.
Paramètres statistiques de l’analyse granulométrique de la fraction sableuse des différents sites. Mode en millimètre ; Q1 et Q3 : premier et troisième quartiles en millimètre ; So : Trask Sorting Index (So = Q1/Q3 [45]).
| Units (Soil layers) | Mode (mm) | Q1 (mm) | Q3 (mm) | So |
| PF (0–10) | 0.442 | 0.552 | 0.337 | 1.28 |
| PF (33–100) | 0.455 | 0.583 | 0.348 | 1.29 |
| PF (135–150) | 0.438 | 0.583 | 0.323 | 1.34 |
| A2 (100–130) | 0.452 | 0.626 | 0.337 | 1.36 |
| A12 (110–130) | 0.463 | 0.620 | 0.350 | 1.33 |
| A30 (83–155) | 0.421 | 0.544 | 0.308 | 1.33 |
| WS (3–12) | 0.452 | 0.558 | 0.384 | 1.21 |
| WS (32–95) | 0.419 | 0.524 | 0.315 | 1.29 |
| WS (95–160) | 0.436 | 0.532 | 0.338 | 1.25 |
Likewise, there appears to be an obvious similarity between the distribution curves for the deep soil horizons of the catena, thus indicating a horizontal homogeneity as well. In every case the curves are unimodal, very symmetrical, indicating a thorough sorting; the statistical parameters are remarkably similar and have a Trask Sorting Index (So) around 1.3, signifying that the material is very thoroughly sorted, which is typical of wind-blown material. The aeolian origin of the formation is supported by morphological study of the sands with a binoclar microscopy: the grains are well-rounded with a blunt pitted surface. All the data show that the soils of the study sites were developed from the same aeolian material, thus justifying the comparisons which follow.
The variations in apparent bulk density with depth for the different ecosystems are shown in Fig. 4. The forest reference soil (PF) has the lowest densities from 1.20 at the surface to 1.51 at lower depth (60 cm); the values vary little.
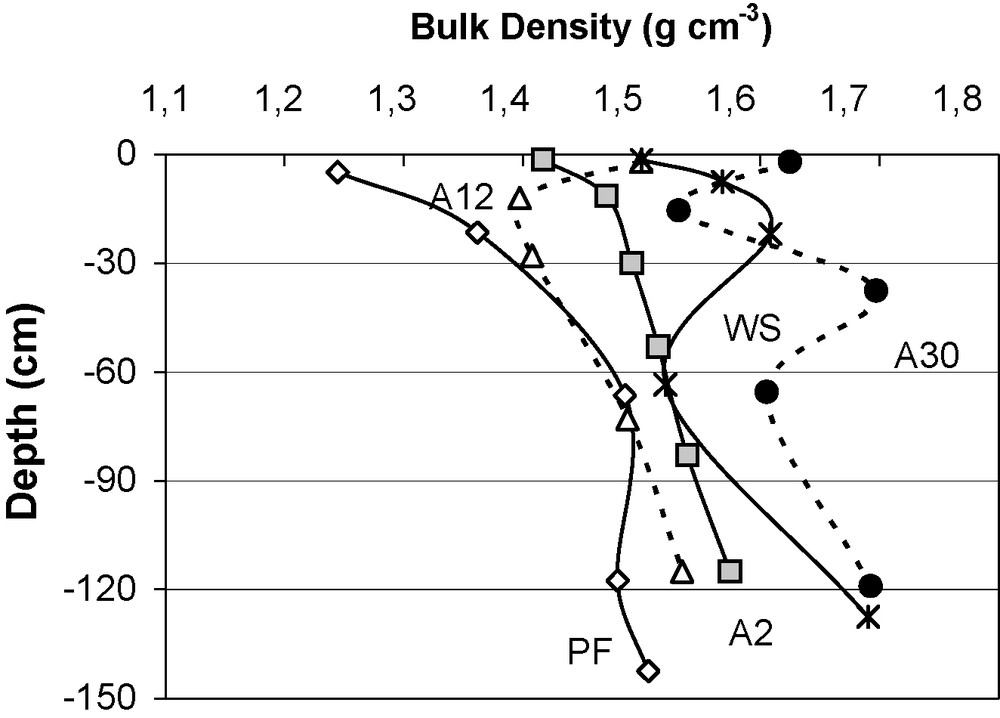
Variations in soil density (g cm−3) with depth in different sequential units. PF: dense deciduous primary forest; A2, …, A30: abandoned fields 2–30 years of age; WS; woodland savanna.
Variations de la densité du sol (g cm−3), à différentes profondeurs, dans les différents sites de la séquence. PF : forêt primaire dense décidue, A2, …, A30 cultures abandonnées durant deux à 30 ans ; WS : savane boisée.
The densities are highest after 30 years’ abandoned fields (A30) and range from 1.53 to 1.70. Note that the distinctly higher density values could be due to the measurement method used for this soil (clod method).
The densities of the soils from abandoned fields from 2 (A2) to 12 (A12) years, and those of the woodland savanna (WS), range between these two extremes. Such variations show that soil density clearly increases during the post-cropping phase, indicating a compaction of the whole profile.
Fig. 5A shows the variations in permeability of the surface layer for the different abandoned fields and ecosystems of the sampled areas.
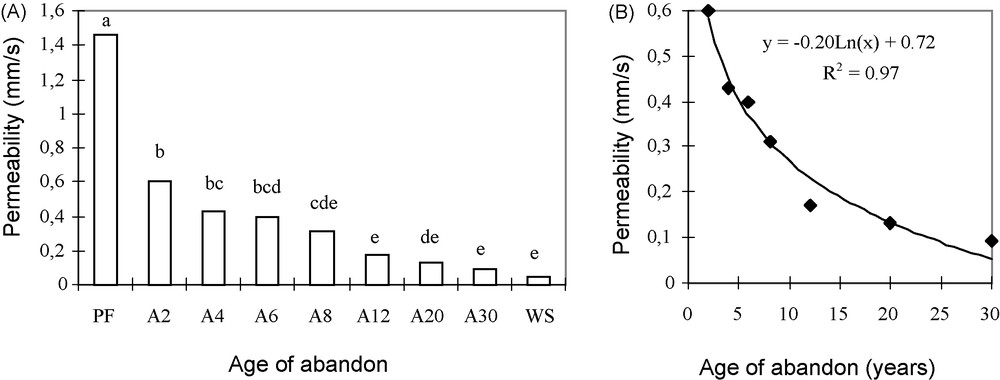
A and B. Variations in permeability of the surface soil layer for different sequential units and its logarithmic fit to the age of the abandoned fields. PF: dense deciduous primary forest; A2, …, A30: abandoned fields 2–30 years of age; WS; woodland savanna. Means with the same letter(s) in exponent are not significantly different at P = 0.05 according to the Newman–Keuls’ test.
A et B.. Variations de la perméabilité de l’horizon de surface des différents sites de la séquence et son ajustement logarithmique en fonction de l’ancienneté de l’abandon cultural. PF : forêt primaire dense décidue, A2, …, A30 cultures abandonnées durant deux à 30 ans ; WS : savane boisée. Les moyennes repérées par une ou de mêmes lettres ne sont pas statistiquement différentes au seuil de probabilité de p = 0,05 selon le test de Newman-Keuls.
It appears that permeability, which was very high in the reference forest ecosystem (1.46 mm s−1) fell progressively in relation with the age of the abandoned field. The values obtained for the oldest abandoned fields (A12 to A30) do not differ significantly from those of the savanna. The mean permeability for the recent abandoned fields (A2–A8) have intermediate values (0.6–0.31 mm s−1). It is possible to fit the decrease in permeability with age of the abandoned fields to a logarithmic function (Fig. 5B), so that 97% of the variation in permeability are explained by the age of abandon.
The compaction of the surface layer increases with the age of the abandoned field (Fig. 6A). It reaches 127 mm in the primary forest, increases rapidly and stabilizes between 10 and 15 mm in the oldest ones (A12–A30) and in the woodland savanna. In these latter sites it is on average 13 times higher than that of the original forest. The increase in soil compaction with age of field abandon can also be fitted to a logarithmic curve (Fig. 6B), but the amount of variation in density (r2 = 87%) is less than that of permeability.
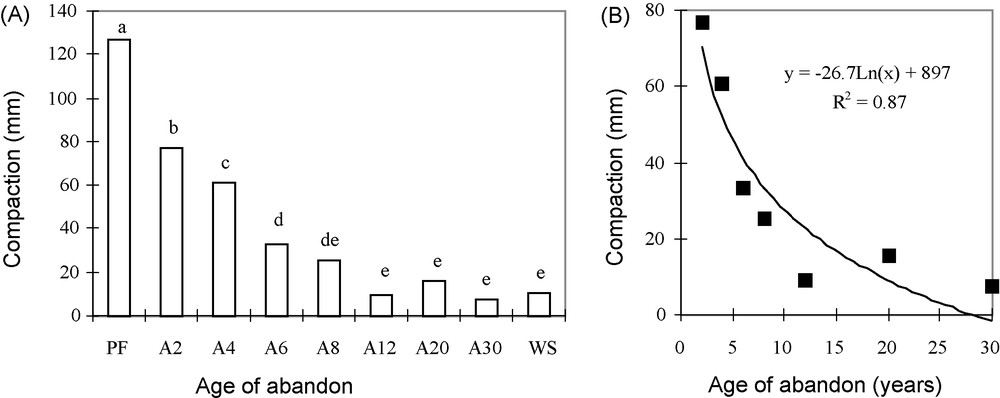
A and B. Variations in compaction of the surface soil layer for different sequential units and its logarithmic fit to the age of the abandon. Means with the same letter(s) in exponent are not significantly different at P = 0.05 according to the Newman–Keuls’ test.
A et B. Variation de la compacité de l’horizon de surface pour différents sites de la séquence et son ajustement logarithmique en fonction de l’âge de l’abandon cultural. PF : forêt primaire dense décidue, A2, …, A30 cultures abandonnées durant deux à 30 ans ; WS : savane boisée. Les moyennes repérées par une ou de mêmes lettres en exposant ne sont pas statistiquement différentes au seuil de probabilité de p = 0,05 selon le test de Newman-Keuls.
We also find a close correlation (r2 = 0.93) between compaction and permeability of the surface soil layer (Fig. 7). Clearing forest soils for cropping is thus accompanied by settling and compaction of the surface layer with a consequent fall in permeability.
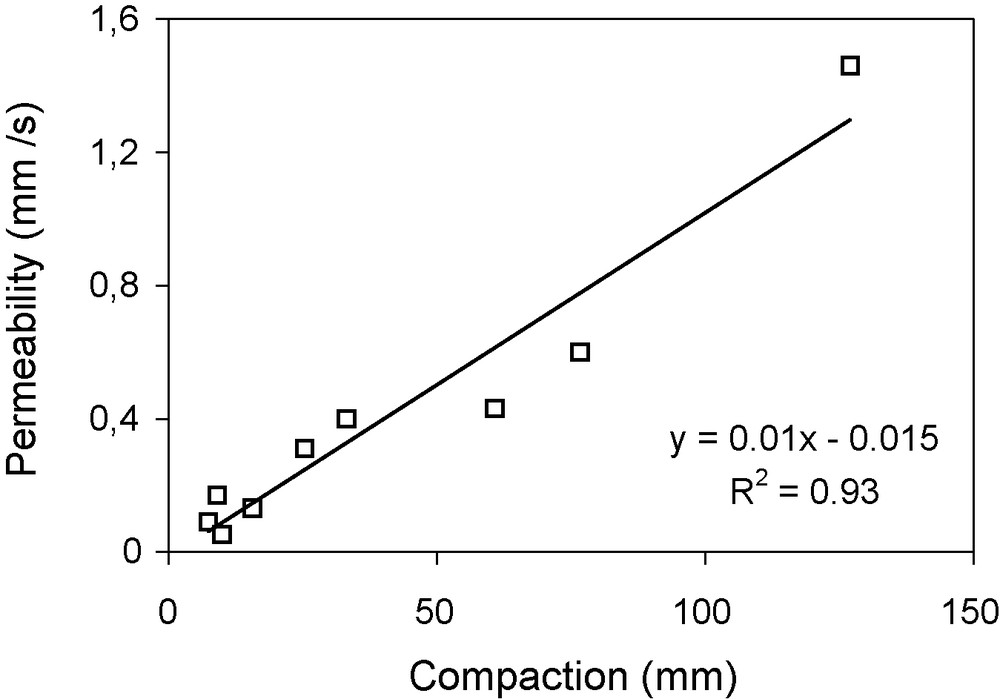
Variation in soil permeability related to the compaction of the surface layer.
Variation de la perméabilité en fonction de la compacité de l’horizon de surface.
4.3 Chemical indicators
Soil chemical indicators (Table 3) are generally less discriminatory than the physical ones as regards to the stages in the succession of ecosystems. C and N content, for example, could only be grouped into three categories: reference forest, 2–20 years, and 30 years of abandoned fields and savannas. Available P content was able to discriminate among all the abandoned fields and the reference ecosystems (forest and savanna). There was no apparent relationship between the exchangeable K+ content and the different ecosystems sampled. Interpretation of chemical data is made difficult by the addition of a large amount of “dead” organic matter from forest roots after clearance and its slow decomposition. On the other hand this material may be excluded through sieving (to 2 mm) when measuring shortly after forest clearing but may be included after the decomposition.
Indicateurs édaphiques caractéristiques des différents sites de la séquence et des écosystèmes de référence de la région d’Analabo. PF : forêt primaire dense décidue, A2, …, A30 cultures abandonnées durant deux à 30 ans ; WS : savane boisée. Lorsque des répétitions ont été effectuées, les valeurs ont été soumises à une analyse de variance. Les moyennes repérées par une ou des mêmes lettres en exposant ne sont pas statistiquement différentes au seuil de probabilité de p = 0.05 selon le test de Newman-Keuls.
| Sites indicators | PF | A2 | A4 | A12 | A20 | A30 | WS |
| C (g kg−1) (0–10 cm) | 0.162a | 0.101bc | 0.088bc | 0.129ab | 0.099bc | 0.063cd | 0.062cd |
| N (g kg−1) (0–10 cm) | 0.015a | 0.009bc | 0.008bc | 0.011b | 0.009bc | 0.005cd | 0.005cd |
| K (cmol kg−1) (0–10 cm) | 0.08bc | 0.15bc | 0.06bc | 0.3a | 0.31a | 0.14b | 0.10bc |
| P (mg kg−1) (0–10 cm) | 2.8b | 7.6a | 6.6a | 8.8a | 9.6a | 9.4a | 3.6b |
4.4 Evolution of the ecosystems
Principal component analysis (PCA) is a good method for representing the evolution of ecosystems [29] during the post-cropping phase and for judging their similarity with reference ecosystems. PCA was therefore applied to the chemical parameters in Table 3 together with the compaction, permeability, proportion of fine sand and coarse silt in the surface layer (seven sites and eight variables). Fig. 8A and B shows the correlation circles (A) and the projection of points representing different ecosystems in the primary plane of the PCA (B).
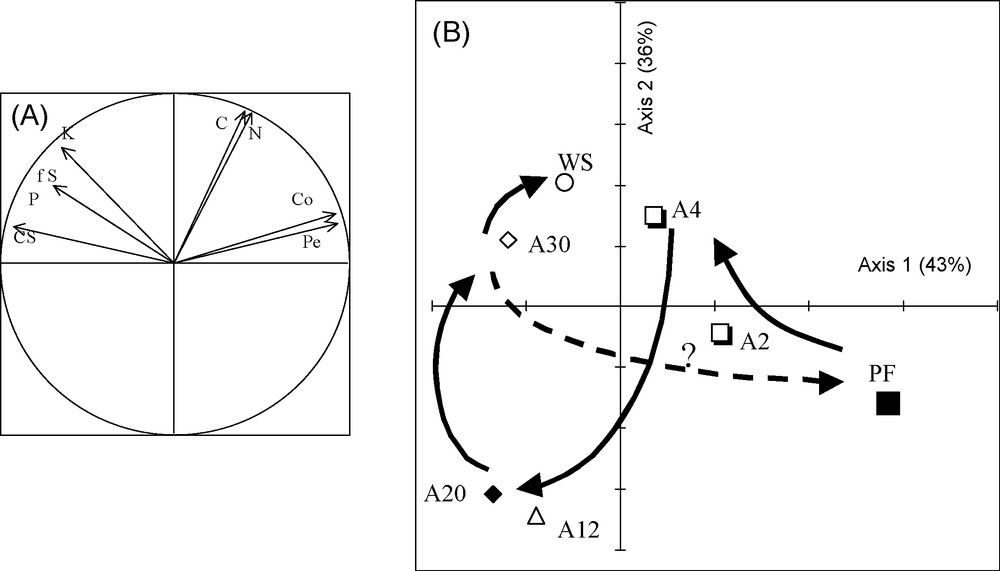
Sequential units and referential ecosystems dynamics according to soil indicators: correlation circle (A) and positional diagram for the primary plane of the PCA (B). PF: dense deciduous primary forest; A2, …, A30: abandoned fields 2–30 years of age; WS; woodland savanna; Co: compaction; Pe: permeability; fS: Fine sand; CS: coarse silt; C, N, K and P: contents of carbon, nitrogen, potassium and available phosphorus in the surface layer (0–10 cm). Means with the same letter(s) in the exponent are not significantly different at P = 0.05 according to the Newman-Keuls’ test.
Dynamique des sites de la séquence et des écosystèmes de référence sur la base des indicateurs édaphiques : cercle de corrélation (A) et diagramme des relevés dans le premier plan de l’ACP (B). PF : forêt primaire dense décidue, A2, …, A30 cultures abandonnées durant deux à 30 ans ; WS : savane boisée ; Co : compacité ; Pe : perméabilité ; Fs : sables fins ; cS : limons grossiers ; C, N, K et P : teneurs en carbone, azote, potassium et phosphore assimilable de l’horizon de surface (0–10 cm). Les moyennes repérées par une ou de mêmes lettres en exposant ne sont pas statistiquement différentes au seuil de probabilité de p = 0,05 selon le test de Newman-Keuls.
The primary plane of the PCA accounts for 79% of the total variability. The primary axis is strongly correlated with the physical parameters codified as follows: permeability (Per), compaction (Co) on the positive abscissae, and fine sand (fS), coarse silt (cS) on the negative abscissae, while the second axis is strongly correlated with chemical parameters: C, N, K+ (Fig. 8A).
Examination of the arrangement of points representing ecosystems (Fig. 8B) reveals that the forest ecosystem cut down, burned, cultivated and abandoned is very different in all its edaphic characteristics from its original state, and closely resembles the woodland savanna.
Therefore, it can be concluded that the disturbed and abandoned forest ecosystem evolves towards a savanna type and not towards forest.
5 Discussion – conclusion
After the slash and burning of a non-disturbed dense and dry forest and followed by maize cultivation without tillage during 4–5 years and finally abandoned, the principal changes highlighted over the years are the following:
- • for the vegetation, an important loss of the floristic richness and of biomass. If lasting, the losses testify to the weak forest resilience, whilst practically everywhere in the world and particularly in Africa, for similar conditions, forest extends at the expense of savanna [45];
- • for the soils, during the post-cultivation phase:
- o a strong increase of bulk density and compaction of the surficial horizon and correlative decrease of the various physical parameters results in a cultural system of savanna type and not of forest one,
- o an evolution of chemical indicators less discriminating than the physical parameters. C, N, K and P content measurements are on the other hand more difficult to interpret.
These results corroborate those of Chotte et al. [8], Pontanier and Roussel and Roussel [40], Masse et al. [32] who reported that the physical parameters of the soil such as porosity, apparent density, permeability and water storage capacity are relevant indicators for following the evolution of soils during cropping and abandoned fields or for explaining the effects of different ways of using fire. Many authors give prominence to change in the post-cultural evolution: increase of bulk density and compaction and decrease of soil permeability [7,27,31,39]. Masse et al. [32] also reported that different burning practices had no fundamental effect on the chemical indicators of the soil (C, N, CEC, exchangeable bases, P) after 4 years of abandoned fields. These observations confirm the work of Menaut et al. [33] on savannas.
In the semi-arid zone of the South-West Madagascar the specificity consists of post-cropping trend towards the savanna, characterized by rapid and irreversible degradation of several soil properties, notably physical ones. In other words, the primary dense dry deciduous forest does not regenerate. This result agrees with that obtained by Grouzis et al. [23] from biotic indicators in the same area. It is original in that it differs from those usually obtained in other more humid parts of Madagascar and the tropics generally. In particular the works of Rasolofoharinoro et al. [43], Gautier et al. [18] showed that partial regeneration of the medium-altitude rainforest is possible, though very slow (20–40 years). For Africa, the works of Guelly et al. [24] in Togo, of Mitja and Puig [34] in the Ivory Coast, and of Roussel [44] in West Africa show that the regeneration of the original vegetation seems possible both for forests in a wet climate and for savannas with an environment with distinct seasons, always provided that it is protected from fire.
Various reasons may be cited to explain the low resilience of the forest systems of South-West Madagascar abready emphasized by Morat [36]:
- • intensity and duration of disturbance;
The cropping phase, which generally lasts 5 years, but sometimes 7–10 years, exhausts the regeneration capacity of the system. In West Africa, it is clearly removal of trees stumps or uprooting and duration of cropping which are the predominant factors in the regressive trend [12,17]. Furthermore, although abandoned, the formerly cultivated land is used for grazing and suffers the ravaging of recurrent fires which thwart the regeneration of the systems.
- • environmental conditions.
The post-cropping dynamics in the semi-arid South-West of Madagascar (the Analabo region) are therefore characterized by a trend towards savanna, the consequence of the intensity and duration of the disturbance being represented by the cropping phase and the more drastic climatic and soil conditions. Such a regressive evolution is demonstrated at the soil level by a degradation of the physical properties: an increase in soil density and compaction, a fall in permeability and generally a degradation in fertility (C, N) of the surface layer, although the chemical indicators are less discriminatory of the different evolution stages. In these conditions, the practice of shifting cultivation in South-West Madagascar is revealed to be seriously damaging and takes place at a huge ecological cost.
Acknowledgments
The authors are deeply indebted to José Honnorez who has greatly improved the English language of the document.