

1 Introduction
Paleomagnetic and magnetic fabric techniques usually recommend the use of fine-grained rocks for magnetic analysis (e.g. Tarling and Hrouda, 1993; Tauxe, 1998). The main purpose of this recommendation is to avoid the possible paleocurrent imprint in the magnetic record for strain analysis and noise from the magnetic inherited remanence of large particles. In the case of magnetic fabric studies for determining strain, finer sediments can be a better-suited lithology for AMS analysis because: (i) paramagnetic minerals do not usually show different grain anisotropy and magnetic anisotropy, as ferromagnetic minerals can exhibit; and (ii) clay minerals is a more sensitive strain marker.
The Eocene turbiditic Jaca-Pamplona basin from the southern Pyrenees (Fig. 1a), represent a good environment where the potential influence of lithology in the magnetic fabrics can be tested. In the studied zone, e-levels from Bouma (1962) sequences exhibit a penetrative slaty cleavage whereas a-d Bouma levels (in the studied zone c-d terms are the most developed) do not exhibit a clear cleavage at outcrop scale (Figs. 1b and c). e-level usually shows a sedimentary lamination parallel to bedding and a subvertical to steeply north-dipping tectonic cleavage. Sandstones show parallel and cross-bedded lamination with paleocurrent directions ranging from NNE-SSW to ENE-WSW. Sampling along the Jaca-Pamplona turbidite Trough records two lithological changes: (1) at regional scale there is a general decrease of the turbidite grain size from east to west (proximal to distal) within an overall upward-shallowing sequence; and (2) at outcrop scale, the lithology change between the different terms of the Bouma sequence.
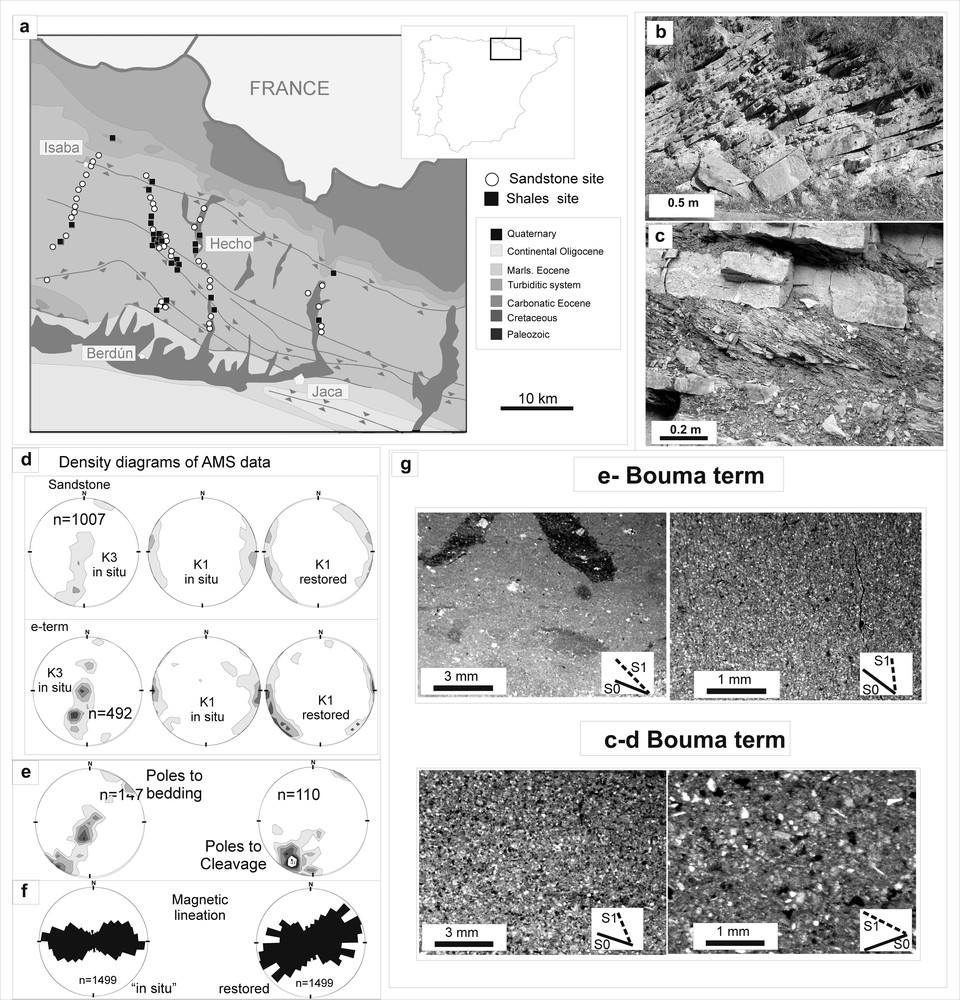
(a) Geological sketch of the studied zone with the sampling locations. The zone analyzed by mathematical interpolation models is marked with a box. (b, c) Outcrop photographs from Pyrenean turbidites at different scales. (d) Density stereoplot for poles of the magnetic foliation, magnetic lineation in situ and restored for sandstones and e-levels (density interval 2%): density diagrams for K1 in situ and restored for sandstones and e-levels. (e) Density stereoplot for poles of bedding and cleavage measured in the sampling sites, (f) Rose diagram for magnetic lineation in situ and restored to the horizontal (bedding correction) for all the obtained data from the Eocene turbidites, (g) Thin sections obtained for e- and c-d Bouma levels from the turbidites (S0- bedding and S1- cleavage have been represented on photographs).
(a) Schéma géologique de la zone étudiée, avec la localisation des sites d’échantillonnage. La zone analysée par interpolation mathématique est signalée par un rectangle. (b, c) Photographies d’affleurement des turbidites pyrénéennes à différentes échelles. (d) Stéréogrammes de densité des pôles de la foliation magnétique et de la linéation magnétique in situ et après correction de pendage obtenus dans les grès et dans le niveau e de la séquence de Bouma (intervalle entre courbes de densité 2 %). (e) Stéréogrammes de densité des pôles de la stratification et du clivage, mesurés sur les sites d’échantillonnage. (f) Diagrammes en rose des vents pour la linéation magnétique (in situ et après correction de pendage) pour toutes les données obtenues dans les turbidites éocènes. (g) Lames minces obtenues dans les niveaux e et c-d des séquences de Bouma (S0-stratification, et S1- clivage ont été représentés sur les photographies).
The studied zone is affected by folds and thrusts related to the Gavarnie and Larra thrust systems (Teixell, 1992) with folded thrusts in the northern sector and regional Pyrenean cleavage progressively decreasing in intensity from north to south (Choukroune, 1992). The penetrativity of cleavage is also dependent on the structural position (better developed in the anticlines located in the hanging wall of thrusts and higher penetrativity in zones with folds than intermediate sectors between important thrusts; Choukroune and Séguret, 1973; Labaume et al., 1985, Teixell, 1992).
The objective of this work is to determine the real meaning of the magnetic susceptibility obtained in different levels from Bouma sequence from the Jaca-Pamplona turbiditic basin, to analyze the applicability of AMS data to different rock types and to determine the main susceptibility carrier from both lithologies. In order to develop this comparison, samples were grouped according to the two lithological end-members: e-level (with usual strong cleavage development) vs. a-d interval (mainly c-d) in sandstone granulometry (where cleavage is usually rare). This grouping also satisfies the different apparent sensitivity of strain (cleavage) at outcrop scale. The sampling has been carried out in homogeneous outcrops (without significative changes of bedding and cleavage). In the same way, each site has been sampled in a homogeneous lithology (e-term or a-d term of Bouma sequence); in some cases doubled sampling at the same site has been done making subsites for each lithology.
The results obtained are discussed in the light of paramagnetic contribution to susceptibility in each lithology, and can be of application in AMS studies dealing with deformation in other tectonic settings.
2 Methodology
Anisotropy of magnetic susceptibility (AMS) is a technique of common use to determine the fabric of sedimentary and magmatic rocks (Martín-Hernández et al., 2004 and references therein). It gives the three axes of the magnetic susceptibility tensor together with the parameters of normalized susceptibility and shape and degree of anisotropy of the magnetic ellipsoid. The measurement of susceptibility at different applied fields can be used as an indicative of the paramagnetic contribution to the susceptibility. In this sense, paramagnetic susceptibility shows a constant relation with the applied field for usual measurement intervals while ferromagnetic susceptibility, depending upon the coercivity of magnetic particles, develops saturation at higher fields of their own coercivities. Analyzing the susceptibility at expected saturated ferromagnetic contributions, the measured susceptibility represents only the paramagnetic contribution to the susceptibility.
The comparison between susceptibility at low (similar conditions to kappabridge measurement) and high (over the ferromagnetic saturation) fields permits the analysis of the paramagnetic or ferromagnetic contribution to the susceptibility in the conditions of measurement of the AMS. The curve slope between applied and generated field represents the susceptibility and the analysis of slope changes along increasing fields permits the analysis of the magnetic behavior imprint to susceptibility, in slope change percentage (%paramag) or normalized to the sample mean susceptibility (paramagnetic or ferromagnetic equivalent susceptibility). The measurement of frequency dependent susceptibility can be used to analyze the contribution of superparamagnetic particles to susceptibility. A systematic measurement was carried out in at least one sample per site of the susceptibility at low and high fields (0 to 2.5 T) and at different frequencies (900 and 10 000 Hz). These measurements were carried out with a physical properties measurement system (PPMS; Quantum design; from the University of Zaragoza). The invariant susceptibility in the range from 0 to 2.5 T was used to calculate the paramagnetic contribution to susceptibility and the saturated susceptibility in this range was used to calculate the ferromagnetic contribution to susceptibility. These values can be used as percent change of susceptibility at different fields or as quantitative contribution to susceptibility normalized to the kappabridge values (paramagnetic or ferromagnetic equivalent contribution). For the different sample analysis at least a sample per site was chosen after the analysis of magnetic parameters at site scale (Km vs P′ and P′ vs T diagrams) with the objective to select a representative sample. The used magnetic parameters follows definition from Jelinek (1981): Km (mean susceptibility (K1 + K2 + K3)/3 where Ki are the principal normed susceptibilities), P′ corrected degree of anisotropy P′= exp{sqr[2((n1 – n)2 + (n2 – n)2 + (n3 – n)2)]} where ni are the natural logarithm from Ki) and T shape parameter (2n2 – n1 – n3)/(n1 – n3). Other magnetic parameters used in this analysis have been F the foliation parameter (k2/k3) and L magnetic lineation parameter (k1/k2).
In cases where more than one cluster of data in the preceding plots or high scattering exits more samples were taken for further analysis. The analysis of obtained data for the representative samples were used to test influence of other factors: position in the series, lithology, sedimentology or tectonic position within the Pyrenean orogen using their own obtained values of %paramag, %ferromag, equivalent paramag and ferromag contribution, χfr and kappabridge parameters (e.g. Km, P′ or T).
3 Results
3.1 Directional constraints
Orientation features show relatively constant trends for the magnetic lineation and foliation in the South-Pyrenean zone (Fig. 1). The poles to magnetic foliation in a-d and e Bouma levels (Fig. 1d) of the turbiditic sequence fit better with the poles to bedding than with the poles to cleavage, thus indicating that the sedimentary imprint in magnetic fabrics is stronger than the cleavage-related flattening. However, magnetic lineation (clustering of long axes of the magnetic susceptibility ellipsoid) shows better clustering in situ than after bedding restoring to the horizontal (bedding correction, Fig. 1f), consistently with an influence of cleavage in magnetic lineation. The detailed analysis of the magnetic fabrics throughout the western Central-Pyrenees has been carried out by Pueyo Anchuela et al. (2010). In this work, the general trend, independent from the rock type, shows a change from magnetic foliation parallel to bedding and magnetic lineation parallel to structures to magnetic foliation parallel to cleavage, and magnetic lineation parallel to bedding strike, intersection lineation and dip direction of cleavage. This model shows an inhomogeneous distribution linked to the inhomogeneous deformation along the studied section and the presence of ferromagnetic fabrics that exhibit a magnetic lineation normal to intersection lineation and i) horizontal with independence of bedding dip in southern positions and ii) contained within bedding in northern sectors. This kind of fabrics has been identified in other lithological units in the southern Pyrenees and has been interpreted as linked to shear parallel to thrust movement (e.g. Oliva-Urcia et al., 2009; Pueyo Anchuela et al., 2007).
3.2 Scalar parameters
The paramagnetic contribution to the susceptibility shows values between 3 and 92 (Fig. 2a), with intervals of 3–89 and 5–92 for shales and sandstones, respectively (mean distribution of 47 and 52%). The saturated and non-saturated susceptibility in the measurement interval can be analyzed with respect to the whole susceptibility of the sample, thus obtaining the expected paramagnetic and ferromagnetic equivalent susceptibilities (Figs. 2b,c). Both parameters (% paramagnetic and % ferromagnetic) show similar values for the two rock types. On the other hand, the comparison between the para- and ferromagnetic equivalent contributions and the mean susceptibility shows a direct relationship, more linear for the ferromagnetic equivalent susceptibility (Figs. 2b and c). In the case of the χfr (susceptibility fraction dependent on the measurement frequency, 900 and 10 000 Hz; e.g. Dunlop and Özdemir, 2001; Maher, 1986; Oldfield, 1994) there is not a clear relation between the mean susceptibility and the rock type (fig. 2d).
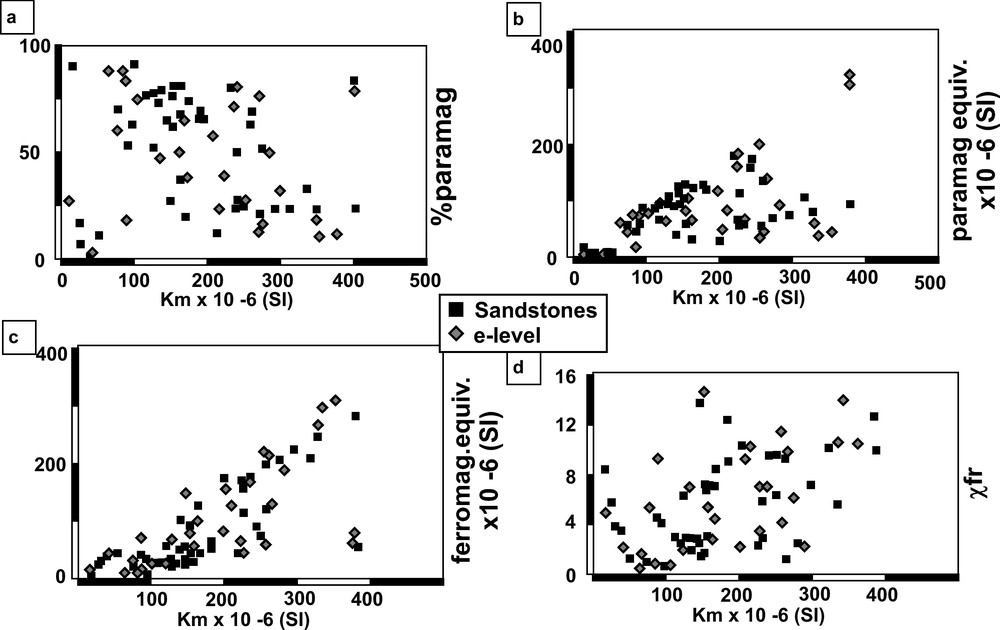
Diagrams for different magnetic measurements versus mean susceptibility (e-06 S.I.) (a) % paramag, b) equivalent paramagnetic susceptibility, c) equivalent ferromagnetic susceptibility, (d) fraction of susceptibility dependent of the measurement frequency. Shales and sandstones are represented by different symbols.
Diagrammes présentant des paramètres magnétiques en fonction de la susceptibilité moyenne (e-06 S.I.) (a) % paramagnétique, (b) susceptibilité paramagnétique équivalente, (c) susceptibilité ferromagnétique équivalente, (d) fraction de la susceptibilité dépendante de la fréquence. Argilites et grès sont représentés par des symboles différents.
3.3 Temporal and spatial distribution
Samples represent different stratigraphic and structural positions in the Eocene turbidite basin, being progressively younger from north to south and changing from the cleavage domain in the north to the apparently undeformed sector in the south. Results were plotted against the position within the stratigraphic series, considering megaturbidites as the reference levels (e.g. Barnolas and Teixell, 1994; Teixell, 1992; Fig. 3) and latitude (the general Pyrenean structure trends between N90 and N110, Fig. 4). The %paramag does not show a relation with the location of samples and is independent from the lithology (Figs. 3 and 4). The paramagnetic equivalent susceptibility shows a distribution similar for a to d and e Bouma levels throughout the studied zone and does not depend on the latitude (Fig. 4b). In the case of the ferromag equivalent susceptibility, a stronger scattering and higher values can be observed to the north (Fig. 4c). In this zone the ferromag equivalent susceptibility exhibits higher values and a strong variability, which is nearly followed by the frequency dependent susceptibility. The P′ vs. Km plot can be used as a test to detect the influence of particular ferromagnetic mineralogical phases that influence the AMS (Fig. 4f). This plot does not show a clear trend for e-level and a slight, non-linear relation with the mean susceptibility can be observed in sandstones, although the two rock types do not show clearly distinct behaviors (Fig. 4f). Similar features can be inferred from the T-P′ diagram (Fig. 4e), that can be used as qualitative indicative of the tectonic imprint in the magnetic fabrics (parameters definition from Jelinek, 1981). In this north to south section that is followed by a change in the deformation domain, from cleavage domains in the north to non-developed cleavage at outcrop scale in the south (inner to outer areas from the Pyrenean orogen), % paramag and equivalent paramagnetic susceptibility does not show any trend parallel to the change in the orogen position.

Diagrams of different magnetic properties versus position in the series (MT; megaturbidites) for mean susceptibility, % paramag, χfr, paramagnetic equivalent susceptibility and ferromagnetic equivalent susceptibility. Bouma e-level samples and sandstone samples are represented by different symbols.
Diagrammes présentant des paramètres magnétiques (% paramagnétique, χfr, susceptibilité paramagnétique équivalente et susceptibilité ferromagnétique équivalente) par rapport à la position de l’échantillon dans la série sédimentaire (MT : mégaturbidites), Les niveaux e de Bouma et les grès sont représentés par des symboles différents.

(a to d) Diagrams of magnetic properties versus latitude (representing varying structural positions within the Pyrenees) (a) for % paramag, (b) for paramagnetic equivalent susceptibility, (c) ferromagnetic equivalent susceptibility, (d) fraction of the susceptibility dependent on the measurement frequency. (e) Anisotropy AMS diagram for shape parameter (T) and corrected degree of anisotropy (P′). (f) Plot of corrected degree of anisotropy (P′) vs. mean susceptibility (e-06 SI). Bouma e-level samples and sandstones samples are represented by different symbols.
(a–d) Diagrammes présentant les propriétés magnétiques par rapport à la latitude (qui ici est liée à la position structurale à l’échelle de la chaîne pyrénéenne) (a) % paramagnétique, (b) susceptibilité paramagnétique équivalente (c) susceptibilité ferromagnétique équivalente (d) fraction de la susceptibilité dépendante de la fréquence. (e) Diagramme d’AMS pour le paramètre de forme (T) et le degré d’anisotropie corrigé (P′) par rapport à la susceptibilité moyenne (e-06 SI). Les niveaux e de Bouma et les grès sont représentés par des symboles différents.
3.4 Magnetic carriers
Bulk susceptibility shows for the different Bouma analyzed levels values between 20 and 385 × 10−6 (SI units) along the studied sections. Paramagnetic behavior in the analyzed samples can be ascribed to illite and chlorite, since these are the main paramagnetic minerals identified in the Eocene turbidites (Bauluz Lázaro et al., 2008).
Ferromagnetic particles are mainly related to magnetite and no significant high coercivity mineral phases are present in the studied rocks (Pueyo Anchuela et al., 2010). The comparison of the susceptibility at different fields (0, 1, 1.5, 2 and 2.5 T) shows similar ferromagnetic saturation at 1.5, 2.0 and 2.5 T. The paramagnetic equivalent susceptibility shows similar values for shales and sandstones (Fig. 2a). These results show that both the %paramag and the paramagnetic susceptibility are independent from the rock type in the Eocene turbidites. Since no wholesale growth of clay minerals can be assumed in the analyzed rocks (according to P-T conditions, Cantarelli et al., 2009; Holl and Anastasio, 1995), the paramagnetic equivalent contribution can be expected to be detrital rather than authigenic.
The % ferromag and the ferromagnetic equivalent susceptibility show a direct relationship with the mean susceptibility (Fig. 2). The increase in the mean susceptibility can then be explained by an increase in the ferromagnetic particles present in the rocks. At regional scale, the increase from south to north of the % paramag goes along with the increase in ferromagnetic equivalent susceptibility (Fig. 3). Values of χfr and the ferromagnetic equivalent susceptibility also follow a direct correlation. Superparamagnetic particles, in the case of magnetite are near the expected size of SD magnetites but are not able to retain a magnetization, showing a pure paramagnetic behavior under an applied field, directly dependent on the frequency of the susceptibility measurement (e.g. Dunlop and Özdemir, 2001). The log-normal distribution of ferromagnetic equivalent susceptibility versus χfr has been used as an indicative of diagenetic, non biogenic origin of magnetites (e.g. Kopp, 2007; Oldfield, 1994).
3.5 Sensitivity of Bouma units to magnetic fabric
Two different samples from e-level and sandstone level (c-unit) were chosen. Anisotropy of Magnetic Susceptibility (AMS), Anisotropy of Magnetic Susceptibility at Low Temperature (LTAMS), Anisotropy of Isothermal Remanent Magnetization (AIRM), Anisotropy of Gyroremanent magnetization, Anisotropy of Anhysteretic Remanence Magnetization and Anisotropy of Partial Anhysteretic Remanent Magnetization (for 10 different systematic intervals of coercivity, Jackson et al., 1988; Martín Hernández and Ferré, 2007; Parés and Van der Pluijm, 2002; Potter, 2004) were measured. AMS and AF demagnetizations were performed at the beginning of the subfabric analysis and after the whole routine with the objective to test the presence of potential changes in the AMS ellipsoid during the routine (Fig. 5).
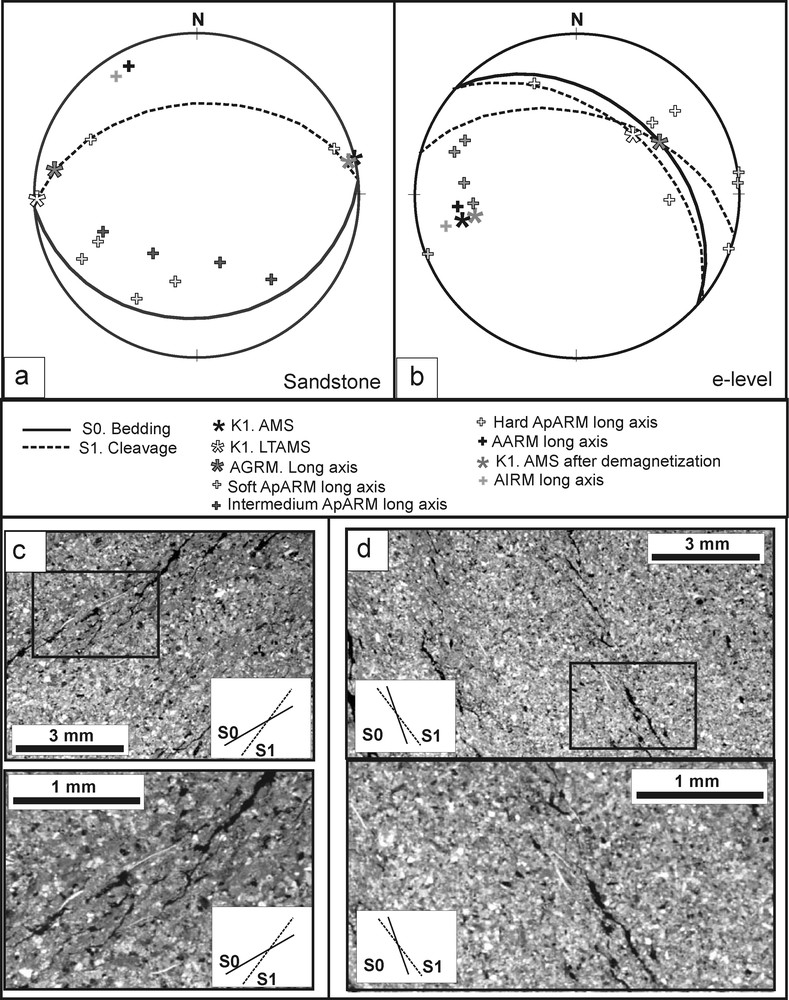
Samples selected from two sites (sandstones and e-level sites respectively), with detailed subfabric analysis, including AMS before and after subfabric analysis, AMS at low temperature (LTAMS), AGRM, AIRM and AARM for different coercivity intervals of 10 mT for the ApARM (Jackson et al., 1988), soft ApARM: interval from 0 to 40 mT, intermediate ApARM: interval from 40 to 80 mT and hard ApARM: interval from 80 to 100 mT. (a) Sandstones sample. (b) e-level sample. (c and d) Thin section photographs where phyllosilicates are mainly parallel to bedding (c) and parallel to bedding and cleavage (d).
Échantillons sélectionnés dans deux sites (grès et niveau e), pour lesquels on a fait une analyse détaillée de la sous-fabrique, incluant l’AMS avant et après l’analyse de la sous-fabrique, l’ASM de basse température (LTAMS), l’AGRM, l’AIRM et l’AARM pour différents niveaux de coercivité de 10 mT pour l’ApARM (Jackson et al., 1988), l’ApARM douce: niveau de 0 à 40 mT, l’ApARM intermédiaire: niveau de 40 à 80 mT et l’ApARM dure: niveau de 80 à 100 mT. (a) Échantillon de grès. (b) Échantillon de l’unité e. (c et d) photographies de lame mince, où on peut voir les phyllosilicates parallèles à la stratification (c) et parallèles à la stratification et au clivage (d).
The sandstone sample shows (Fig. 5a): (i) AMS magnetic lineation parallel to the intersection lineation, (ii) clustering of long axes of ApARM in a SSW direction with shallow plunge to the south (the softer ones are very close to bedding, and the intermediates show higher plunges) and hard ApARM appears related to the cleavage plane (the long axes of ApARM are contained within the cleavage plane), (iii) AARM and AIRM are not related to any macroscopic fabric at outcrop scale, (iv) AGRM shows results similar to hard APARM, being contained in cleavage and approaching to the intersection lineation.
The e-level sample (Fig. 5b) shows slight differences, but the identified clusters are similar. AGRM, hard APARM, LTAMS are close to the intersection lineation and magnetic foliation is parallel to the cleavage plane. The AMS show similar orientations to the AARM, AIRM and soft AARM, while the intermediate ApARM, as in the preceding case, shows an intermediate position between the soft APARM and the cleavage plane.
Both analyzed samples show fabrics related to cleavage for AGRM, hard ApARM and LTAMS. AARM, soft AARM and AIRM show similar results for both lithologies but cannot be clearly related to structures in the outcrop. Attending to the paramagnetic contribution to the susceptibility and the change of susceptibility with temperature (between liquid nitrogen and room temperature, LTAMS), the e- sample shows a %paramag of 24% and a factor of change of 1.5 × , and the sandstones sample 62% and a factor of change of 2.37 × . From the results obtained a stronger ferromagnetic control in fabric definition in e-sample than in sandstones can be inferred for the two analyzed samples. Thin sections show that clay minerals represent a low relative weight in the samples with independence of the field aspect of the studied levels, with bedding parallel and cleavage parallel orientation for the sandstone sample (Fig. 5 c and d).
4 Discussion and conclusions
The results obtained in this work indicate that e-level and sandstones from Bouma sequence show similar behaviors considering both orientation and scalar parameters of AMS, with independence of the exposure aspect and the cleavage development in the different analyzed levels. Paramagnetic contribution to the susceptibility shows similar values for the analyzed units. The paramagnetic equivalent susceptibility does not show particular differential patterns for sandstones and e-level samples. In the alpine Pyrenean evolution with low metamorphic development it is expected that paramagnetic particles (mainly clay minerals) are sedimentary in origin (detrital particles) more than authigenic origin. With independence of outcrop aspect of sandstones and shales and the differences in grain size and internal structure, similar values for paramagnetic equivalent susceptibility are present in both lithologies. This aspect suggests that similar quantities of clay minerals are present in both rock types with independence of the main grain size of the deposit.
With respect to temporal and spatial variations, recently, Pueyo Anchuela et al. (2010) presented a regional analysis of deformation of the Eocene turbidites of the Pamplona-Jaca basin by means of anisotropy of magnetic susceptibility (AMS) and other magnetic fabric techniques. The main conclusions of this work was the identification of a rough transition from bedding-related fabrics with magnetic lineation normal to the Pyrenean shortening (interpreted as the result of layer parallel shortening), to intersection lineation fabrics (magnetic lineation parallel to the intersection lineation), magnetic foliation parallel to cleavage and magnetic lineation parallel to dip direction of cleavage. This transition is consistent with the northward increase of deformation, with development of folds, thrusts and cleavage.
The magnetic parameters analyzed in this work (Figs. 3 and 4) do not depend on their position in the sedimentary sequence or their geographical location, and similar values are obtained throughout the sequence, with overlapping values for shales and sandstones.
From the results presented it can be inferred that in the Eocene turbidites of the South-Pyrenean basin the % paramag, that is commonly used as an indicator of the magnetic behavior in AMS studies, is not related to lithology. The general assumption that finer grain-size levels (e-level) can be more sensitive to strain is evident at outcrop scale, where penetrative cleavage is better developed in e-level with respect to sandstones. The comparison with other magnetic fabrics in these zones shows the coexistence of complex magnetic fabrics, with more paramagnetic fabrics (LTAMS, AGRM) linked to cleavage, intersection lineation or folding (Oliva-Urcia et al., 2009; Pueyo Anchuela, 2010).
The test applied to sandstones and shale samples indicates that paramagnetic particles (LTAMS or AMS with higher %paramag), small SD acicular magnetites or inclusions in the paramagnetic particles (AGRM-related, Potter 2004) and magnetite related to hard ApARM (Jackson et al., 1988) are more sensitive to cleavage, while ferromagnetic fabrics (AARM, soft AARM, AIRM and AMS with low %paramag) do not show clear relations with cleavage. This suggests that Bouma e-levels can even be less sensitive to the fabrics carried by paramagnetic particles. In the case of χfr and ferromagnetic equivalent to the susceptibility a clear pattern can be established according to the position of samples within the frame of the Pyrenean Chain. The increase from south to north and the higher scattering of both parameters can be tentatively related to the higher pressure and temperature conditions related with the emplacement of the Gavarnie unit allowing for widespread re-crystallization processes affecting in similar ways to both analyzed lithological groups.
The assumption that clay minerals are more sensitive to strain, as can be observed at outcrop scale, is also true in the case of magnetic fabrics: when samples show higher %paramag they show better developed cleavage AMS fabrics than in samples with more ferromagnetic fabrics or remanence fabrics from PSD and MD magnetite grain sizes. The results presented in this paper permit to state that the lithological and outcrop aspect cannot be used as the only criterion in planning the AMS field sampling. In this case different cleavage development does not have a direct correlation with the magnetic fabrics strain sensitivity whereas the presence of clay minerals, with independence of proportion of other grain-size particles, guarantees good results in AMS analysis in a cleavage domain.
Acknowledgements
This work has been supported by the project CGL-2006-05817, the Geotransfer Research Group from University of Zaragoza and a PhD Grant to the first author (FPU program). The authors want to thank the hospitality of Drs. Van der Voo, Van der Pluijm and Parés during the laboratory stay in the paleomagnetism laboratory at the University of Michigan. Authors want to thank the editor and anonymous reviewers for the improvement of the first version of the manuscript.