

 CC-BY 4.0
1. Introduction
1.1. PIREN-Seine creation and overall status
When the PIREN-Seine program was established in 1989 by Ghislain de Marsily, professor in hydrogeology at Sorbonne Université, to enhance the knowledge on water resources and on river quality, together with many actors of the basin, none of us would have thought that more than three decades later the program would be more active than ever. At the beginning of PIREN Seine, interdisciplinarity meant for scientists and stakeholders the study of hydrogeology, biogeochemistry and ecology at the scale of the Seine River and its basin, with caveats from managers to integrate other disciplines such e.g., as sociology, climate science … Water managers faced a painful stalemate with Prime Minister Rocard refusing to expand the gigantic wastewater treatment plant located downstream of Paris. They welcomed the PIREN-Seine as a scientific forum for reallocating investments for pollution reduction [Bouleau 2014]. Researchers and managers represented two separate communities, the former, academic, financially supporting the latter, technical. To this effect, G. de Marsily’s main action was to set up and lead a coordination committee to pool knowledge between the various academic and operational institutions and thus initiated a societal and applied research for river hydrographic network, which was developed by French CNRS as the river component of the Programme Interdisciplinaire de Recherche en Environnement (PIREN), such as the PIREN-Rhône [Amoros et al. 1987; Bravard et al. 1986].
Few years later, the program opened to agricultural and social sciences, developed new research themes and tools at the scale of the entire Seine basin, by initiating concepts such as the man-land-sea continuum and water agro-food system [Billen and Garnier 2021; Garnier et al. 2021], and developed a long-term approach to carry out a prospective analysis. The program, accredited by the CNRS (the French fundamental research institution), already at the scale of the whole basin, from headwaters to the coast, expanded its topics and temporal scope to (i) to diverse environmental issues as greenhouse gases (GHG), carbon budgets, climate change impact, agricultural practices, consumer habits, emerging contaminants and (ii) to a temporal window up to two hundred years. We did not expect that this project would generate its own community over time, gathering within the PIREN-Seine annual forum scientists from various disciplines with managers and engineers of a dozen key institutions and companies, which have supported the program since its beginning, and that it would generate hundreds of environmental specialists. Our syntheses in the late 1990s [Garnier and Mouchel 1999; Meybeck et al. 1998], in 2007 [Billen et al. 2007a] and in 2021 [Flipo et al. 2021a; Garnier et al. 2022] reflect this evolution.
1.2. PIREN-Seine, Earth system science and the Anthropocene
River basins are natural territorial scales to address sustainable water resources management and water governance [Pahl-Wostl et al. 2012]. They are also major components of Earth System science [Kabat et al. 2004], integrating lateral fluxes to oceans over the whole watershed. As such they can be used to quantify the changes occurring on the continental surface [Vörösmarty et al. 2004]. When, in 2000, Paul Crutzen coined the term Anthropocene era, to qualify the global change that was observed on the Earth System due to human activities in the industrial period, the river and coastal ocean scientific communities were one of the very first to use that new concept [Luciano 2022] and the Seine basin and its hydrosystem controlled by human activities was chosen to illustrate it [Meybeck 2002, 2003; Meybeck and Vörösmarty 2005; Vörösmarty and Meybeck 2004].
1.3. Evolution of the PIREN-Seine vision, from a hydrosystem to a socio-hydrosystem
As early as 1989, we considered the Seine River basin as an hydrosystem, i.e. a well-bounded spatial entity, linking streams, river network, aquifers and reservoirs to the estuary, on which water balance and budgets of riverborne materials could be measured and modelled taking into account the inputs to surface water. We then gradually integrated how much it was impacted by multiple and interacting social and economic activities (17 million people, 76,000 km2), and regulated in many ways, generally by dedicated institutions, some of them established more than one hundred years ago. We also found that our analysis of present conditions had to consider the basin history over the “longue durée” (the long term, >100 y) [Billen et al. 2007b; Le Noé et al. 2018; Lestel and Carré 2017]. Finally, we pointed out that this system was no longer a closed one, as in the classical hydrological approach, and that external inputs and exchanges (water, materials, information, technology, norms, aquatic species, etc.), with other territories had to be considered [e.g., Barles 2010; Belliard et al. 2018; Billen et al. 2012; Bouleau et al. 2017; Meybeck and Lestel 2017]. We thus have considered the technical, economic, and cultural components of the basin, along with the water-dedicated institutions, water users, operating rules, power relations, water laws, norms and regulations [Bouleau and Pont 2015; Bouleau et al. 2009, 2017; Carré et al. 2017, 2018]. Each of these subsystems operates on specific time and space scales, and are all interacting between them, as a coevolutionary coupled human-nature system [Savenije et al. 2014; Sivapalan et al. 2012; Werther et al. 2021; Wesselink et al. 2017].
1.4. The Seine River basin is well suited for such a socio-hydrosystem analysis
Too few river systems have shown rich information on their evolution over the longue durée, particularly for river management, water chemistry and water quality. The Seine, a medium-size basin, is one of those, together with emblematic rivers, first studied for river water resources management as the Tennessee River [Knop 1976], then for river ecology and restoration, e.g. the Rhône River [Amoros and Petts 1993], the Rhine River [Wantzen et al. 2022], the Mersey River [Burton et al. 2003] or the Chesapeake basin [Cooper and Brush 1991]. The PIREN-Seine has allowed a lot of data to be unearthed and analyzed, providing an exceptional set of quantitative data and qualitative descriptions, started 150 years ago by Belgrand [1872] and the Montsouris observatory (1876–1937) [Meybeck et al. 2017], completed by the Seine River authority engineers [MDBSN and AFBSN, 1976], then by the PIREN-Seine: historical population census, accurate and high-resolution archival maps, pioneer chemical analysis, historical records of fish assemblage, river engineers reports, agricultural census, hydrological monitoring, followed then by biogeochemical surveys in the 1970’s, etc. [Belliard et al. 2018; Carré et al. 2021; Flipo et al. 2021a; Romero et al. 2016, and references herein].
The program took up a major challenge: to understand major pressures and their interactions with the components of the hydrosystem of this river, and endeavoured to share between researchers and operational staff a common knowledge to act on human practices (domestic, industrial, agricultural ones) in order to improve the quality of the water and the environment. We are presenting in this paper a selection of the Seine River basin socio-hydrosystem analysis and propose a perspective of its evolution in the 21st century: (i) a nested spatial analysis of the Seine hydrosystem, (ii) the PIREN-Seine modelling approach for water and material transfers, (iii) the trajectories of some major water quality issues of the Lower Seine over the longue durée.
2. The Seine hydrosystem from headwaters to the coast, under multiple constraints and controls
One of the main characteristics of the Seine River is its degree of “artificialization” and human control over it. Paris megacity, now administratively termed Metropole du Grand Paris, is central to the Seine Basin and dominates the whole socio-hydrosystem, estuary included [Lestel et al. 2022]. Paris’ administrative area has increased in the last two hundred years, from 75 km2 in 1800 to 17,175 km2 in 2010, of which 2850 km2 is urbanized (Figure 1C).
The nested spatial vision of the Seine socio-hydrosystem. (A) Plot scale hydrological and biochemical processes. UZ: unsaturated zone; SZ: saturated zone. (B) Low-order streams (I to 3) draining forest and cropland. (C) River basin, major tributaries and their regulation reservoirs, specific estuarine basin and extension of Paris metropolis from 1876 to 2000. (D) Seine-Normandie water management authority (AESN), France, European Union and Atlantic coast. S1 to S7: schematic position of river observing stations. WS: river water supply for Paris; WWTP: treated urban sewage released to the Seine River. BFP: Bassée floodplain. In green: navigated river network regulated by locks.
Hundreds of sand-pits have been excavated after 1950 to supply this Parisian construction and its radial infrastructure, as far as in the Bassée, once a natural floodplain of 320 km2 some 100–150 km upstream of Paris (BFP, Figure 1). Paris growth has also generated a well-developed agricultural hinterland. The influence of Paris is maximum on the Lower Seine, downstream of Paris (fluvial transport, locks and dredged channel), but it also extends to upstream parts of the hydrosystem, on the Upper Seine and its Yonne and Marne tributaries, through the control of water levels by dam reservoirs (Figure 1). These structures have generated permanent alterations of the original river course, islands, riparian forests and floodplains [Lestel et al. 2021, 2022].
Few essential key players are in charge of managing river hydrology, water quality and aquatic biodiversity. Some are historical institutions; others were created after the 1964 Water Law. In the following list, PIREN-Seine historical partners are indicated with an asterisk (*).
- The Seine-Normandie basin institution (AESN*, established by the 1964 water law) for its pollution control missions raises water taxes to fund the wastewater treatment plants (WWTPs) and is in charge of the river quality monitoring and assessments since 1971 [MDBSN-AFBSN 1976]. AESN has been and remains the main funder of the program since 1989.
- The Seine reservoirs institution (Seine Grands Lacs*) was created in 1969 to regulate the discharge of the river within Paris region, through a set of reservoirs totaling 99 km2 and 800 Mm3, built between the 1949 and 1990, some 300 km upstream of Paris (Figure 1C), thus reducing the flood stage in the Paris region and sustaining summer low flows by the release of additional water up to 75 m3⋅s−1, to maintain a sufficient quality for water intakes and drinking water production.
- The urban sanitation syndicate [SIAAP*, created in 1971, Rocher and Azimi 2017], a public entity, gathers the majority of the waste waters of Paris megacity through a gigantic network of sewers (440 km). The initial sewer network, conceived in 1860 within historical Paris, combined both domestic/industrial wastes and storm runoff, but two separate suburban networks were constructed then, mostly after 1950. The total discharge of treated water released in the Central Parisian Seine sector is 30 m3⋅s−1, i.e., equivalent to the lowest natural summer flow, showing the indirect control of this institution on the chemical water quality of Central Seine and Lower Seine.
- The institutions of fluvial navigation and harbors (VNF* and HAROPA) control the water levels and velocity of the Lower Seine and parts of the Upper Seine, Marne and Oise tributaries (Figure 1C). Since the end of the 19th century, almost the entire course of the Seine River has been channelized and 400 km long network, totaling 20 million tons of freight per year, operating through 29 weirs and locks in which the natural low flows depth has been gradually increased by dredging (1.6 then 2 m in the 1860s, 3.2 m in the 1880s, 4.5 m in the 1930s for the Seine River between Rouen and Paris). The Seine navigated waterways are connected through canals with the Loire River (in 1632), the Rhône River (1832) and the Scheldt River in Belgium (1939), which has favored the invasion of aquatic species [Belliard et al. 2018].
- Two public water supply organizations, the SEDIF* (142 suburban municipalities totaling 4 M people) and Eau de Paris (Paris and some other municipalities, totaling 3 M people), divert some 19 m3⋅s−1 from the Upper Seine, Marne and Oise rivers and from aquifers; Eau de Paris also controls a 1700 km network of pipes for cleaning streets, sewers and watering parks.
Today, the Seine River is set to remain a highly modified river, regulated to provide the economical functionalities expected. With the help of their exchanges with their partners, the researchers have gradually acquired a better understanding of the visible and invisible forms of degradation of water quality and aquatic environments due to anthropization. This has been made possible by the improvement of measurements, long term monitoring and the development of models.
3. The river basin metabolism, its representation and modelling
Modelling has been central to the construction of a shared understanding of the river basin system, between managers and researchers, and among researchers themselves. In the last three decades, numerical dynamic models were developed, taking into account various resolutions and major pressures, including point and non-point pollution, which were initially poorly monitored.
3.1. The PIREN-Seine spatial observation strategy
The program has combined multiple and nested spatial field observations (Figure 1A to 1D), which integrate the hydrological network (from Strahler stream orders 1 to 7), land cover, land use and agricultural practices, human pressure in chosen river sectors (Figure 2): (i) the hydrological and biogeochemical processes and cycles (Figure 2, C1–C6) are studied at the scale of major land use types (croplands, grassland, and forest), integrating at specific representative study sites and their exchanges with the root zone, unsaturated zone and aquifers, (ii) the background levels of nutrients and heavy metals are measured on forested headwaters, stream orders 1 and 2 (Figure 1, S1, S2), with minimal population density (<5 people/km2), (iii) from stream orders 1 to 7, i.e., up to the basin outlet station of Poses (250 people/km2), the transfer of water and biogeochemical elements are determined at stations representative of each stream order, in small watershed and along longitudinal profiles in major river axis, schematically positioned at S1–S6; (iv) the general water quality degradation by human activities is studied by documenting point and diffuse sources on the stream order set, particularly on the Seine River upstream and downstream of the Paris megacity (S4 and S5); (v) some peri-urban (Grand-Morin River) and urban rivers (Bièvre, Orge), where population density reaches 1000 people/km2, are also considered. These observations are then processed to determine the temporal and spatial distribution of hydrological and biogeochemical fluxes in terms of in/-out budgets, material flux metabolisms, and modelling.
Schematic conception of the Seine basin for whole basin modeling, river network budgeting by stream orders, simulation of river water quality and ecological functions. The analysis of territorial metabolism of the basin socio-hydrosystem includes all components (A) to (D): (A) low impacted headwaters, (B) intensive agricultural cropland, (C) river network and its transfers, (E) urban territory, mainly Paris megacity, (D) specific estuarine section. UZ, SZ: unsaturated and saturated zones. S1 to S7, position of main budgeting stations in the land-ocean continuum (see also Figure 1). Sus and Sws, observing stations for urban sewage release and river water supply. UI and UO, urban input and output. (*: position of territorial metabolism quantification). FS, AS and US: calculated forest, agricultural soils storage and urban storage. C1 and C2, soil-plant hydrological and biogeochemical cycles; C3 to C6, biogeochemical cycles in aquatic system (cycles in river reservoirs are not shown). Cus, biogeochemical cycle in wastewater treatment plant.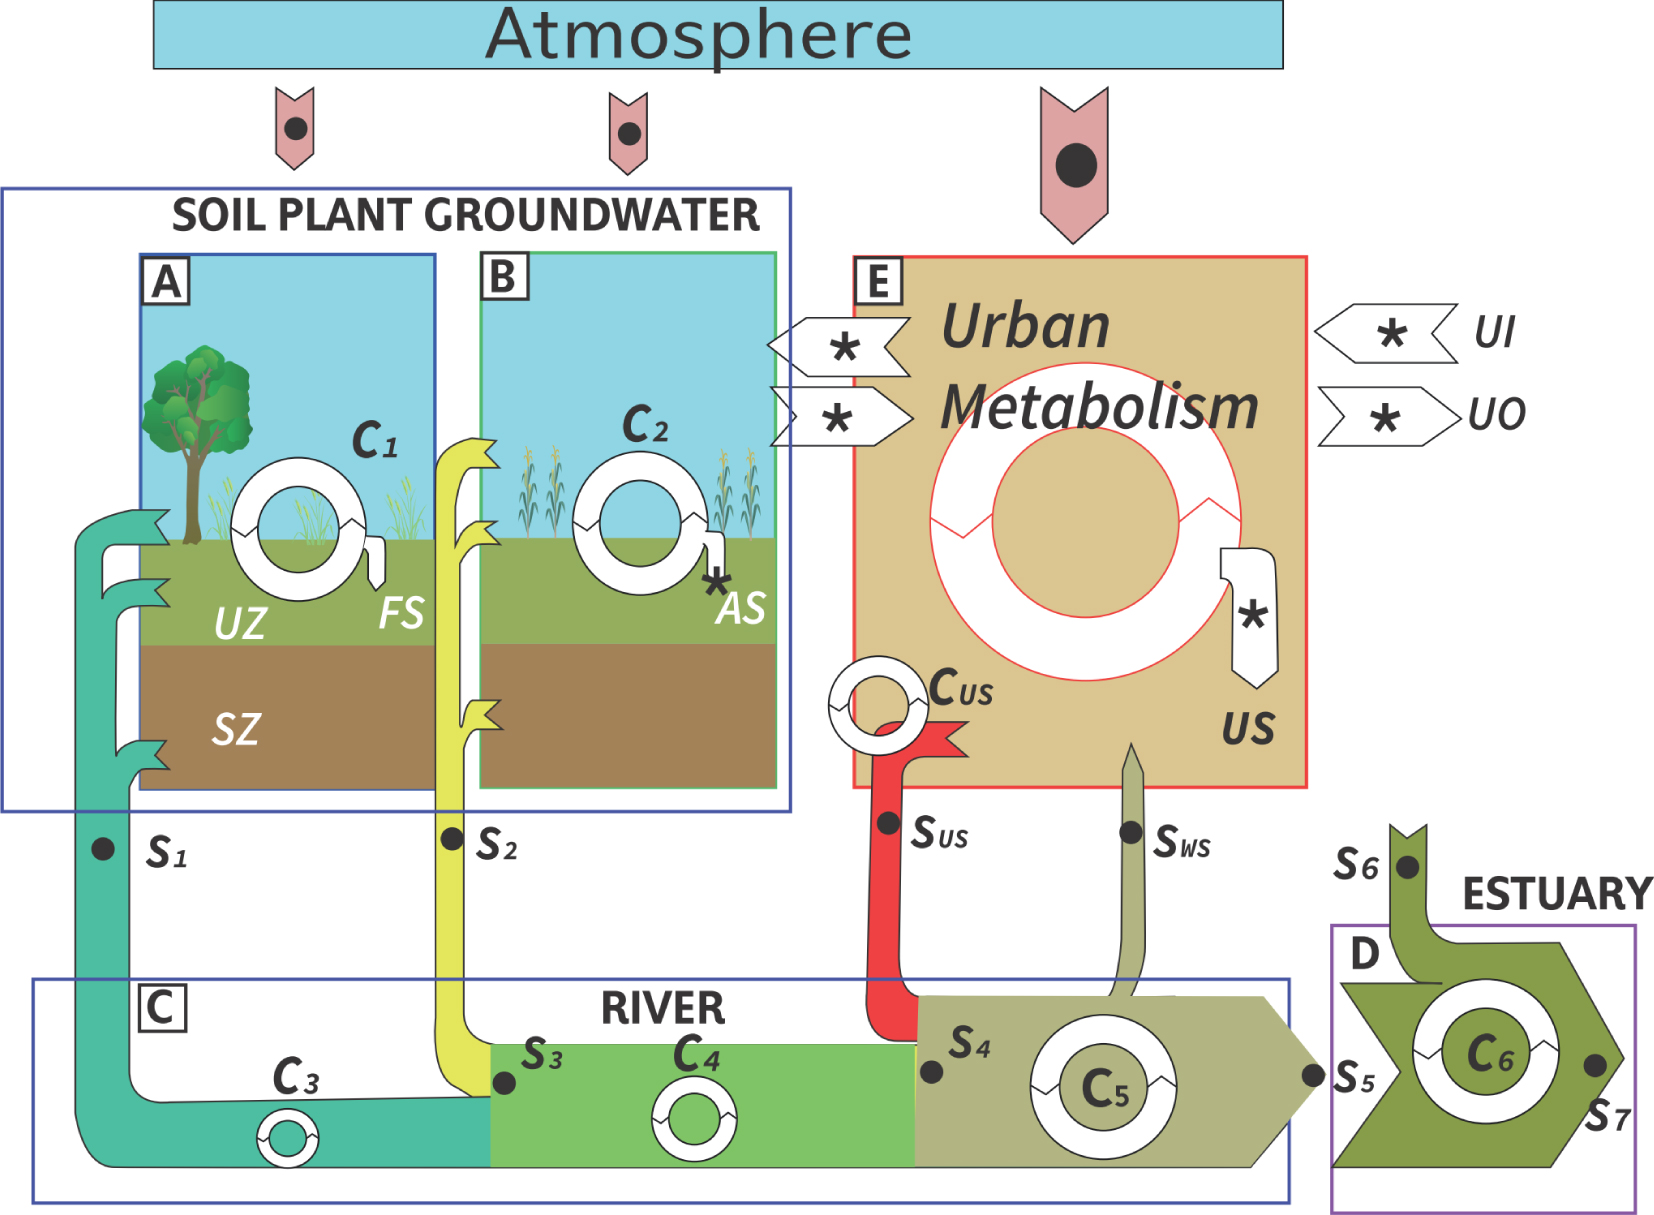
3.2. The river basin models
The Seine basin modelling has been a continuous and central activity of the PIREN-Seine since its beginning. Models encapsulate a large part of the generated knowledge, help checking the coherence of the results, and simulate multiple functions of the hydrosystem and basic variables of its water quality.
PROSE [Even et al. 1998, 2007a, b] simulates Seine River hydrodynamics in 2D at a fine scale every 15 mn and 500 m. The whole-basin hydro-biogeochemical model RIVERSTRAHLER allows the calculation of flows and water quality variables at any point of the river network with a spatial resolution of 1 km [Billen et al. 1994]. The hydrogeological model CAWAQS, spatially distributed into elementary units, 11 km2 on average [Baratelli et al. 2018; Flipo et al. 2007, 2021b], has been gradually developed, coupled with STICS, a water-plant agronomical model [Ledoux et al. 2007]. These models have been linked to simulate the future evolution of the hydrosystem in response to climate change scenarios and/or to socio-economic changes [e.g. consumption habits, organic agriculture, new river hydrostructures, Passy et al. 2018]. The biogeochemical RIVE model (https://www.federation-fire.cnrs.fr/rive/) is common to surface water models (PROSE, RIVERSTRAHLER). Diffuse sources, such as groundwater nitrogen contamination, are determined from STICS and/or GRAFS (an accounting model for soil organic C, N and P balance), at the department (NUTS3) or region (NUTS2) scales, depending on available agricultural census data [Billen et al. 2014]. The estuarine river basin has a dedicated model linked to the coastal zone [ECOMARS-3D: Romero et al. 2019; Garnier et al. 2019].
These water-quality models are used by several partners of the PIREN-Seine. The basin authority (AESN) is using them to complement its regulatory monitoring when reporting for the European Water Framework Directive [EU-WFD, 2000], to assess the good ecological state of unmonitored water bodies [Passy et al. 2018; Carré et al. 2017]. The sewage treatment institution (SIAAP) is using PROSE (including RIVE), which can be considered as a decision support system. It has been used to simulate the water quality of the Lower Seine at high frequency [Vilmin et al. 2018], instead of the monthly regulatory monitoring recommended by the EU-WFD, and to test the impacts of the new SIAAP facilities for phosphorus and nitrogen treatments. It is also used to simulate the impacts of combined sewer overflows during storm events, a critical point for determining when and where future temporary sites, considered for bathing and water sports in the Seine River within Paris, will have to be closed.
These models have also been used to simulate the past water quality in the absence of monitoring before the start of regulatory survey in the early 1970s, etc. [e.g., Billen et al. 2007b] or possible scenarios for the future of the socio-hydrosystem, taking into account different climatic, demographic, agricultural, consumerism scenarios and their combinations [Ducharne et al. 2007; Garnier et al. 2019].
Models have also generated indicators of ecological functioning and status of the land–sea aquatic continuum: (i) the Production/Respiration ratio (P/R) [Billen and Garnier 2007], (ii) the Indicator of Coastal Eutrophication Potential (ICEP), now included as a Sustainable Development Goal indicator [Billen and Garnier 2007; Garnier et al. 2021], and tested at the global scale [Garnier et al. 2010; Howarth et al. 2011].
3.3. The territorial metabolism of the Seine socio-hydrosystem
Earth System scientists seek a deeper understanding of the physical, chemical, biological and human interactions that determine the past, current and future states of the Earth. The Earth System has indeed changed or been regulated by human activities, particularly since the beginning of the industrial era and across the land-to-ocean continuum. The Seine River basin, in which natural fluxes are low, offers an excellent opportunity to quantify these changes (Table 1).
Indicators of impact of the Seine basin anthroposphere on the receiving river for particulate metals, nitrate and phosphate
| Cd | Hg | Pb | Zn | N () | P () | |
|---|---|---|---|---|---|---|
| (A) Pre-industrial references | μg⋅g−1 | μg⋅g−1 | μg⋅g−1 | μg⋅g−1 | mg⋅L−1 | mg⋅L−1 |
| Seine River natural background (1) | 0.22 | 0.03 | 20 | 60 | 0.2 | 0.004 |
| Seine River regulatory reference (2) | 1.2 | 0.5–1 | 20–50 | 100–200 | 5.3 | 0.11 |
| (B) French norms before EU WFD | μg⋅g−1 | μg⋅g−1 | μg⋅g−1 | μg⋅g−1 | mg⋅L−1 | mg⋅L−1 |
| Dredged sediments (1990s) (3) | 2 | 1 | 100 | 300 | ||
| WWTP sludge reuse (1986) (4) | 26 | 16 | 750 | 2500 | ||
| Water quality (green-yellow threshold) (5) | 0.5 | 0.03 | ||||
| (C) Maximum contamination level | μg⋅g−1 | μg⋅g−1 | μg⋅g−1 | μg⋅g−1 | mg⋅L−1 | mg⋅L−1 |
| Seine R. (downstream Paris) (date) | 35 (1960) | 26 (1973) | 558 (1945) | 1317 (1967) | 6.36 (2006) | 1.14 (1976) |
| (D) Maximum enrichment factor EF | ||||||
| Seine R. (downstream Paris) | 160 | 1000 | 29 | 22 | 32 | 285 |
| (E) Per capita excess fluxes | g⋅cap−1⋅y−1 | g⋅cap−1⋅y−1 | g⋅cap−1⋅y−1 | g⋅cap−1⋅y−1 | kg⋅cap−1⋅y−1 | kg⋅cap−1⋅y−1 |
| Seine R. maximum (1955–60 for metals; 1990 for N and P) | 3.4 | 0.6 | 50 | 160 | 5.9 | 1.08 |
| Seine R. 2000 | 0.07 | 0.06 | 5 | 21 | 4.8 | 0.09 |
| (F) Leakage ratio (percent) | ||||||
| Seine R. 1960s | 11.6% | ND | 0.94% | 1.9% | 25% | 5% |
| Seine R. 2000s | 0.4% | ∼10% | 0.08% | 0.25% | 25% | − 22% |
Per capita excess loads (g⋅cap−1⋅y−1), leakage rates (%), enrichment factors (dimensionless, EF > 1.0). (1) historical sediments 4000 BP and forested streams (PIREN-Seine); (2) “natural levels”, AESN, 1979; (3) criteria for safe dredged material reuse (VNF-1); (4) criteria for safe WWTP sludge re-use in 1986; (5) green/yellow limit, SEQ-Eau [Oudin and Maupas 2003]. From Lestel and Carré [2017], Meybeck [2013], Meybeck and Lestel [2017], Meybeck et al. [2007]. Basin population in 1955: 10.5 M people, 1990: 14.5 M people.
The river basin scale is particularly well-suited to study nutrients and carbon metabolism, their circulation in the anthroposphere as food, organic wastes, chemical fertilizers, N- and P-containing products (detergents), and the effect of the agricultural revolution. During 1950s, after World War II, in France and many other countries, the agricultural sector made a technical revolution by the conversion of pasture to cropland and the systematic use of agrochemicals [Le Noé et al. 2018]. This intensification of agriculture, which generated diffuse excess nitrogen fertilizer and pesticides to the Seine basin streams, has been particularly studied by the PIREN-Seine since 1990 Billen et al. [2020], Blanchoud et al. [2021]. Other metabolism studies have been established for heavy metals [Meybeck et al. 2007; Thévenot et al. 2007], for PAHs, drug residues and emerging pollutants [Gateuille et al. 2021; Labadie et al. 2021; Tamtam et al. 2008], for specific micropollutants as PCBs, PAHs, phthalates, PBDE, pesticides, microplastics, in rural, and peri-urban areas [Blanchoud et al. 2013, 2021; Dris et al. 2015; Gateuille et al. 2014; Teil et al. 2014]. These studies show the extent to which the material is imported, transported, transformed, recycled, and exported within the anthroposphere.
Other metabolism studies have been established at the infra-basin scale, for the Paris megacity [Billen et al. 2009; Esculier et al. 2019; Lestel 2012], and at the supra-basin scale, for the whole country, and eventually for Europe [Billen et al. 2021] (Figure 1D).
The circulation of materials (e.g., N, P, metals, potassium) within the Seine socio-hydrosystem is much greater than the natural fluxes (generated by leaching/erosion, weathering, N-fixation, primary production in non-agricultural land, etc.) which are, in the Seine, generated by medium runoff (10 L⋅s−1⋅km−2) and very-low sediment transport (10 t⋅km−2⋅y−1), i.e., a factor from 10 to 100 times for some elements (metals, nutrients). Specifically, the “longue durée” budget of phosphorus in agricultural soils has shown a bell-shape behavior with a long storage, very rarely quantified, due to over fertilization by chemical P fertilizers (1950–1990), followed by de-storage, while the P balance still remains positive [Billen et al. 2020; Garnier et al. 2015]. Also, the circulation of metals and metal-containing products is completely different from the erosion and weathering processes which generate their natural river fluxes [Meybeck et al. 2007; Thévenot et al. 2007].
The determination of natural references is a key point: (i) they are the starting point of the calculation of the enrichment factor EF (EF = Cobserved∕Cnatural), as defined by geochemists [Meybeck et al. 2007], (ii) they are used in water quality management, to differentiate the “very good” quality, without any impacts (blue color coded in the WFD) from the “good” quality (green coded) in which impacts are considered as negligible. Reference levels have been established by the PIREN-Seine from pre-industrial alluvial sediments or in low order forested streams (Figures 1B and 2A). They can be very different from the regulatory figures. At one stage of the water quality management, the blue level of the national scale for metals (SEQ-Eau) [Oudin and Maupas 2003] was simply considered as 1/10 of the green–yellow regulatory limit, often much below the observed pre-industrial values. Examples of French norms (SEQ-Eau and others) before the EU WFD are presented in Table 1. Water quality norms may greatly evolve with time as they result from scientific knowledge, environmental awareness, analytical facilities, policy objectives and lobbying [Bouleau et al. 2017; Meybeck et al. 2018] as for the nitrate pollution [Carré et al. 2018]. After 2006 the French norms were replaced by those of the EU-WFD. Moreover, the regulatory criteria to qualify the dredged sediments and the recycling of treated sewage sludges on cropland have greatly evolved in the past 40 years [Meybeck et al. 2007].
The leakage rate LR is a dimensionless indicator which can be used for intercomparison between riverborne materials and/or between rivers [Meybeck 2013]. First, excess loads (t per year) generated by the socio-hydrosystem are determined as the difference between observed fluxes and the pre-industrial reference flux at the system outlet (S5, Figure 1). Then, excess loads are compared to the inputs to the basin (Figure 2, INagr and INurb) to determine the leakage rate (LR) of the material. LR reflects the efficiency of the socio-hydrosystem with regard to the fluvial environment: for heavy metals, it was between 1 and 10% after World War II, and has now decreased by an order of magnitude, except for mercury, which is still around 10% [Meybeck et al. 2007].
The per capita excess load is the excess load relative to the population of the socio-hydrosystem at a given period. It is very low or cannot be measured in river basins where the population lives in full equilibrium with its resources. The early river budgets of major ions [Meybeck 1979] have found that per capita excess fluxes of Cl−, , Na+, K+ were actually proportional to their energy consumption, an indicator of their industrial development. The study of the evolution of this indicator in the Seine basin for metals and for phosphorus adds a new dimension: for these elements, in post-industrial stage and under higher environmental constraints, the per capita excess load can be decreased without negatively affecting economic development.
Per capita excess load and leakage rate are specific for the socio-hydrosystem at a given stage of its development and environmental concern. If they can be linked to available socio-economic data (e.g., energy consumption, agricultural production), they can be used to make first-order estimates of human impacts from regional scales to global scale for poorly monitored riverborne materials.
4. Longue durée trajectories of indicators of the state of the Lower Seine quality
Patterns of impacts change over long periods. For most water quality degradations, identifying these impacts, understanding their causes and mitigating the pollution or impact take more than twenty years, often much more and some impacts are yet to happen. In the Seine basin, the longue durée river state has been reconstructed over more than 150 years for many issues [Meybeck et al. 2018]. This is first based on historical archives, maps, fish observations, and water chemistry records generated by the Montsouris observatory, then by other institutions. They allow assessment of the evolution of river course morphology [Lestel et al. 2021], hydrological (river flow) and hydraulic (water level and velocity) regimes, fish assemblage [Belliard et al. 2018], concentrations of major ions, nutrients, dissolved oxygen [Cun et al. 1997; Meybeck and Lestel 2017], and fecal coliforms [Mouchelet al. 2021]. A second set is generated by biogeochemical models applied to past basin conditions, as for eutrophication [Billen et al. 2007b]. The third set has been generated by the chemical analyses of alluvial cores (sediment archives) after 2006 [Ayrault et al. 2021; Meybeck et al. 2007], which allowed reconstruction of the past contamination trends (from 1920 or 1950 to 2006) for dozens of micropollutants, metallic and organic, which had either not been monitored or insufficiently monitored before 2006.
These state indicator series have then been transformed into quality levels which refer to a single metric, based on a reference water quality (WQ) scale. For the Seine basin, we have chosen those developed by the EU-WFD [Meybeck et al. 2018]. The water quality level (from very good to very poor) allows the intercomparison of issue severity through time in graphical representations (Figure 3). They do not represent how the issue was perceived or declared by the society in the past (actually not documented for most of the time) but correspond to our present analysis of the river environmental trajectory, based on our current scientific knowledge and a unique set of criteria.
Longue durée patterns of selected river quality issues in the Lower Seine (at station S5). Relevant dissolved and particulate concentrations observed in the river are converted into issue severity levels according to 2006 scales. Upper graph: classical water quality issues. Lower graph: toxic micropollutants and emerging issues (Fl: flumequine antibiotics). Upper temporal horizontal lines bars: pioneer and historical analyses, reconstruction from sedimentary archives and from models (PIREN-Seine), regulatory analyses performed by AESN, analyses generated by PIREN-Seine. Key dates of water quality construction: 1933, first wastewater treatment plant (WWTP) of Paris sewage, 1964: Water Law, 1971: National Pollution Inventory, 1992: Aquatic systems Law, 2000: EU water framework directive (WFD), 2006: LEMA law (Loi sur l’eau et les milieux aquatiques), 2013: end of implementation of nitrogen treatment at Paris WWTP (Seine-Aval).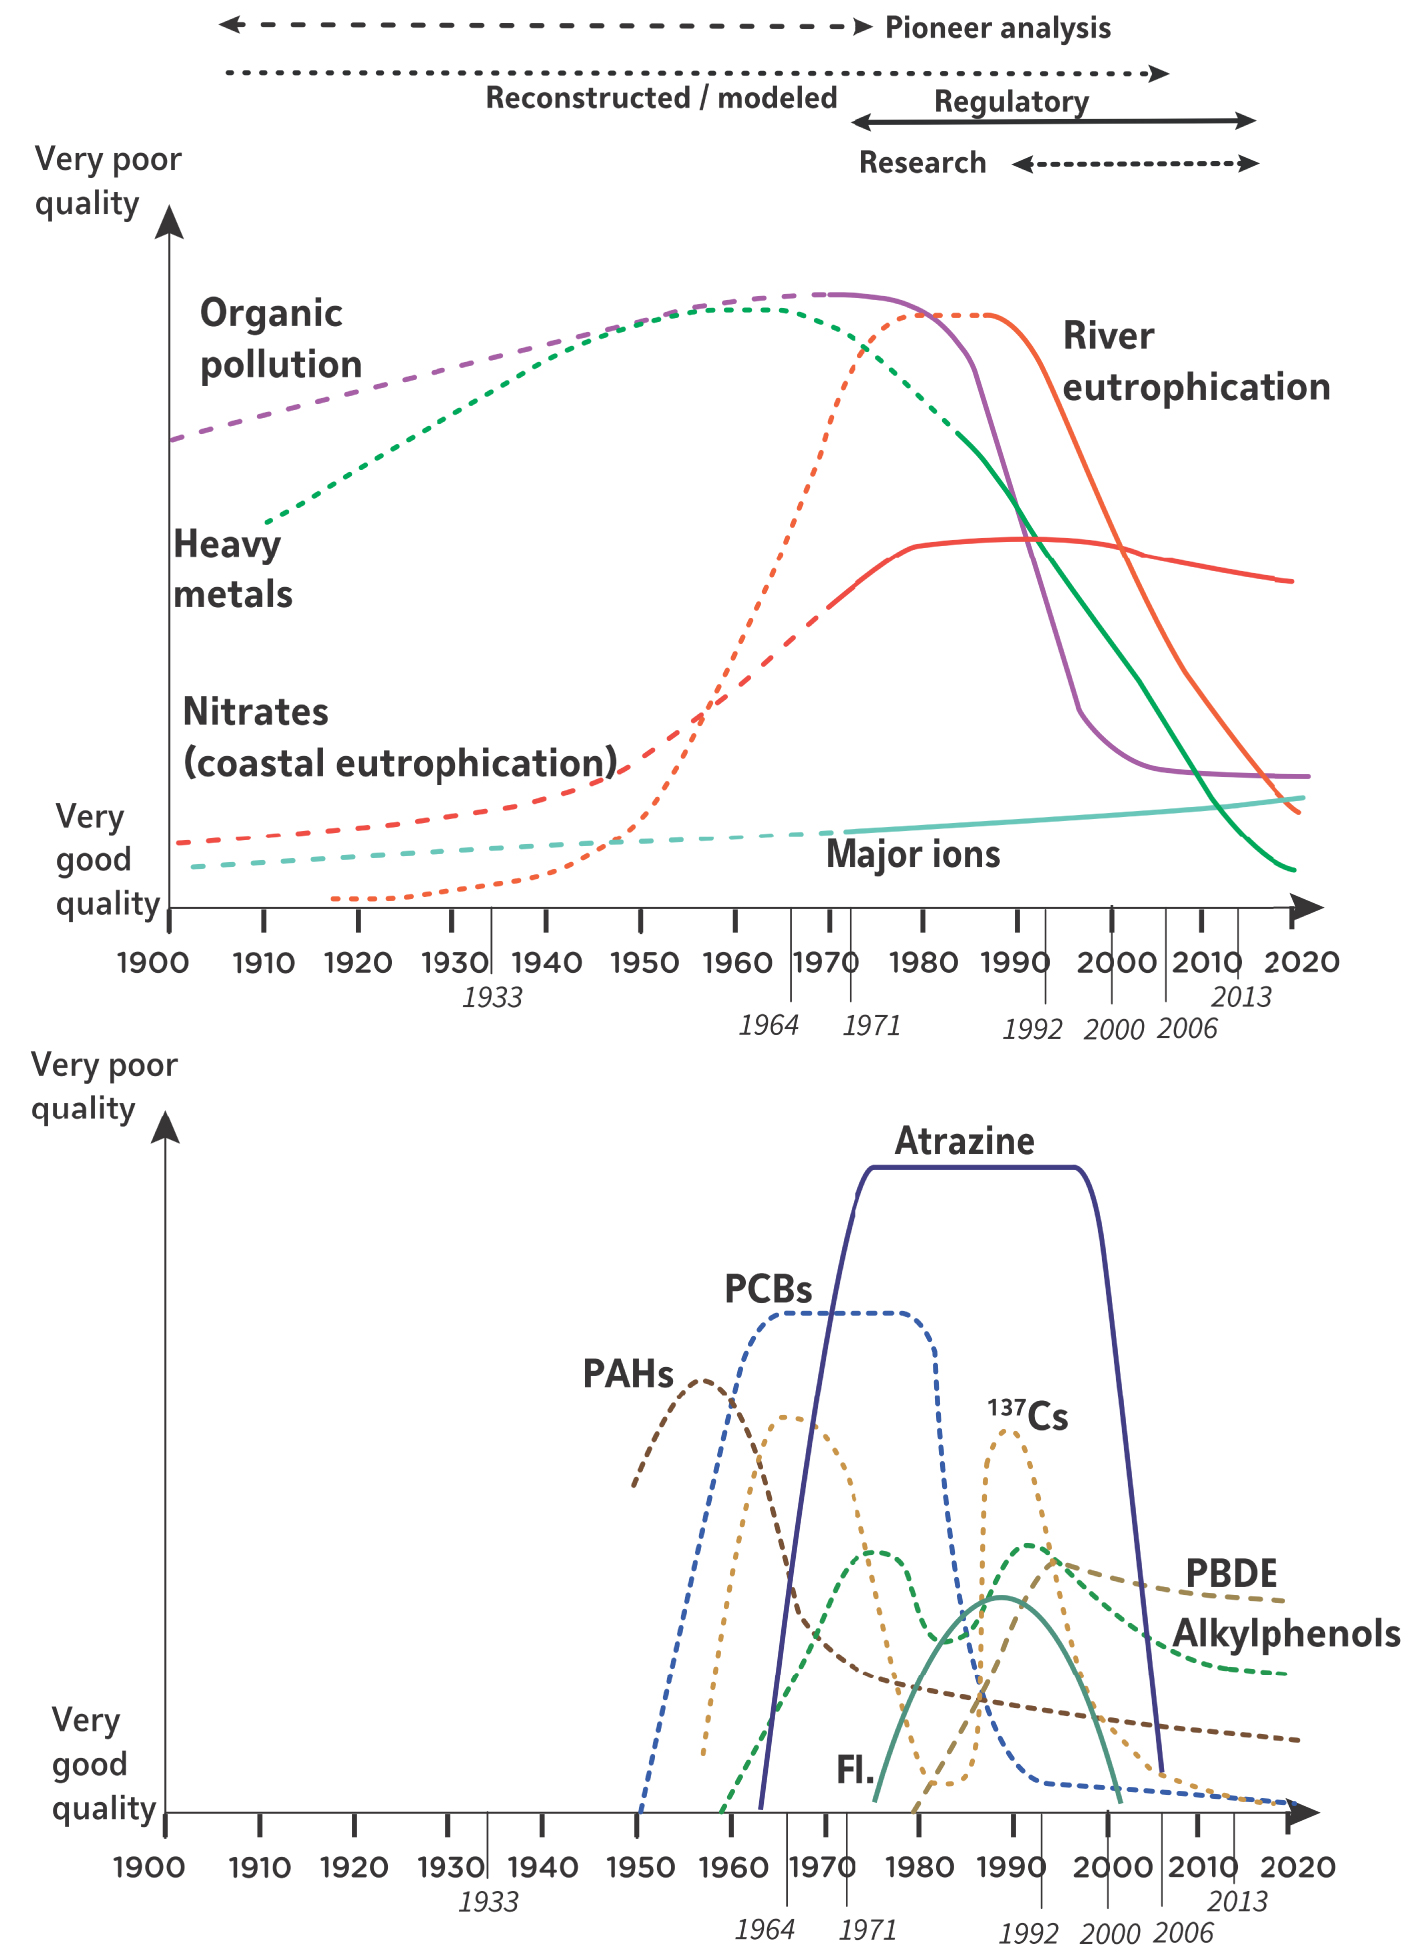
Each water quality issue, its development, extension, amplitude and resolution, is specific (Figure 3). In addition, the trajectories may be quite different within each type of issue (e.g. among nutrients, heavy metals, pesticides, endocrine disruptors) and specific trajectories must be established (e.g., cadmium, atrazine, flumequine). Also, for a given riverborne material the trajectory analysis depends on viewpoint and on the relevant water quality criteria: the nitrate issue, analyzed with the drinking water criteria (50 mg) used in the basin during several decades, is very different from the one considering the coastal eutrophication guideline (10 mg), recommended by scientists.
The issues that have been solved are characterized by a bell shape which could suggest a virtuous and linear cause-effect relationships with early warning by whistle blowers, early monitoring and assessment, inscription on the political agenda, research of consensus on solutions, and finally, adequate responses. Such ideal succession has only been observed for a few water bodies, such as some alpine lakes, Annecy and Léman (Geneva Lake), [Meybeck 2002]. In many cases improvements have only been noticeable since the 1970s (organic pollution, DDT, PAHs, PCBs, heavy metals, fecal coliforms), or even later (last 20y for eutrophication) (Figure 3). Some issues have reached a plateau or are slightly improving, such as nitrate pollution, while physical changes of the river course (not represented here) should be considered as permanent [Lestel et al. 2022]. Although sediment records evidence other types of pollution, they are still publicly qualified as emergent, i.e. without regular monitoring nor related WQ criteria. Some WQ issues which have been continuously surveyed since the beginning of monitoring (salinization, acidification) have never shown any problem in the Seine basin (green level on quality scale).
For understanding the evolution of the river quality, a classical analysis is the DPSIR (Drivers of activities, Pressures on the aquatic system, State of the river quality, economic, health or cultural Impacts and policy Responses) recommended by the Europe Environmental Agency and by the United Nation program GEMS-Water. The DPSIR has the hidden hypothesis of a linear, rapid and virtuous process. However, when a detailed and specific analysis is made on the multidecadal, often centennial, time scale which represents the start of an issue, its peak and its resolution, a completely different situation is found, as for the metal pollution, the PCBs contamination, and many others in the Seine basin [Ayrault et al. 2021; Meybeck et al. 2007, 2018]. This example revealed that (i) river quality should be studied over several human generations, (ii) linear cause-effect relation between the DPSIR elements may not exist, (iii) past impacts are generally unknown, (iv) the environmental improvement may occur much before any voluntary response, (v) scientific knowledge may not trigger any action, etc. Whereas DPSIR only captures how problems are understood today, the longue durée water quality trajectory is necessary to understand how social and physical processes have interacted. It incorporates to DPSIR other critical elements as scientific and technical knowledge, all monitoring elements, political agenda and its debates, norms, which allows the intercomparison of issues within a given river basin and between basins, for a given type of issues [Lestel and Carré 2017].
Detailing the temporality of the multiple elements of a given issue in terms of the first analysis in the hydrosystem, first awareness, start of monitoring, maximum impact, duration of impact, start of response [Meybeck 2002; Meybeck et al. 2018] as presented in Table 2 for selected issues makes it possible to show the time lags between knowledge and action, knowledge not leading to action and, conversely, action that can be taken without local knowledge of pollution. Actually, water quality is a continuous, spiraling, social construction, informed by past issues and inherited modes of monitoring [Bouleau et al. 2017].
Elements of the triplets knowledge, (1)–(3), monitoring, (4)–(6) and responses, (7)–(9) to selected types of pollution of the Lower Seine
| (1) | (2) | (3) | (4) | (5) | (6) | (7) | (8) | (9) |
|---|---|---|---|---|---|---|---|---|
| Pollution type | Impact start | First awareness | Monitoring start | Objectives of survey | Maximum impact | First regulatory assessment | Regulatory response and quality standards | Technical response |
| Dissolved oxygen | <1874 | 1874 | 1880s | AB | 1874–1990 | 1960s | 1971 grid 5 mg⋅L−1 SEQ-eau 8 mg⋅L−1 | BOD5 treatment in WWTP |
| 1976 | ||||||||
| Ammonia | 1864 | 1864 | 1880s | AB | 1970s | 1960s | 1971 grid 0.5 mg⋅L−1 SEQ-eau | treatment WWTP 2007 |
| 1976 | ||||||||
| Nitrate DW | 1950s | 1960s | 1874 | DW | 2000 | 1971 | 50 mg⋅L−1 | Nitrate treatment WWTP 2007 |
| Nitrate CR | 1980s | 1874 | CR; RT | (2000) | 10 mg⋅L−1 | Expected | ||
| Chloride & Salts | <1874 | None | 1874 | DW; I | 1950–2000 | 1971 | WHO-DW 200 mgCl−⋅L−1 | Not needed |
| Phosphate (river eutrophication) | 1960 | 1976 | 1985 (chloro a) | DW; AB; RT | 1970–1990 | 1992 P use restriction | P treatment in WWTP (2000) | |
| PCBs | 1952 | 1970 | 1990s | FC | 1960–1975 | 1990s | Use ban | PCBs destruction |
| Cadmium | <1930 | 1972 | 1985 (river bed sediment) | DW | 1960 | None | Use restriction then ban (1985) | Recycling industrial wastes |
| Atrazine | (1970) | 1980 | 1985 | DW | 1970–2000 | Ban (2003) |
Objectives of survey: AB aquatic biota degradation; FC food consumption; DW drinking water/human health; RT recreation tourism; I irrigation; CR coastal resources. WHO World Health Organization.
Impacts are generally the least documented components of DPSIR. In the Seine a large data set has been assembled concerning (i) basin drivers, as population, economical statistics, agricultural practices, (ii) basin pressures as sewer inputs, use of fertilizer, chemicals, metals, and (iii) basin responses as environmental laws and regulations, waste treatment, etc. However, impacts of river quality degradation on people’s health, economic sectors, on the aquatic environment’s health (aquatic ecology and biodiversity), and on related degradation of coastal waters, as well as on economic sectors (tourism, fishing, …), are still insufficiently assessed in the Seine basin. The national statistics were not conceived to collect such information [Lestel et al. 2007]: hydrological watersheds do not coincide with administrative limits, economical loss remains barely known, past and present environmental impacts on human health in the basin remain poorly known.
The bottlenecks are multiple and refer to different registers of action (see Table 3). Certain levels of river pollution, which dominant actors and experts consider inevitable, is reinforced by ignorance of the effects of industrial products, but also by lobbies, prohibiting any political debate on certain types of pollution. This prevents or limits the implementation of adequate financial or regulatory means. This also explains why the knowledge acquired by monitoring networks and researchers’ modeling is not mobilized for action.
Typology of the critical points encountered in the construction of the water quality in the Seine River basin, limiting (in no order of priority) the resolution of the issue (with some examples and dates)
| Critical points | Examples |
|---|---|
| State experts accepting pollution as a necessary evil for modernity | Industrial and municipal discharge into rivers until the 1970s |
| Lack of political concern | All toxics before 1971 |
| Lack of scientific knowledge | Heavy metals before 1970s |
| Un-appropriate monitoring | Most pesticides before 2006; metals on coarse bed sediments (1985) |
| Lobbying | Debate on nitrate origins (1980s); debate on river eutrophication cause (1985–95) |
| Unnecessary frequent monitoring | Major ions; conductivity (since 1971) |
| Laboratory issues | Contaminated analyses (dissolved metals); high detection limits for many trace components; high analytical cost. (until 2000s) |
| Wrong WQ target | Choice of drinking criteria for nitrate management (since 1971) |
| Inconclusive or limited WQ assessment | Metal issue (since 1971); pesticide issue (1985–2006) |
| Inadequate technical solution | Sewage farms (1870s–1990s) |
| Lack of financial support | No pollution tax resources before 1968 and lack of political support for financing de-pollution with existing taxes |
| Lack of administrative tool | No dedicated institution for WQ management and for wastewater management before 1968 |
| Lack of water quality scale | Many examples; emerging pollutants etc. |
| Underestimated issues | Most toxic contaminants before 2006 |
5. Conclusions and perspectives
PIREN-Seine has provided precise knowledge of the pressures and their dynamics throughout the basin. The models have made it possible to consider point and diffuse inputs, discharges, from the headwaters of rivers to estuaries and coastal waters. The Seine River basin has already been used to test new approaches on a well-documented territory, as the Anthropocene Hypothesis [Meybeck and Lestel 2017; Rockström et al. 2014; Vörösmarty et al. 2015], urban socio-ecological trajectories [Barles 2015], land to sea continuum of nitrogen cycle [Billen and Garnier 2021].
This knowledge has been used by the public players, depending on the opportunities available, or ignored when the political situation did not allow it. However, the exploration of agricultural and climatic scenarios is now questioning production and consumption patterns and their necessary transformation of the agro-food system, beyond technical solutions alone, with the now recognized effects of climate change.
The PIREN-Seine hydrological models, taking into account the global climate change (GCM) scenarios, predict less summer rainfall, although with localized very intense rainfalls, which may greatly change the hydrosystem functioning, and the availability of water resources, and generate new water-related hazards, as the exceptional flood which occurred in June 2016 [Flipo et al. 2018]. Scenarios of hydrological changes under climate changes can be combined with the ones already explored for deep structural changes in the agrofood system. This knowledge should now be articulated with better understanding of how economic sectors and local territories might be impacted and could improve and adapt. Some processes can be studied independently from actors’ strategies; others directly depend on resources, paradigms and routines of social organizations. Therefore credible and useful scenarios must be elaborated with stakeholders willing to address these issues, in order to set robust decisions based on what are the most limiting factors for population resilience.
Interactions between scientists and water managers (dealing with water, but also with agriculture, urban planning, transportation, and health), must be given priority because it is actually on this scale that (i) innovations are made, under social and political pressure, and that (ii) the action value of scientific information is collectively built.
While the 6th planetary limit concerning the freshwater cycle was crossed in April 2022, the social demand for waterfront reclamation and access to urban nature is increasing and social groups experiencing new practices may foster new concerns for the environment. Opportunities for new perceptions of river systems may arise. The future challenge for research is to find which actors can remove the identified bottlenecks in the management of water quality problems. For this, more detailed studies on the diversity of actors in each sector and their levers of action are crucial. Many events in the last few years have profoundly shaken the ways in which actors project themselves into the future and questioned certainties. As the beginning of the history of PIREN-Seine program shows, only when lock-ins are suddenly released, may the different sources of knowledge accumulated in the program be used for innovative decisions.
Conflicts of interest
Authors have no conflict of interest to declare.
Acknowledgments
The authors wish to acknowledge the numerous Seine basin partners for having continuously supported the PIREN Seine program since 1989. This long-term program belongs to the Zone Atelier Seine, an environment observatory instrument created by the CNRS in 2000, part of the international Long Term Socio-Ecological Research (LTSER) network.