


 CC-BY 4.0
1. Introduction
Under the Paris Agreement, global efforts to address climate change and achieve climate goals have led nations to explore various strategies to reduce carbon emissions and enhance carbon sinks. The Global Stocktake evaluates progress towards the goals of the Paris Agreement, including mitigation, adaptation, and means of implementation and support. This assessment aims to determine the effectiveness of existing climate policies, identify gaps in climate action and support, and accelerate efforts to combat climate change. As part of this effort, Nationally Determined Contributions (NDCs) have become an important framework for countries to outline their commitments to limit global warming. While terrestrial ecosystems have traditionally been the focus of carbon sink accounting and carbon removal initiatives [Powis et al., 2023], the role of oceanic ecosystems has gained attention [Pendleton et al., 2012].
To date, the only ocean-related pathways that are included as a mitigation strategy in NDCs are those mediated by blue carbon (mangroves, seagrasses, and salt marshes) or other carbon-rich ecosystems such as kelp forests [Lecerf et al., 2021]. These ecosystems are recognized for their critical role in carbon sequestration and other ecosystem services, acting as natural buffers against storms and erosion, and providing essential habitats for marine biodiversity [Barbier et al., 2011, Friess et al., 2020]. Conservation and restoration of blue carbon ecosystems is emerging not only as a climate change mitigation strategy, but also as an adaptation tool for biodiversity conservation and the well-being of marine and human communities. Nevertheless, the global-scale mitigation potential of blue carbon ecosystems is limited, likely amounting to less than 2% of current CO2 emissions [Bindoff et al., 2019], primarily due to the restricted surface area available for the growth of these ecosystems.
In contrast, nations’ Exclusive Economic Zones (EEZs) are vast, covering 41% of the Earth’s ocean surface, and potentially representing a significant portion of the world’s ocean carbon sink. Including these extensive oceanic areas in NDCs has been debated [Rickels et al., 2023], particularly when comparing coastal states with large EEZs to landlocked states. This comparison raises questions about feasibility and the potential impact on global carbon accounting [McNeil, 2006, Karstensen et al., 2021]. As climate change mitigation efforts intensify under the Paris Agreement, the role of oceanic ecosystems is gaining attention. The vast areas of EEZs present both an opportunity and a challenge for carbon accounting.
The ocean differs from terrestrial carbon sinks in that oceanic carbon fluxes and subsequent storage are delocalized. The mixing of water masses in the ocean hinders the validation of local changes in stock measurements. Ocean carbon fluxes are inorganic, unlike terrestrial biosphere fluxes, which occur directly between the atmosphere and the organic carbon pool. Instead carbon fluxes between the atmosphere and the ocean are determined by the CO2 partial pressure (pCO2) gradient at the air–sea interface and physical properties like turbulence and bubbles. Another distinction is that, in the ocean, discrimination must be made between total carbon fluxes and anthropogenic carbon fluxes. The preindustrial ocean is estimated to have degassed approximately 0.6 PgC per year to the atmosphere due to imbalances in natural river inputs and sediment losses of carbon [Regnier et al., 2022]. This estimated preindustrial natural carbon degassing and its distribution must be subtracted from the total ocean carbon flux that is measured today in order to estimate the residual anthropogenic ocean carbon flux. In contrast with the land biosphere, the circulation of water masses and biogeochemical processes in the ocean result in regions of natural atmospheric carbon uptake (e.g. deep-water formation regions) and loss (e.g. equatorial upwelling regions). Consequently, ocean anthropogenic carbon uptake can manifest as both an enhancement in total carbon ingassing, and counterintuitively, a reduction in total carbon outgassing. The resulting anthropogenic carbon sink is generally quantified with a combination of global ocean biogeochemical models and observation-based products. Global ocean biogeochemical models show relatively good agreement with the observed spatial and temporal variability of surface ocean pCO2 over large spatial and annual scales [Hauck et al., 2020, Friedlingstein et al., 2023]. However, they are subject to biases, notably in the transport of carbon from the surface to the deep ocean [Bourgeois et al., 2022], and potentially underestimate the mean ocean carbon sink [IPCC, 2021]. Measurements are therefore essential for estimating the total carbon flux from observations and for evaluating models. However, while the number of observations has increased considerably, sampling is not evenly distributed both spatially and temporally, leading to significant biases [Hauck et al., 2023b].
France’s EEZ covers about 10 million km2, second only to the United States in global extent. It includes overseas territories spread across all ocean basins with the exception of the Arctic, making it a major contributor to the ocean carbon cycle. Here, we use the French EEZ as a case study to highlight the potential pitfalls of incorporating the open ocean carbon sink in NDCs. Using a high-resolution ocean biogeochemical model forced with a recent atmospheric reanalysis, as well available pCO2 observations, we assess the French EEZ anthropogenic carbon sink over the last forty years. Our analysis illustrates the multiple challenges associated with monitoring and assessing the dynamics of this carbon sink and highlights the conceptual complexities and incompatibilities surrounding the incorporation of the open ocean carbon sink into NDCs. We do not address the inclusion of coastal blue carbon ecosystems in NDCs, which is already taking place and is beyond the scope of this paper.
2. Methods
We use a high-resolution ocean biogeochemical model forced with atmospheric reanalyses. The model is therefore closely aligned to recent climate change and variability. The use of a model allows us to explicitly compute anthropogenic carbon fluxes in space and time, providing a comprehensive view of the underlying mechanisms and variability.
2.1. NEMO-PISCES ocean biogeochemical model
Historical ocean-only simulations were performed using version 3.6 of the Nucleus for European Modelling of the Ocean (NEMO). This comprehensive framework includes version 3 of the Louvain-La-Neuve Sea Ice Model (LIM) [Fichefet and Maqueda, 1997] and version 2 of the Pelagic Interaction Scheme for Carbon and Ecosystem Studies (PISCES) biogeochemical model [Aumont et al., 2015]. The PISCES ocean biogeochemical model [Aumont et al., 2015] includes key elements for the assessment of air–sea carbon fluxes and oceanic sequestration of anthropogenic carbon. This includes carbon in various non-living forms (dissolved inorganic carbon, dissolved organic carbon, particulate inorganic carbon (calcite), and particulate organic carbon) and living compartments (nanophytoplankton, diatoms, microzooplankton, and mesozooplankton). It also includes total alkalinity and essential marine macro/micro nutrients (nitrate, ammonium, phosphate, silicate and iron). No vegetated coastal ecosystems, such as blue carbon ecosystems, are explicitly represented in the model. Air–sea CO2 fluxes follow Ocean Model Intercomparison Project protocols [Orr et al., 2017], with gas exchange dependent on the air–sea partial pressure gradient and a parameterization of the instantaneous gas transfer velocity that depends on 10 m atmospheric wind speed [Wanninkhof, 1992, Ho et al., 2006]. We implemented the widely used “eddy-permitting” (0.25° horizontal grid) global ocean configuration eORCA025, which contains 75 vertical levels, including 7 levels in the top 10 m. The same model configuration has previously been used to assess the efficacy of marine carbon dioxide removal (mCDR) interventions, including macroalgae afforestation [Berger et al., 2023] and ocean alkalinity enhancement [Kwiatkowski et al., 2023] and has been shown to simulate total and anthropogenic ocean carbon fluxes in broad agreement with data-based estimates [Kwiatkowski et al., 2023]. The simulated estimate of the global oceanic carbon sink for 2011–2020 is 9.59 GtCO2⋅yr−1, consistent with the multi-model global carbon budget estimate of 10.3 GtCO2⋅yr−1 (9–12 GtCO2⋅yr−1) [Friedlingstein et al., 2023].
2.2. Simulations
Simulations were initiated in 1958, based on data-derived climatologies and a coarser resolution NEMO-PISCES historical simulation of the anthropogenic ocean carbon stock [Terhaar et al., 2019]. The model was then run from 1958 to 2015 using atmospheric forcings provided by the Drakkar forcing set 5.2 (DFS5) [Dussin et al., 2016], based on the ERA-Interim reanalysis over 1979–2015. A historical simulation was forced with yearly averaged historical atmospheric CO2 concentrations reconstructed from ice cores and atmospheric records [Le Quéré et al., 2015]. A parallel preindustrial control run (PI control) was also performed, in which the atmospheric forcings were identical but the atmospheric CO2 mole fraction was held constant at the preindustrial level, defined as 287 ppm in 1870. Total air–sea CO2 fluxes were derived from the historical simulation while anthropogenic fluxes were calculated as the difference between fluxes in the historical simulation and the parallel PI control.
An additional set of simulations (historical and PI control) was performed, incorporating atmospheric forcings from JRA55-do v1.5 [Tsujino et al., 2018] which cover the period from 1958 to near present. These simulations were run from 2006 to 2020, initiated from DFS5 simulations. The DFS5 and JRA55-do v1.5 forced simulations were finally merged in January 2014 to form two coherent historical and PI control simulations that cover the period 1958 to 2020.
2.3. Observations
Robust pCO2 measurements are critical for estimating total carbon fluxes from observations. In this context, we used the latest version of the Surface Ocean CO2 Atlas (SOCAT, https://www.socat.info), which contains about 43 million observations of surface pCO2. We characterized the temporal and spatial coverage of observations in the French EEZ using the gridded product on a 1° × 1° grid. This was compared to EEZ boundaries projected on the same grid using the Python shapefile function.
EEZ boundaries, including the French territories, were defined using the Maritime Boundaries Geodatabase, version 11 (Flanders Marine Institute (2019), https://www.marineregions.org). This analysis included certain disputed areas, including those contested by New Caledonia and Vanuatu, and by Tromelin and Mauritius.
3. Results
3.1. The anthropogenic open ocean carbon sink of the French EEZ
The simulated anthropogenic ocean carbon sink in the French EEZ over the period 2011–2020 was 0.21 GtCO2⋅yr−1 (Figure 1). This is 7.5% of the global EEZ anthropogenic carbon sink and 2% of the total global oceanic anthropogenic carbon sink. Due to extensive overseas territories, notably in the Pacific and Indian Oceans, French waters were the third largest EEZ carbon sink, after the United Kingdom and Australia, absorbing the equivalent of about 50% of the 418 million tonnes of CO2,eq⋅yr−1 emissions of France over 2011–2020 (territorial annual greenhouse gas emissions in 2011–2022) [Jones et al., 2023, Friedlingstein et al., 2023].
The extent of Exclusive Economic Zones and their associated anthropogenic carbon sink. (a) Surface area (million km2) of the world’s oceans, the high seas, the global Exclusive Economic Zone (EEZ), and the 19 largest EEZs (color bar), each identified by its ISO 3166 code. (b) Corresponding anthropogenic carbon sink values (in GtCO2⋅yr−1) for the same geographical entities: the global ocean, the high seas, the global EEZ (indicated by a numerical value), and the 19 largest EEZs sorted by extent. The anthropogenic carbon sink is averaged over the period 2011–2020 for each country. (c) Map of the mean global anthropogenic carbon sink over 2011–2020 in gCO2⋅m−2⋅yr−1.
3.2. Variable regional contributions to the French ocean carbon sink
The model simulations indicate significant regional disparities in the French EEZ anthropogenic carbon sink. Southern Ocean territories exhibited the highest fluxes per unit area, with mean anthropogenic carbon fluxes ranging from 20 to 60 gCO2⋅m−2⋅yr−1 (Figure 2), up to 160 gCO2⋅m−2⋅yr−1 in winter. Notably, the Atlantic and Mediterranean coastal areas of mainland France also demonstrated relatively high area-specific anthropogenic carbon fluxes, ranging from 10 to 50 gCO2⋅m−2⋅yr−1, reaching 100 gCO2⋅m−2⋅yr−1 in winter. In contrast, the tropical and subtropical regions of the French EEZ displayed lower area-specific anthropogenic carbon fluxes, ranging from 5 to 30 gCO2⋅m−2⋅yr−1. Despite lower area-specific fluxes, the areal extent of some of these tropical regions, notably in the Pacific territories, means that they are major drivers of the anthropogenic carbon sink in the French EEZ. For instance, the total uptake for French Polynesia and New Caledonia in 2020 was 83.7 MtCO2⋅yr−1 and 31.8 MtCO2⋅yr−1, respectively. The combined anthropogenic carbon sequestration capacity of these two regions exceeded that of all other French territories combined.
Distribution of the French EEZ anthropogenic carbon flux across territories. The mean anthropogenic carbon flux (gCO2⋅m−2⋅yr−1) over 2011–2020 in French territories of the (a) Pacific (New Caledonia, Matthew and Hunter Island, Wallis and Futuna, French Polynesia, and Clipperton), (b) Caribbean (Martinique, Guadeloupe, Saint-Martin, Saint-Barthélemy, (c) South America (French Guiana), (d) Indian Ocean (Juan de Nova, Bassas da India, Europa, Réunion and Tromelin) and Southern Ocean (Crozet, Kerguelen and Amsterdam and Saint Paul Islands), and (e) mainland France. All maps are on the same scale. Saint-Pierre and Miquelon has been omitted.
3.3. Historical trends in the French ocean carbon sink
Our simulations show that over the last 40 years the French EEZ sink increased from 140 MtCO2⋅yr−1 to about 225 MtCO2⋅yr−1 (Figure 3a). The largest increases occurred in French Polynesia, New Caledonia, the Southern Ocean Islands and Clipperton, with the increase near proportional to the initial sink (R2 = 0.96). The observed increase of the French EEZ carbon sink corresponds to that of the global EEZ carbon sink, indicative of a response to the atmospheric carbon dioxide growth rate (Figure 3a). However, our simulations revealed a decline in the growth of the French carbon sink since 2013 with a particularly low carbon sink in 2016 observed in 7 out of 21 territories. This slowdown is distinct from a slowdown of the global EEZ carbon sink (Figure 3b). As a result, the French EEZ share of the global EEZ carbon sink declined from 7.3% to 6.4%, with French Polynesia, New Caledonia, and Amsterdam and St Paul Islands territories being the main contributors to this decline.
Evolution of the anthropogenic carbon sink in the territories of the French EEZ. The annual mean anthropogenic carbon sink presented as (a) absolute values and (b) percentages of the global EEZ anthropogenic carbon sink. The carbon sink values for each territory are stacked, and the cumulative total is the globally integrated French carbon sink.
3.4. Disentangling anthropogenic and total ocean carbon fluxes and stocks
Analysis of the anthropogenic carbon sink using the French EEZ territories as a case study, highlights a number of features that are consistent across other EEZs.
3.4.1. Net air–sea fluxes of anthropogenic carbon into an EEZ (or EEZ region) are not indicative of the change in anthropogenic carbon stocks within that EEZ
For all of the French EEZ territories, there is an imbalance between the net air–sea anthropogenic carbon flux and the change in the ocean anthropogenic carbon stock (Figure 4a). Some EEZ territories are net exporters of anthropogenic carbon to other EEZs and the high seas. For example, roughly 25% (3 gC⋅m−2⋅yr−1) of the net-air sea anthropogenic carbon flux in Kerguelen is not retained in its waters. While in Guadeloupe, the increase in the integrated anthropogenic carbon stock is approximately 4 times what it receives in net air–sea fluxes, with 12 gC⋅m−2⋅yr−1 supplied by waters that are transported into the Guadeloupe region. Ocean dynamics, therefore, lead to significant disparities between the carbon stocks within EEZ waters and the anthropogenic carbon uptake from the atmosphere.
The relationship between total and anthropogenic carbon fluxes and anthropogenic carbon storage across French EEZ territories. (a) Comparison of the mean air–sea anthropogenic carbon flux (gC⋅m−2⋅yr−1) and the change in depth integrated anthropogenic carbon stock in each French EEZ territory (gC⋅m−2⋅yr−1). In the area identified as “importers”, the increase in the anthropogenic carbon stock exceeds the air–sea flux, indicating a net horizontal transport of carbon into territorial waters. Conversely, in the area identified as “exporters”, the air–sea anthropogenic carbon flux exceeds the increase in the inventory, indicating a net export of anthropogenic carbon to other EEZs or the high seas. (b) The mean anthropogenic carbon flux and mean total carbon flux in each French EEZ territory. The total carbon flux is the sum of the anthropogenic carbon flux and the natural carbon flux. A negative total carbon flux indicates a net flux of carbon to the atmosphere (outgassing). A positive total carbon flux indicates a net flux of carbon to the ocean (ingassing/uptake).
3.4.2. Anthropogenic carbon uptake occurs in regions of carbon ingassing and outgassing
The French EEZ case study highlights the disconnect between total air–sea carbon fluxes and anthropogenic carbon fluxes (Figure 4b). All territories of the French EEZ are anthropogenic carbon sinks with fluxes ranging from 2–11 gC⋅m−2⋅yr−1. However, the total air–sea carbon fluxes for the same EEZ territories range from −10 to 20 gC⋅m−2⋅yr−1. French EEZ territories can, therefore, exhibit net ingassing or outgassing of total carbon while still exhibiting anthropogenic carbon uptake. The French EEZ territory with the highest anthropogenic carbon fluxes (Kerguelen, Cant: 11 gC⋅m−2⋅yr−1) has actually total carbon fluxes near zero.
3.5. Observational coverage
The NEMO-PISCES model permits the calculation of anthropogenic carbon fluxes in space and time, providing insight into carbon flux trends and the mismatch between carbon fluxes and carbon stocks. However, given the persistence of large discrepancies between data and models [Friedlingstein et al., 2023], robust pCO2 measurements are essential for estimating total carbon fluxes from observations. Therefore, good observational coverage is crucial, as under-sampling could lead to significant biases in fluxes reconstructed from observations [Hauck et al., 2023b]. A review of the available SOCATv2023 pCO2 measurements in French EEZ waters, showed that observational coverage remains limited (Figure 5). Compiled measurements for 2011–2021 are patchy in several French territories. This is particularly striking in French Polynesia where spatial coverage is notably low. Large portions of the territory either have no observations at all or only one month of observations. Specifically, on a 1° × 1° grid, only 14% of the French Polynesia EEZ grid cells have at least one observation, and a mere 1% has at least 2 months of observations available. The southern Indian Ocean also has limited data, with 35% of Crozet, 73% of Amsterdam and Saint Paul and 83% of Kerguelen Island covered by at least one observation. However, this coverage drops to 0%, 5.5% and 7% for those three islands, respectively, when the criterion is at least 4 months of observations per year. This lack of data is particularly problematic as this region plays an important role in carbon uptake, but only a fraction of the seasonal cycle is present in the observations. On the contrary, the Atlantic territories have good spatial and temporal coverage, with 75% of French Guiana territory covered with at least 6 months of data and 66% for both mainland France and Martinique.
The scarcity of ocean carbon observations in the French EEZ. Spatial and temporal resolution of pCO2 measurements (gridded SOCATv3) in the French EEZ during the period 2011–2021. Central map: Calendar months with available data in the French EEZ, where 12 indicates full coverage of the seasonal cycle and light gray indicates no measurements available for the period 2011–2021. Surrounding time series: Number of pCO2 measurements for each French EEZ territory from 2011 to 2021. The grey area below the lines indicates continuous observations with at least one measurement per month.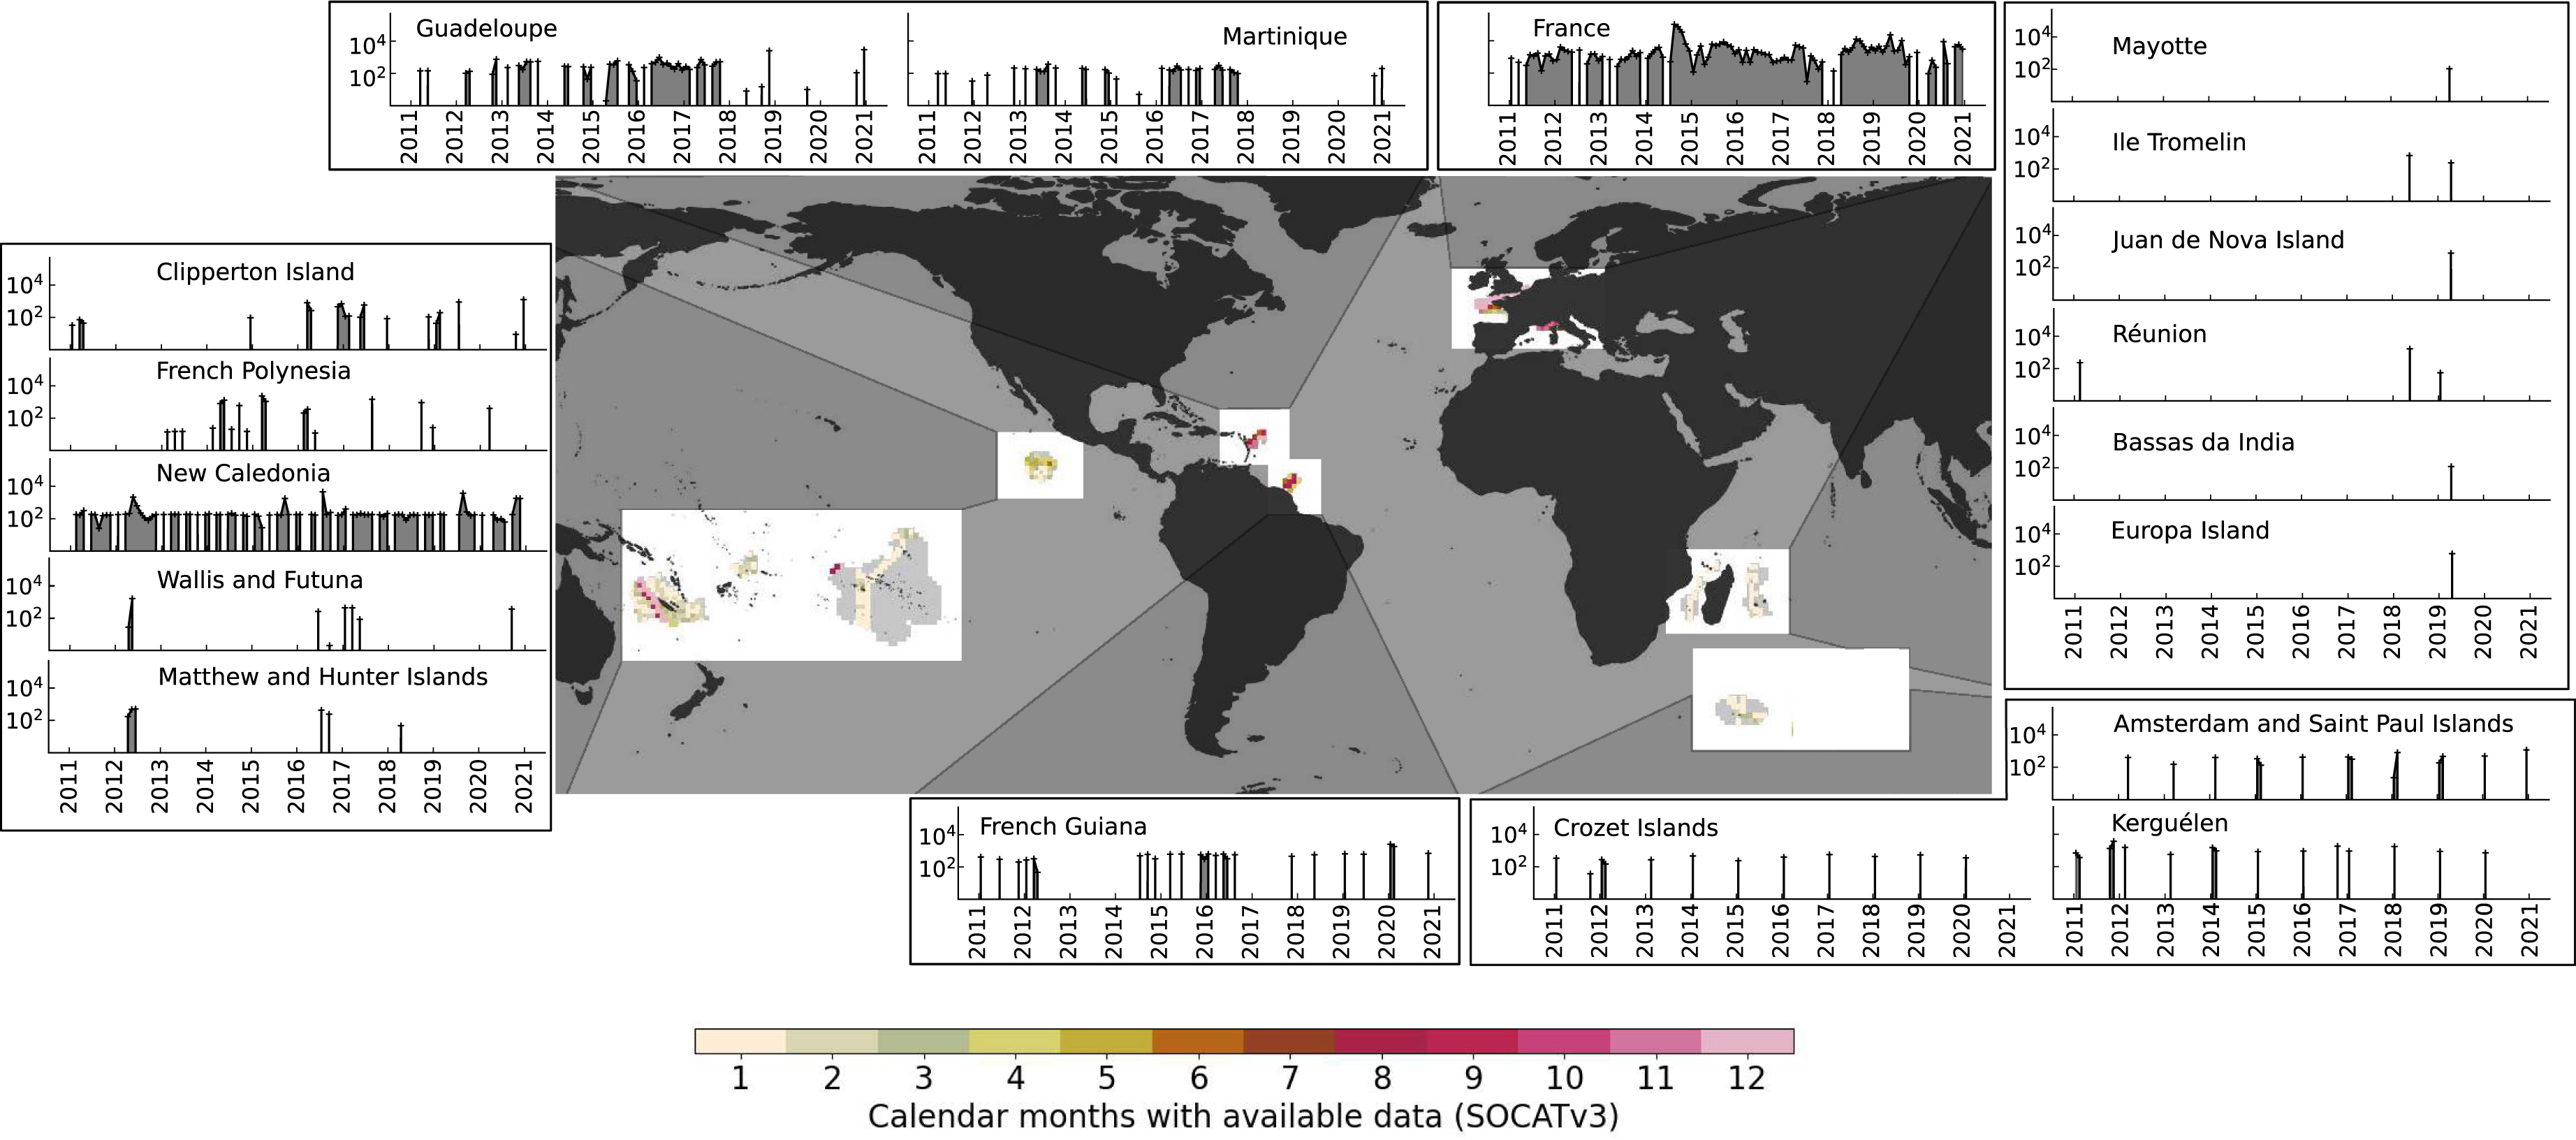
4. Discussion
4.1. The French EEZ case study
Our study reveals a significant anthropogenic carbon sink in the world’s EEZs, accounting for 3.55 GtCO2⋅yr−1 or 35% of the global ocean CO2 sink in 2020. The anthropogenic carbon sink in EEZs can be a similar order of magnitude to national emissions: for example, the French EEZ sink corresponds to around 50% of French CO2,eq territorial emissions, while the two largest EEZ sinks, Australia and the UK, both absorb the equivalent of around 40% of their emissions. Even more absurd, the waters of 34 countries absorb more than their own emissions, up to 1640 times more for Tuvalu. We estimate an increase in the anthropogenic carbon sink within the French EEZ over the last 40 years, from 140 MtCO2⋅yr−1 in 1980 to about 225 MtCO2⋅yr−1 in 2020. This is driven by the increase in the global ocean carbon sink in response to rising atmospheric CO2 levels [IPCC, 2021, Friedlingstein et al., 2023]. However, we have identified a recent decrease in the French EEZ that is not reflected in the global EEZ carbon sink. This decrease may be attributable to changes in atmospheric forcing in our simulations that affect ocean dynamics and redistribute air–sea fluxes.
Using the French EEZ as a case study, we highlight the considerable diversity among EEZ territories in terms of total air–sea carbon fluxes, anthropogenic air–sea carbon fluxes and changing oceanic Cant stocks. French EEZ territories exhibit both total uptake of carbon from the atmosphere (ingassing) and total loss of carbon to the atmosphere (outgassing). Yet despite this, over the simulated period, all EEZ territories are net absorbers of anthropogenic carbon, albeit with the magnitude of the area-specific air–sea Cant flux differing by a factor of 6 between territories. Moreover, territories show wide disparities in the accumulation of Cant in their waters, and this accumulation is not equivalent to the cumulative air–sea Cant flux. This disparity is a consequence of the advection and mixing of Cant within the ocean, which results in certain EEZ territories being net exporters of Cant to adjacent waters, while others are net importers. Despite the temptation to incorporate ocean carbon fluxes into NDCs due to the magnitude of associated anthropogenic carbon sinks, the drivers and properties of ocean carbon fluxes, as well as the wider context of the remaining carbon budget, make this highly inadvisable.
4.2. Pitfalls of including EEZ carbon fluxes in NDCs
One of the principal issues with including EEZs in NDCs, is that ocean anthropogenic carbon uptake is already accounted for when estimating the remaining carbon budget [Lamboll et al., 2023, Rogelj et al., 2016, Matthews et al., 2021]. Consequently, the only rationale for including EEZs in NDCs lies in demonstrating that human interventions have enhanced the anthropogenic carbon sink. The transient climate warming response to cumulative CO2 emissions (TCRE) is central to remaining carbon budget estimates and can be derived from both models and observations using a variety of methodologies. TCRE estimates invariably account for unmanaged ocean anthropogenic carbon uptake, including that which is projected to occur in EEZs. As such, our best estimates of permissible emissions to stay within 1.5 °C or 2 °C global warming targets already assume that ocean anthropogenic carbon uptake in EEZs will continue in response to biogeophysical forcing. Including total anthropogenic fluxes, as opposed to any managed additional flux, into NDCs would therefore break the coherence between the remaining carbon budget and the global stocktake.
Moreover, for consistency, any management practices found to have diminished EEZ Cant uptake, would equally need to be declared [Bach et al., 2021]. The concept of additionality requires a standardized definition applicable across all contexts. For instance, notable disparities exist in estimating anthropogenic land-use carbon fluxes between the model-based Global Carbon Budget (GCB) and the inventories submitted by countries to the United Nations Framework Convention on Climate Change (UNFCCC). The former includes only direct anthropogenic effects, while the inventories reported by countries generally include indirect removals on that land, such as the fertilization effect caused by increasing atmospheric CO2 concentrations [Grassi et al., 2023, Gidden et al., 2023]. Similarly, the anthropogenic ocean carbon sink operates independently of human management, primarily in response to increased atmospheric CO2. Although ocean Cant uptake is nearly ubiquitous, the magnitude of this flux at the air–sea interface is highly regionally variable (Figure 1) and strongly determined by ocean dynamics and carbonate chemistry. In particular, cold deep-water formation regions such as the North Atlantic and Southern Ocean are major hotspots of anthropogenic carbon uptake (Figure 1) as water masses containing Cant are subducted. As such, both historical and future Cant uptake in an EEZ is almost entirely determined by the natural ocean dynamics and carbonate chemistry of the waters, and the impact of climate change on these properties (in conjunction with global CO2 emissions). Crucially, these oceanic properties are almost entirely independent of human intervention and presently beyond the control of any nation state.
Furthermore, integrating EEZ carbon fluxes into NDCs presents a challenge to fairness and equity, and may raise climate justice concerns. Cant uptake at the air–sea interface is higher in high latitude regions, such as the Southern Ocean and the North Atlantic (Figure 1c), coincident with the EEZs of a small number of developed countries that have historically high emissions. The potential for human enhancement of Cant uptake may additionally be greater in these regions due to generally lower sea surface temperatures (i.e., higher CO2 solubility, [Berger et al., 2023, Feng et al., 2017, He and Tyka, 2023]. Conversely, interior ocean Cant storage is higher in subtropical regions [Gruber et al., 2023], coincident with the EEZs of developing countries that have historically low emissions. The question of which nation could rightfully claim credit for Ocean Cant would arise because of large differences between where uptake initially occurs and where Cant is subsequently stored. The functioning of the ocean is global and cannot be divided into administrative units.
The transboundary nature of oceanic carbon also presents a heightened risk of potential double counting. Many EEZs are located near multiple borders; EEZ territories may be net importers or exporters of Cant to adjacent waters, regardless of whether they ingas or outgas total carbon (Figure 4). This situation exacerbates the risks of potential double counting [Luisetti et al., 2020]. Moreover, interventions in the waters of one EEZ can cause harm in another, particularly in the context of carbon dioxide removal (CDR) projects [Tagliabue et al., 2023, Boyd et al., 2022]. Thus, the emergence of ocean CDR poses novel risks that require specific policies and legislation [Boettcher et al., 2021]. The development of such a comprehensive legal framework is imperative, but is challenging and necessitates an arduous process due to the ocean’s status as a shared resource requiring extensive international cooperation. Although existing international treaties, such as the London Protocol, have addressed transboundary environmental risks, focusing on ocean fertilization [Dixon et al., 2014], there remains a notable absence of a comprehensive legal framework dedicated to marine CDR research [National Academies of Sciences, Engineering, and Medicine, 2022]. However various legal norms exist as well as codes of conduct to help guide responsible decisions in marine CDR [Boettcher et al., 2023].
4.3. Enhancing monitoring and estimation of oceanic carbon sinks: imperatives for climate mitigation and reporting
Although the inclusion of EEZs in NDCs is misguided, an accurate estimate of the EEZ carbon sink is highly desirable given its significant contribution to the global ocean carbon sink (up to 35% in our simulations). Enhanced monitoring of EEZ carbon fluxes is essential to track long-term trends and variability, as the ocean carbon sink is vulnerable to shifts caused by both direct and indirect anthropogenic drivers. Climate change exerts a diverse and multifaceted influence on ocean carbon fluxes and storage, via temperature increases, reduced buffering capacity, and changes in circulation and marine productivity. In addition, anthropogenic impacts on runoff and river inputs [Regnier et al., 2022], bottom trawling [Atwood et al., 2024, Sala et al., 2021], coastal development, and deep-sea mining can also have substantial impacts on carbon fluxes and stocks. Predicting future changes in carbon fluxes and storage is therefore a considerable challenge, requiring the establishment of an efficient observational network to accurately constrain these dynamics. Moreover, monitoring the changes and variability is critical to delivering accurate carbon budgets to the parties to the UNFCCC, and to providing a comprehensive global understanding of carbon stocks and fluxes. This understanding assists parties in formulating mitigation targets consistent with the temperature goals of the Paris Agreement. Similar concerns have been raised for terrestrial ecosystems, highlighting the need for improved monitoring of natural and anthropogenic carbon fluxes [Gidden et al., 2023, Nabuurs et al., 2023].
Recent improvements in observational capabilities and developments in machine-learning based interpolation methods have facilitated the generation of global gap-filled, high-resolution data products of oceanic pCO2 and ocean air–sea CO2 fluxes [Fay et al., 2021]. These developments have improved our understanding of long-term trends in coastal air–sea carbon fluxes [Roobaert et al., 2024] and enabled model-data combination to estimate global coastal fluxes [Resplandy et al., 2024]. However, despite this progress, the quantification of coastal CO2 flux trends from observations remains severely constrained by limited spatial coverage and/or relatively short time series duration, while large discrepancies between data and models persist [Hauck et al., 2023a, Resplandy et al., 2024]. Additionally, the anthropogenic component of the air–sea carbon flux cannot be directly observed. While local estimates of DICant are possible (e.g. though the ΔC∗ method [Gruber et al., 1996] or the transient time distribution method [Hall et al., 2002], data-based methods can only estimate global anthropogenic carbon uptake. Furthermore, model estimates generally do not account for anthropogenic impacts unrelated to atmospheric CO2 and climate change.
In the context of reporting on potential CDR projects, establishing a baseline is critical as it is the starting point against which emission reductions or additional sinks are measured. Accurate monitoring helps avoid errors in establishing this baseline and ensures that it reflects carbon fluxes and storage in the absence of human intervention [Ho et al., 2023]. Accurate monitoring of carbon fluxes will allow for better accounting of managed carbon fluxes and avoiding methodological errors in setting baseline emissions in reporting of carbon projects, within NDCs or elsewhere [Cooley et al., 2023]. In addition, a poorly defined baseline can lead to inaccurate accounting. This can be particularly detrimental if emission reductions are overestimated, creating a discrepancy between the remaining emissions allowed to meet climate change targets and the actual remaining emissions.
Declaration of interests
The authors do not work for, advise, own shares in, or receive funds from any organization that could benefit from this article, and have declared no affiliations other than their research organizations.
Dedication
The manuscript was written through contributions of all authors. All authors have given approval to the final version of the manuscript.