


 CC-BY 4.0
1. Introduction
The Comoros archipelago is composed of four volcanic islands displaying contrasted morphologies from west to east, with the high-standing, uneroded relief of Grande Comore and the presently active Karthala volcano to the west, to the low-lying island of Mayotte surrounded by a vast lagoon to the east (Figure 1A). This morphology, typical of the evolution of volcanoes along a hot-spot track [Darwin 1842; Peterson and Moore 1987], combined with the increase of the estimated age of volcanism from west to east [Emerick and Duncan 1982] and the isotopic signature of the lavas emitted at Karthala [Class et al. 1998, 2005], have been the main arguments for proposing that the volcanism of the Comoros archipelago could result from a fixed mantle plume [Emerick and Duncan 1982] rising beneath a moving tectonic plate, as initially proposed by Morgan [1971]. However, the trend of the volcanic track is not aligned with the recent plate motion vector [Müller et al. 1993; Morgan and Morgan 2007]. In addition, the recent growth of a submarine volcano east of Mayotte since July 2018 [Cesca et al. 2020; Lemoine et al. 2020; Feuillet et al. 2021], at the opposite end of the present-day active Karthala volcano, can hardly be explained with a simple model of punctual and vertically rising mantle plume piercing a moving lithosphere. It has also been recently shown that abundant Holocene eruptions occurred in Anjouan Island, 130 km east of the putative hotspot expression [Quidelleur et al. 2022]. Altogether, these elements bring credit to tectonic interpretations which propose that the whole archipelago either results from the reactivation of lithospheric transform zones [Nougier et al. 1986], or grew at the right-lateral transform boundary between the Somali and Lwandle plates [Famin et al. 2020; Michon et al. 2022].
(A) The Comoros archipelago located north of the Mozambique channel between Africa and Madagascar. (B) Location of the MAYO seismic station in Mayotte, the sampling point of the Rayleigh wave dispersion data, the seismicity catalogue from 2019-02-25 to 2020-05-10 available for the Mayotte seismo-volcanic crisis [from Saurel et al. 2022] and the new submarine volcano forming the Mayotte volcanic zone [Feuillet et al. 2021]. Bathymetric data from SHOM (2016) around Mayotte and GMRT elsewhere [GMRT version 3.9; Ryan et al. 2009]. Elevation data from the ASTER Global Digital Elevation Model (GDEM, 2019).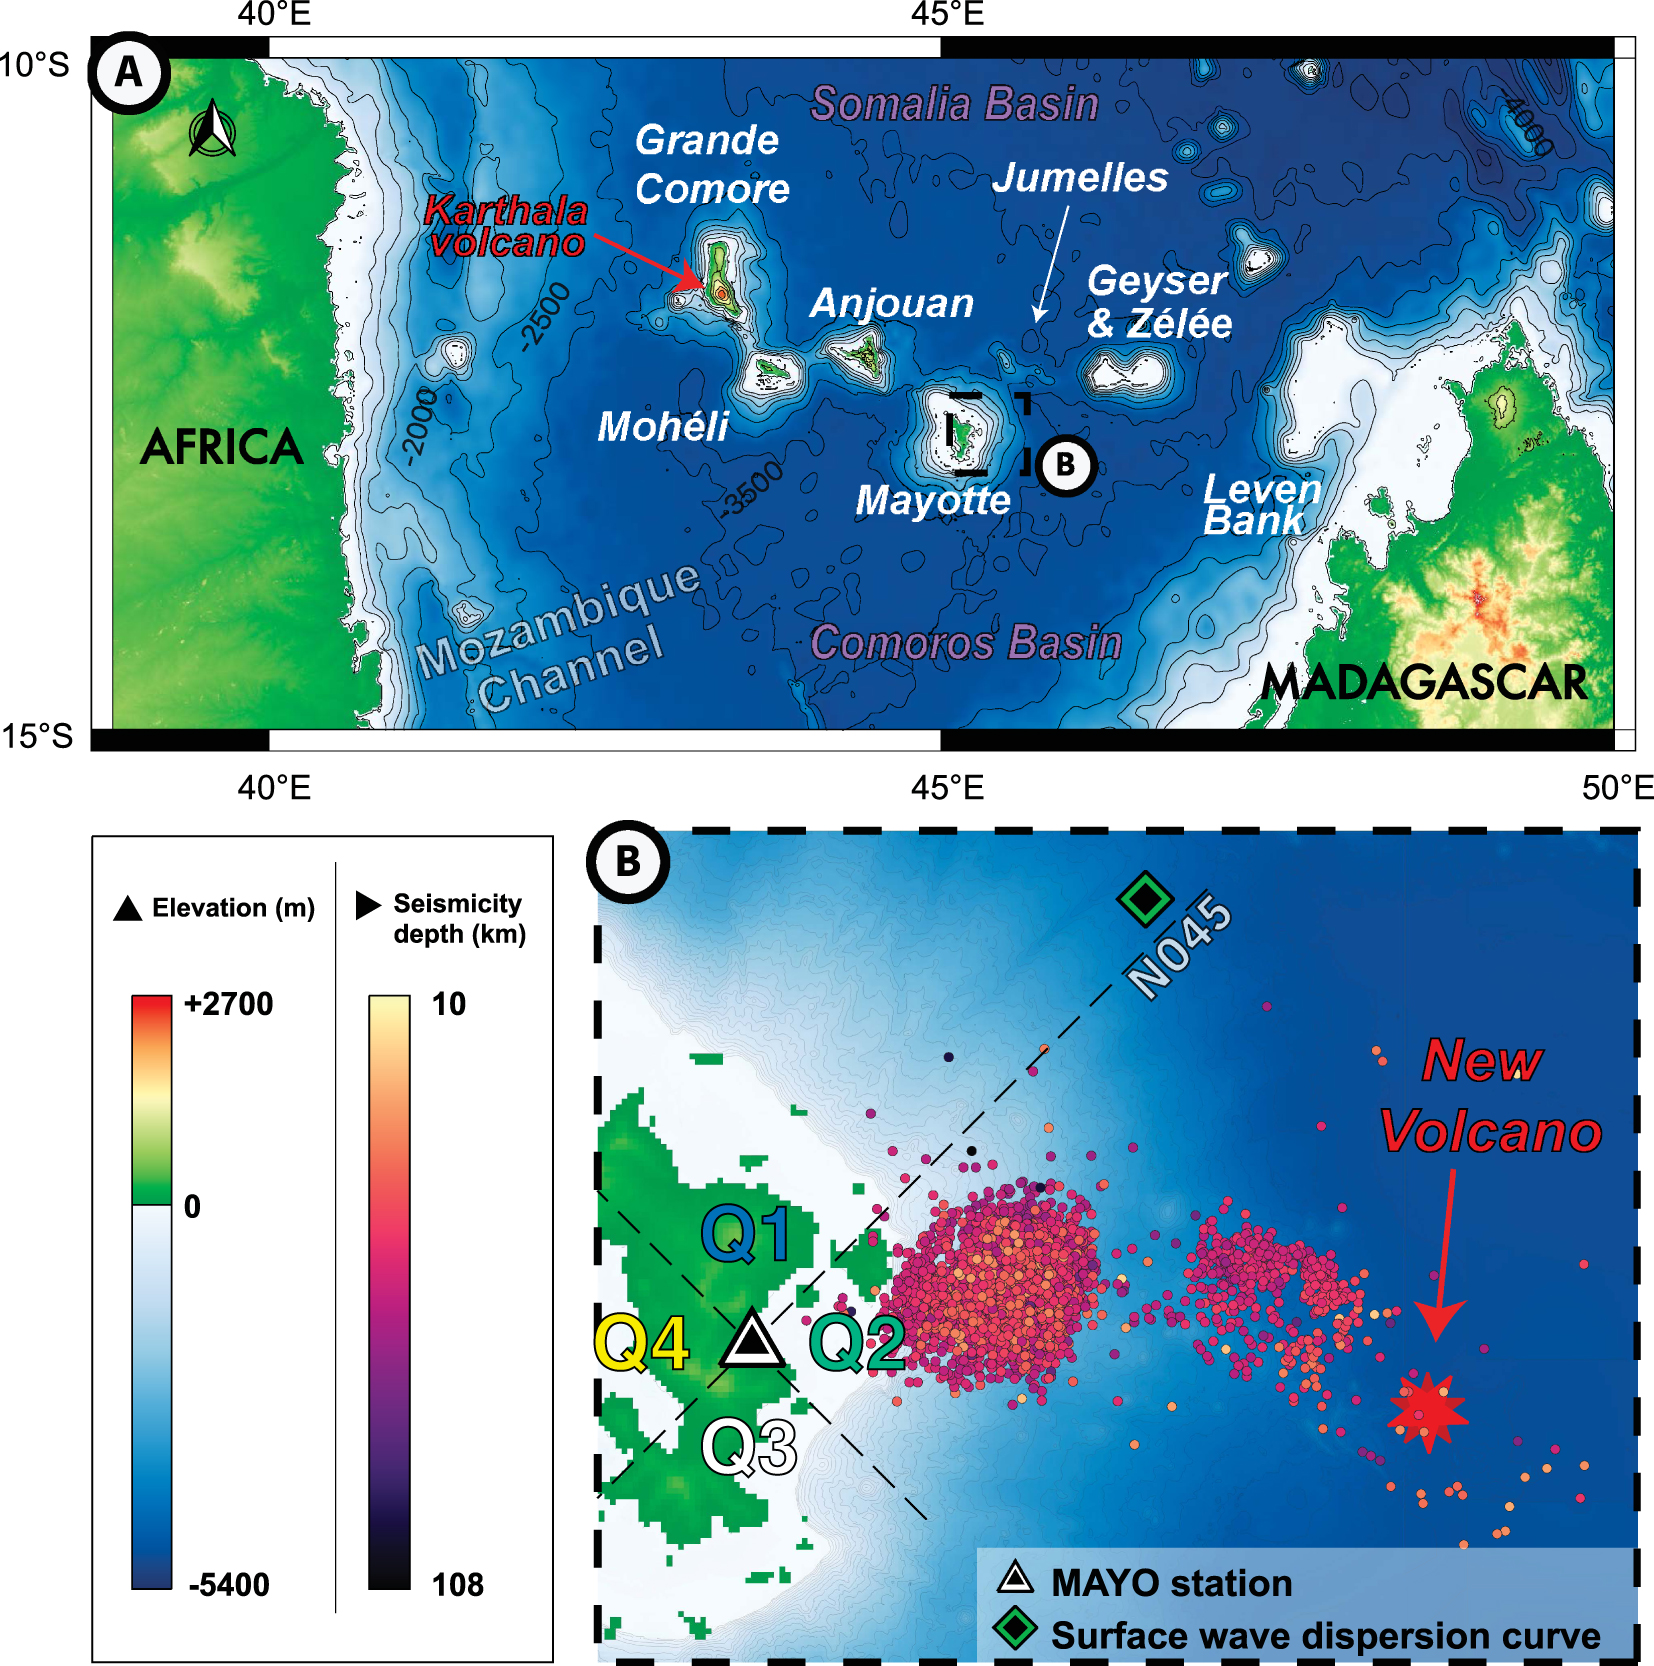
The seismo-volcanic crisis east of Mayotte initiated in May 2018, preceded the onset of the island eastward subsidence and was associated with a complex seismicity [Cesca et al. 2020; Lemoine et al. 2020; Feuillet et al. 2021]. The dominant strike-slip earthquake focal mechanisms of the largest events agree well with a control of the maximum NW–SE oriented horizontal stress in the magma intrusion process [Famin et al. 2020; Lemoine et al. 2020]. Furthermore, the large number of seismic events located 5 to 40 km east of the island at a depth of 20 to 45 km below sea level (REVOSIMA report; 2021), concentrated in three independent clusters, has been recently interpreted as evidencing a poly-stage magma ascent through successive lithospheric magma reservoirs [Berthod et al. 2021a] and a diking episode before the eruption [Cesca et al. 2020; Lemoine et al. 2020; Feuillet et al. 2021]. Petrological and geochemical analyses of erupted lavas indicate that the magmas of Mayotte would be fed by mantle partial melting in the spinel/garnet to garnet lherzolitic sources [Pelleter et al. 2014; Berthod et al. 2021a].
Seismological and petrological studies allowed to greatly improve our knowledge of the magmatic plumbing system above 50 km depth [Cesca et al. 2020; Lemoine et al. 2020; Saurel et al. 2021, 2022; Berthod et al. 2021a, b; Lavayssière et al. 2022]. Moreover, SKS splitting revealed that this plumbing system is developed in a strongly anisotropic lithosphere [Scholz et al. 2018]. Yet, the geometry of the plumbing system below 50 km, the role of the lithospheric interfaces in the location of the magma reservoirs, and the potential impact of the E–W lithospheric anisotropy in the magma migration are still poorly constrained. In this study, we analyze teleseismic receiver functions (RFs) and invert them jointly with the Rayleigh wave dispersion data. This allows us to provide new constraints on the lithospheric and asthenospheric structures down to 100 km and on crustal and mantle shear wave velocities beneath the eruptive zone. The rationale behind such a joint inversion of these two independent geophysical datasets is that they help together constraining both the interfaces’ depths and absolute velocities. Armed with both types of data, we probe the structure of the lithosphere beneath Mayotte and show the occurrence of low-velocity zones (LVZ) that may correspond to magma ponding zones. We also provide a new absolute velocity model that may significantly improve the localization of seismic events related to the seismo-volcanic crisis.
2. Receiver functions and surface wave dispersion data
For more than 40 years, teleseismic P-coda RFs have become a major tool for exploring the internal structure of the Earth beneath seismic stations in various environments [e.g., Langston 1977; Ammon 1991; Zhu and Kanamori 2000; Vergne et al. 2002; Zheng et al. 2005; Leahy et al. 2010; Schlaphorst et al. 2018]. This method seeks to enhance Ps conversions and reverberations associated with crustal and mantle structures beneath the receiver by removing sensor-related, source-related, and mantle-path effects.
In this study, we computed RFs at the MAYO temporary broad-band station deployed on Mayotte Island (https://doi.org/10.15778/RESIF.YV2011, network code: YV, Lat: 12.8456° S; Long: 45.1868° E) during the RHUM-RUM experiment [Barruol and Sigloch 2013]. This station has recorded 2 years and 10 months of seismic data (2011-04 to 2014-01). The MAYO station Probabilistic Power Spectral Densities (PPSDs) showing the frequency of occurrence of different noise level is available online (https://seismology.resif.fr/networks/#/YV__2011/MAYO/). To calculate RFs, we selected seismic waveforms of events occurring at epicentral distance from the station between 25° and 90°, with a magnitude greater than 5.5 and a signal-to-noise ratio greater than 2. These selection criteria are considered as standards [e.g., Fontaine et al. 2015; Lamarque et al. 2015]. The P-arrivals were manually picked on waveforms, and the seismic signals were cut 5 s before and 30 s after the P-wave arrival time. A low-pass filter of ∼1.2 Hz was applied to reduce the contributions of ambient noise and crustal heterogeneities to the signal recording. The iterative time-domain deconvolution method of Ligorría and Ammon [1999] was used to calculate the radial RFs (RRFs; Figure 2). The RRFs were grouped into 90° back-azimuth quadrants (Q1 to Q4) centered on the E–W and N–S axes [e.g., Tkalčić et al. 2011] to evaluate the azimuthal variations in the lithospheric properties (Figure 2).
Radial (left) and transverse (right) receiver functions (RFs) grouped from their back-azimuths at the same scale. The teleseismic events used to perform RFs are indicated by stars with the same color scale as back-azimuthal Q1 and Q2 quadrants. Quadrants correspond to 90° sectors bounded by NW–SE and SW-NE axes. Q1 and Q2 correspond to the north and east sectors respectively. The P-wave direct arrival time is picked at the origin time. Positive and negative phases are shown in dark and light grey, respectively. Blue, green and orange ticks indicate arrival times of Pms1, Pcs and Pms phases (see text for details).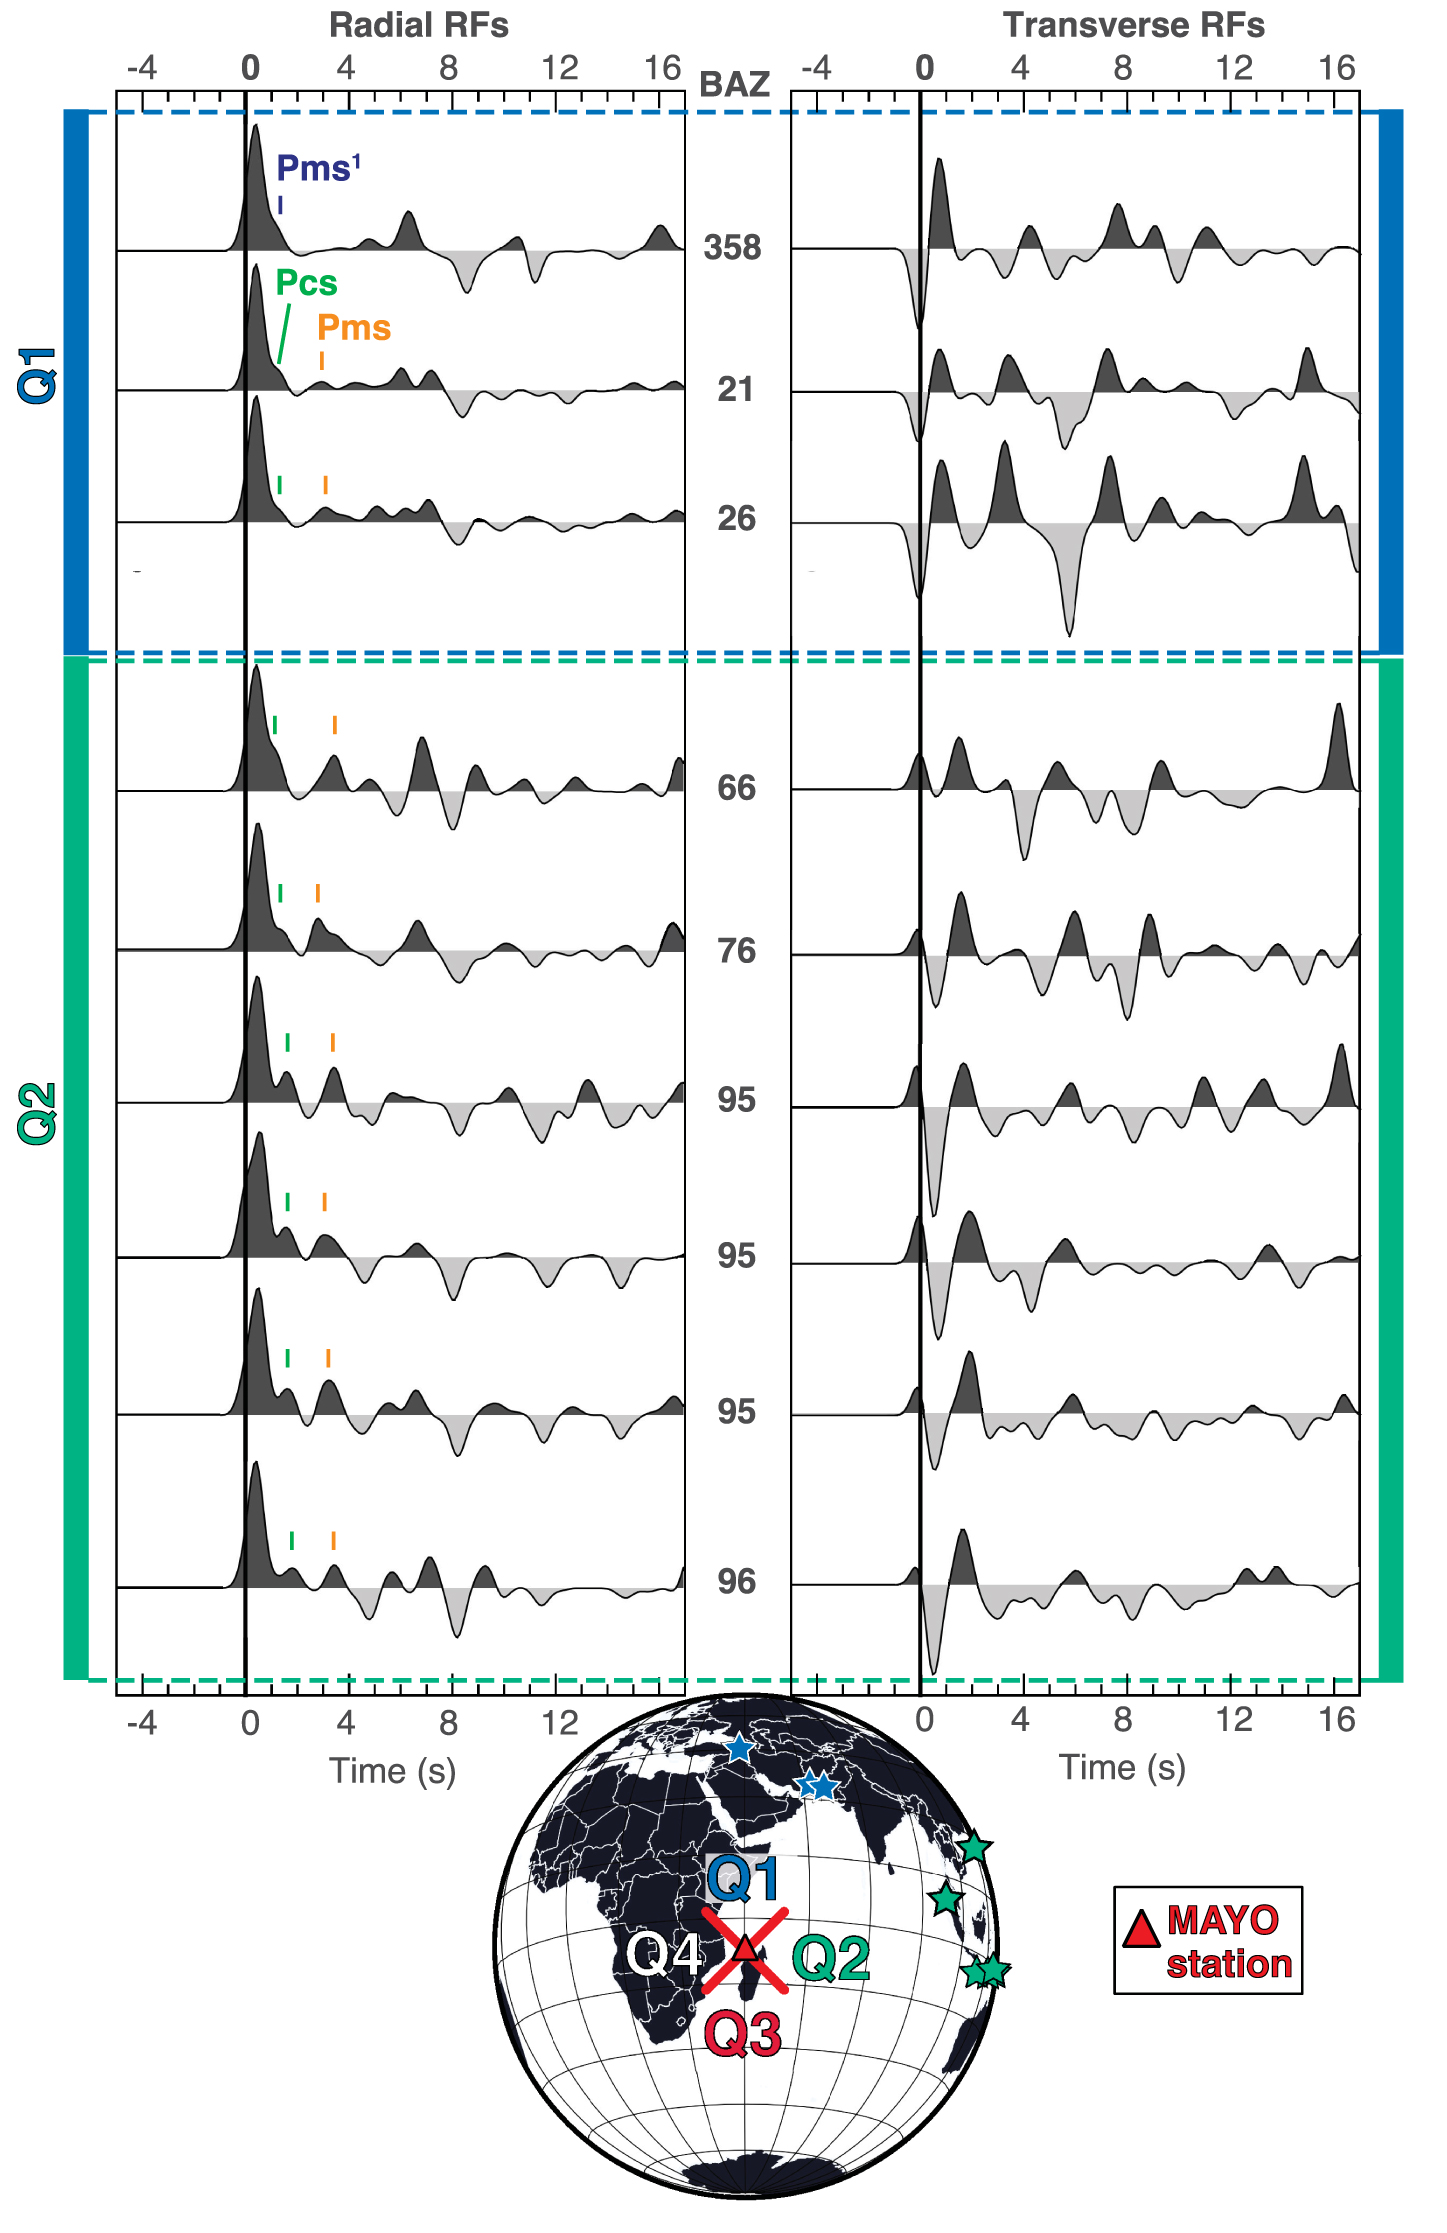
The RFs were inverted using the Neighborhood Algorithm (NA) inversion method [Sambridge 1999] to compute an ensemble of solutions of S-wave velocities profiles for different ray parameters (p) within the range of ±0.006 s⋅km−1 of the median ray parameter [Figure 3; see selection and stacking procedure in Fontaine et al. 2013a; Dofal et al. 2021]. Note that this method gives convergent results with reflection [Fontaine et al. 2013b] and refraction profiles or transdimensional hierarchical Bayesian approach [Fontaine et al. 2015]. We used data from the different quadrants for the stacking procedure in order to image the potential presence of lithospheric anisotropies or dipping interfaces [e.g., Savage 1998]. During the RFs inversion procedure, synthetics RFs were generated for 45,200 models using the Thomson–Haskell matrix method [Thomson 1950; Haskell 1990]. A calculation of the 𝜒2 misfit function was applied to verify the coherency of the synthetics with the data. This misfit function, a L2-norm, is defined as the sum of the squares of the difference between the observed amplitude of the radial RF and the amplitude of the synthetic radial RF from a 6-layer model. Fontaine et al. [2013b] showed an example of the misfit function obtained using the NA (see their Figure 3A). An a priori parametrization was used to generate the S-wave velocity structure. It corresponds to a 6 layers model, each characterized by 4 parameters: VP∕VS ratio, thickness of the layer, S-wave velocities at the top and at the base of the layer. Full details of the a priori parameter space bounds can be found in Supplementary Material A. The velocity interfaces were determined from the S-wave velocities profiles, considering the 1000 best-fitting models (black curve in Figure 3).
Results of the NA inversion of the RF in the two quadrants (Q1 and Q2) of the MAYO seismic station. (A) Comparison between the stacked measured radial RFs and the mean RF determined from the best 1000 models resulting from the inversion with the ±1 standard deviation limits around the average. Orange and green vertical lines account for the Pms and Pcs phases. (B) Density plot of the best 1000 velocity-depth models over the 45,200 models calculated for each quadrant. The color scale is logarithmically proportional to the number of models (Nm). The black line shows the average of the 1000 best models. White plain and dotted arrows indicate clear and gentle variations of velocity gradients in the S-wave velocity (Vs) profiles, respectively.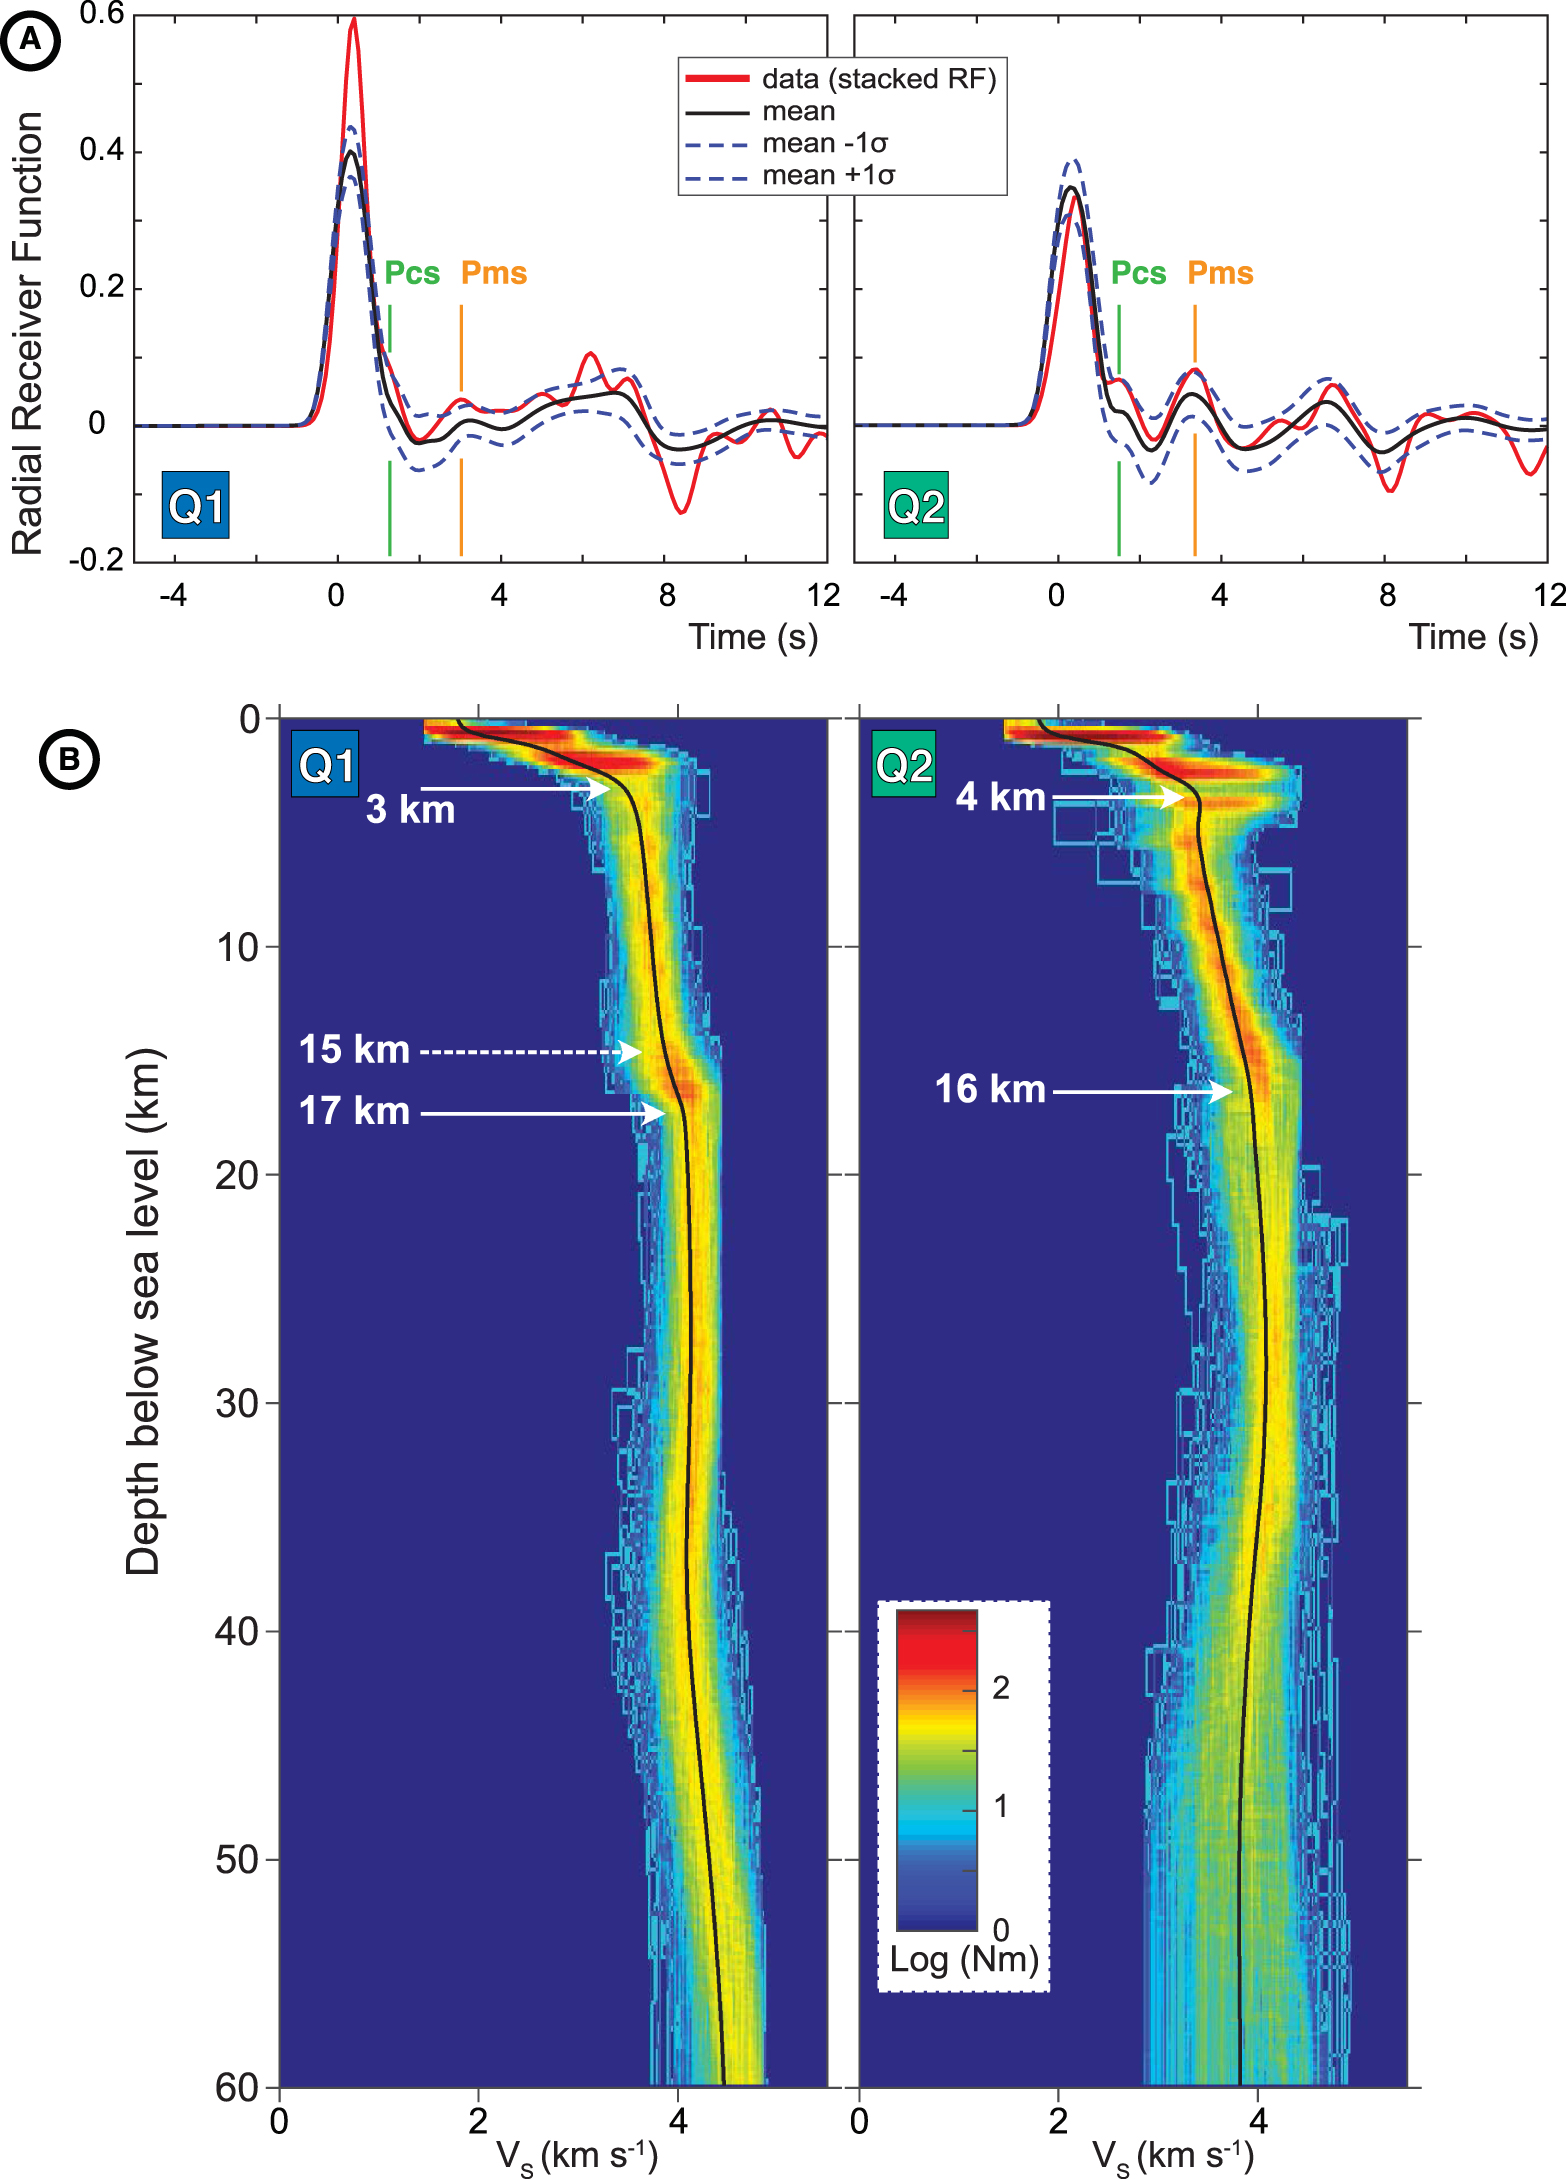
We also extracted the Rayleigh wave dispersion curve from the regional (1° × 1° grid) group velocity model of Mazzullo et al. [2017] at the closest point to the station (12.5° S; 45.5° E). In the tomography model, the lithosphere is densely sampled with 170 seismic rays at the point where the dispersion data were extracted. This dispersion curve has periods ranging from 16 s to 100 s, allowing to constrain the lithospheric structures. The joint inversion enables us to take advantage of the constraints provided by two different datasets on complementary parameters. On the one hand, the receiver function inversion allows constraining the S-wave velocity contrasts at the sampled interfaces by a set of ascending seismic rays. It gives relative velocities with depth. On the other hand, surface waves provide absolute velocity information as a function of depth without being sensitive to interfaces [e.g., Özalaybey et al. 1997; Julià et al. 2000; Tkalčić et al. 2006]. Recent developments in inversion methods include the influence of noise in the inversion by treating it as a free parameter, such as the initial number of layers [e.g., Bodin et al. 2012 for the transdimensional hierarchical Bayesian inversion method; TB]. Therefore, TB method allows greater resolution of the velocity variation because models with a larger number of layers are recovered from the inversion. However, at the time of the study, the main objective is to determine the most significant lithospheric structures in this region where this information is not yet available. Therefore, we used the linear joint inversion method of Herrmann and Ammon [2002] and applied it to the RRFs and a Rayleigh wave dispersion curve. The information carried by each dataset is equally used during the inversion.
The stability of our inversion results was tested by performing inversions with several initial models. The used models are derived from PREM [Dziewoński and Anderson 1981], ak135 [Kennett et al. 1995], HSak135 (halfspace starting model), and SURF (surface wave inversion based on halfspace starting model) and adapted in depth to the previous velocity model obtained by Dofal et al. [2021]. The uppermost mantle velocity of ak135 (i.e., VS of 4.48 km⋅s−1) was fixed for the halfspace-starting model. The thickness of the two uppermost layers of the initial models was fixed at 1 and 2 km, respectively, while the thicknesses of the following layers were 2.5 km down to a depth of 100 km. We also tested the stability of the inversions by varying the layer thickness of the initial models (Supplementary Material B). During the inversion, a smoothing parameter was defined in order to prevent important velocity contrasts for two consecutive layers. This parameter was set at 0.8 for the first 30 km [i.e., in the crust and magmatic underplating; Dofal et al. 2021]. The influence of the smoothing parameter is limited as presented in Supplementary Material C.
In the NA RF inversions, we cut the traces 12 s after the direct P wave arrival time, whereas the signal was cut after 17 s for the joint inversions. For both inversions, the RF started at −5 s.
As for any geophysical inversion, the method used has its own limitations, in particular related to the noise not accounted for in the inversion and assumed to be zero, so the complexity of the final model is not driven by the data only but is also influenced by the subjective choice of the parameterization. Another limitation is induced by the small number of events, the poor back-azimuthal coverage and the possible influence of anisotropies or tilted reflectors, known as theory errors. Indeed, we were able to use only a limited number of RFs used in our study due to a thorough selection that increases the robustness of our inversions. Yet, the consistency of the RFs in each quadrant suggests a relative structure homogeneity in these back-azimuthal zones. Overall, if first order information may provide well-constrained results, these limitations imply that our second order interpretations should be taken as hypothetical and should be confirmed by further investigations.
3. Results
From the 447 events satisfying the selected criteria exposed before (epicentral distance, magnitude), we retain only 9 of them to calculate 9 individual RFs (data with a signal-to-noise ratio ⩾2). The location of Mayotte relative to the global seismogenic zones strongly limits the number of teleseismic events in the usable epicentral distance (list of selected events available in Supplementary Material D). Most of them occur within the northern and eastern sectors only (3 and 6 RFs in Q1 and Q2, respectively; Figure 2).
Most of the RRFs (8 out of 9) show two positive amplitude peaks at about 1 and 3 s, labeled Pcs and Pms (Figure 2). The Pcs phase denotes the phase generated at the crust-to-magmatic underplating boundary [Leahy et al. 2010]. The Pms phase results from the conversion at the crust-to-mantle boundary and here it is at the magmatic underplating-to-lithosphere mantle interface [e.g., Leahy et al. 2010; Dofal et al. 2021]. On the 358° back-azimuth RF, the first phase following the P-direct cannot be the Pcs phase that corresponds to the crust-to-magmatic underplating interface because no clear phase appears at 3 s (the phase corresponding to the bottom of magmatic underplating). Therefore, the 1 s phase called Pms1 on the 358° RF could not be generated at the same geological structure that generated the 1 s phase (Pcs) on eight other RFs (Figure 2). Other explanations include dipping interfaces or anisotropy. Nevertheless, with only one RF, it is not reliable to look at the velocity structure at this back-azimuth. Another difference between RFs from both quadrants is that RRFs from Q2 show a negative phase that do not appear on RRFs of Q1 and could be related to an anisotropic structure within the lithosphere. Finally, we notice that the main difference between the RFs recorded in the two quadrants stands in the polarity of the first peak of the Transverse RFs (TRFs), which is negative and positive in Q1 and Q2, respectively. The origin of this polarity inversion will be discussed in the next section.
Two of the six RFs falling in Q2 do not match the ray parameter criteria (RFs characterized by 76 and 96° of back-azimuth) and are not considered for computing the stacked RF of Q2 for the inversion with the neighborhood algorithm (NA). The ensemble of RFs (i.e., 3 and 4 RFs for Q1 and Q2, respectively) and the stacked RFs obtained for the NA shows a slight shift of the P-direct phase from the 0 time. This may be related to an important velocity contrast between the first two layers [e.g., Zelt and Ellis 1999]. This observation is confirmed by the ensemble of best data-fitting S-wave velocity profiles that shows a sharp velocity hinge at 3 and 4 km beneath the station for Q1 and Q2, respectively (Figure 3B). RFs also reveal two positive peaks that follow the main P phase arrival (Figure 3A). The first peak arrives at around 1.5 s while the second one is recorded at 3–3.5 s. The former is interpreted as the Pcs phase, and the latter may correspond to the Pms phase. The modeled RFs describing the average of the 1000 best velocity models for Q1 and Q2 reproduce well the first 7 s after the P-direct phase but fail at fitting the high negative peak at ∼8 s (Figure 3A). Beneath the 3–4 km depth boundary, the S-wave velocity profiles present either a constant, low gradient down to 15 km depth in Q1 or a slight velocity decrease until 6 km depth followed by a constant, low gradient down to 16 km depth in Q2. Below these depths (16–17 km), the S-wave velocity slightly increases at a constant rate in both quadrants until 30–35 km depth, where a weakly pronounced LVZ seems to be initiated (Figure 3B). The geometry of this LVZ is poorly constrained in Q2, as demonstrated by the larger scattering of the velocity-depth models than in Q1. To deal with this limitation, we take advantage of the sensitivity of surface wave dispersion data to investigate the geometry of the lithosphere down to 100 km depth and to better determine the evolution of the S-wave velocity with depth (Figure 4).
Joint RF and Rayleigh dispersion curves inversion results for Q1 and Q2 quadrants (A and B). Left, individual absolute S-wave velocity profiles obtained for four starting models (detailed in the legend) and the corresponding mean model, in red. Upper right panels, plot of modeled dispersion curves, and the data. Bottom right panels, plots of modeled and observed RFs. Colors correspond to the starting models used to obtain modeled RFs and dispersion curves. L1, L2, L3 and L4 refers to geological layers that are discussed in the text.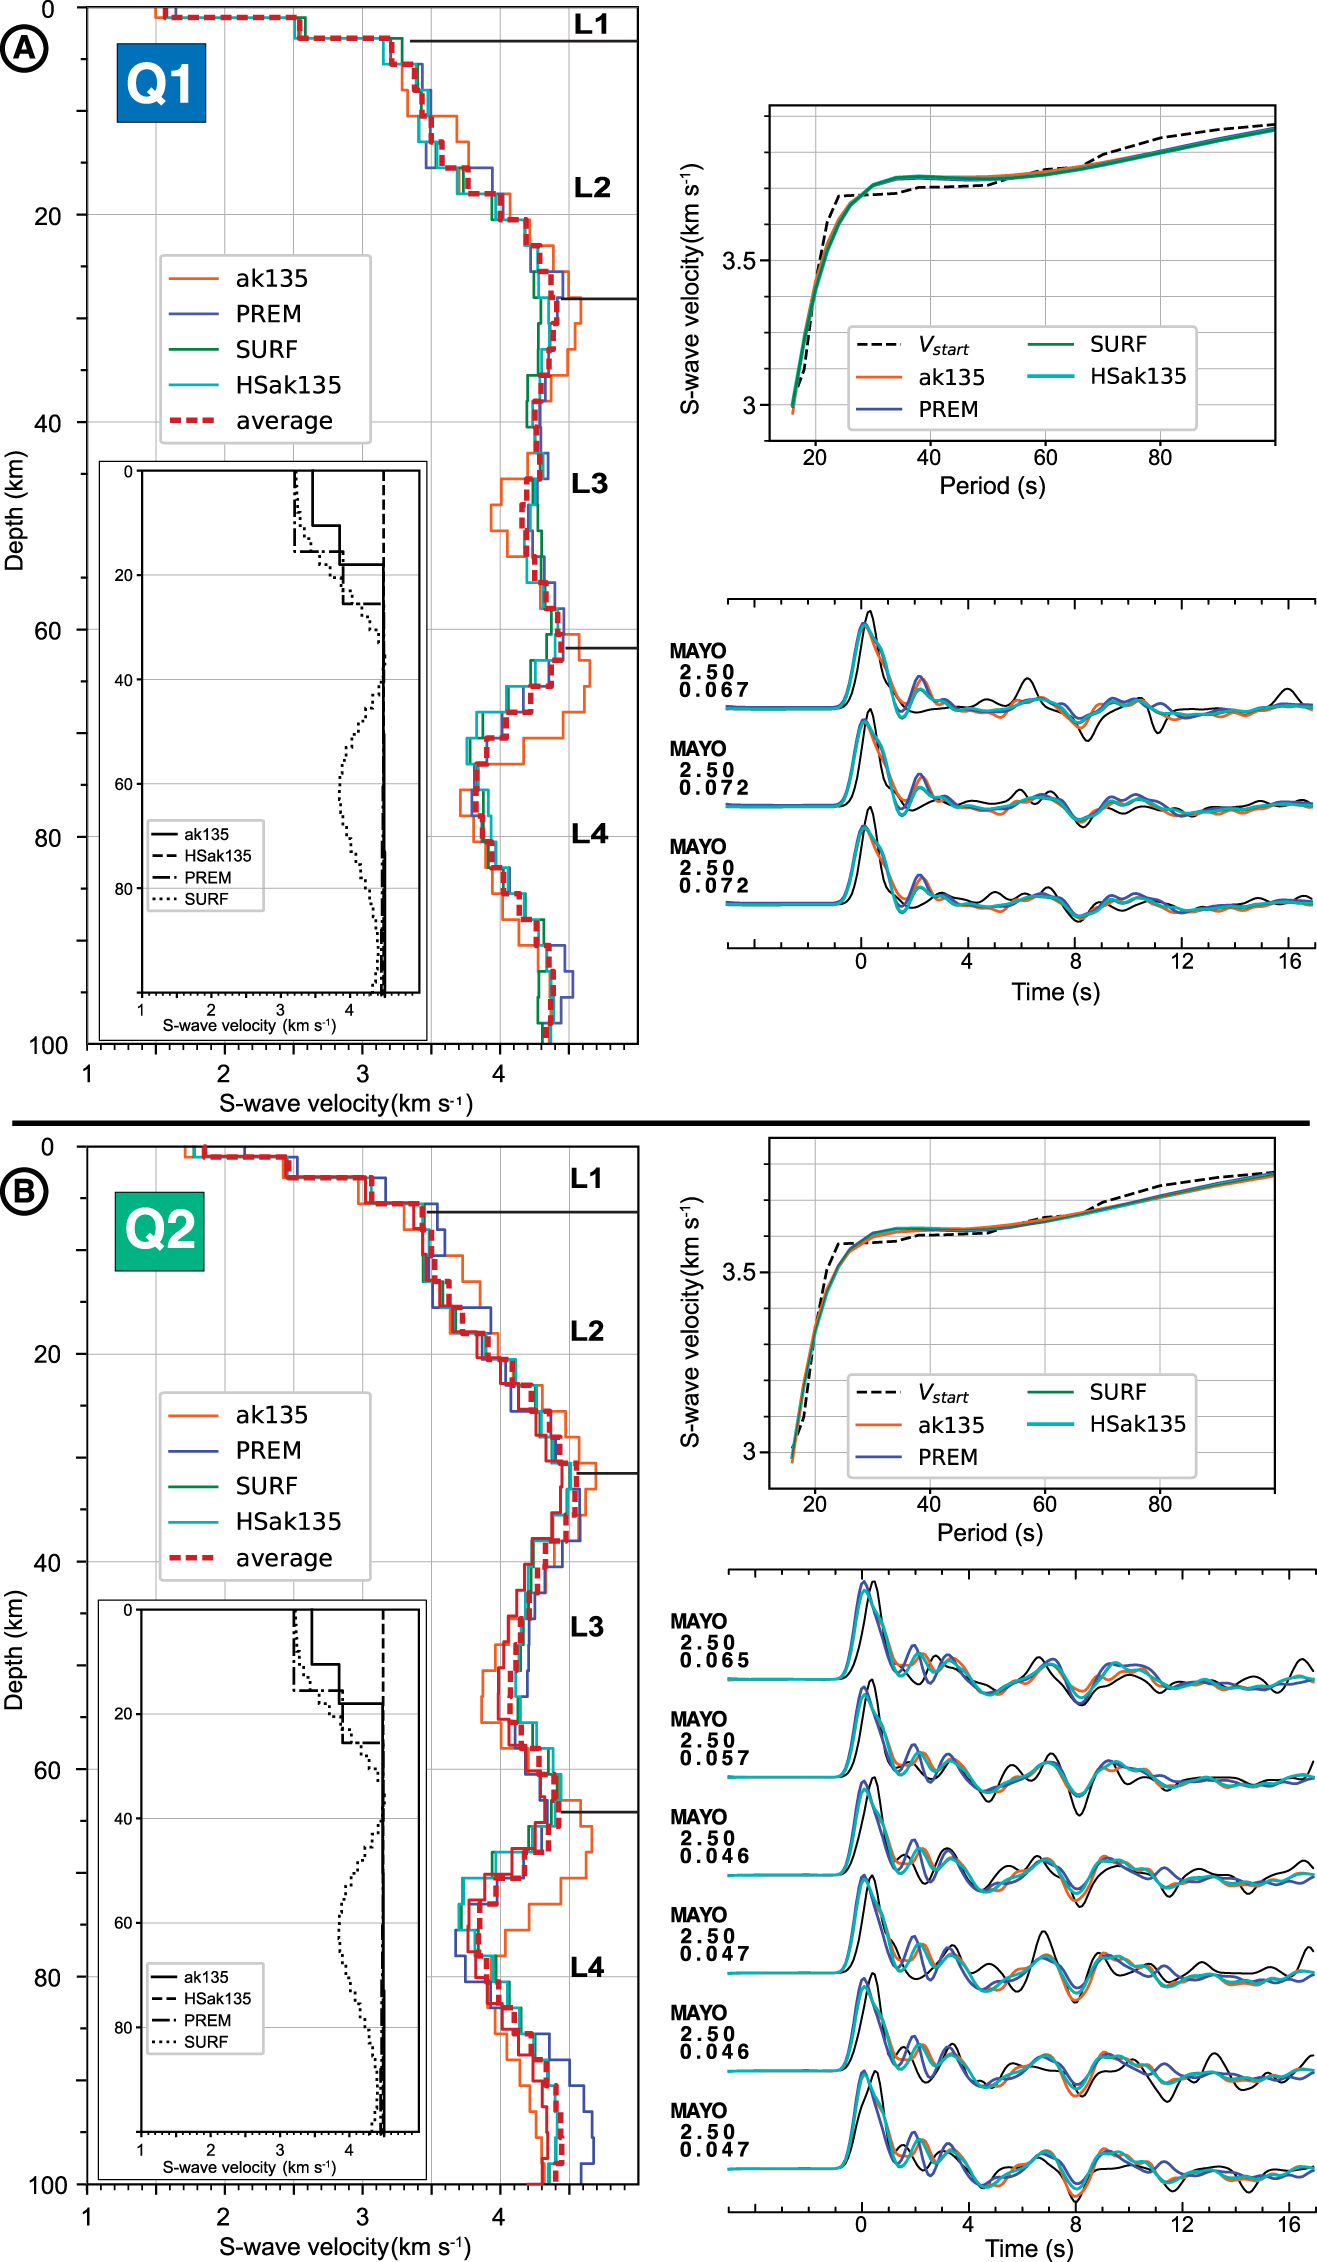
We therefore perform a joint inversion of RFs and surface wave dispersion data in both quadrants. To perform the joint inversion of RFs and surface wave dispersion data, we use the four initial models described in Section 2 as input (Figure 4). This inversion strategy is applied to the sets of RFs recorded for each quadrant (3 and 6 RFs for Q1 and Q2, respectively). The full set of models generated for these inversions is available in Supplementary Material E. The resulting velocity profiles for each quadrant and for the four selected models are presented in Figure 4. It shows first a general consistency between the profiles computed with the different models as they all present a similar overall evolution of the S-wave velocity with depth. The slight differences between the computed profiles for each quadrant stand in the occurrence of discrete steps related to velocity changes in the ak135 and PREM models and in higher and lower velocity values in the profile with ak135 model than with the others. Therefore, we consider an average of the four profiles to minimize the effect of each individual a priori model and to describe the structure of the lithosphere in quadrants Q1 and Q2 (Figure 4).
The average velocity models for both quadrants show, at first glance, a similar overall evolution characterized by (1) S-velocities of 1.6 and 1.9 km⋅s−1 near the surface increasing rapidly to 3.5 km⋅s−1 at around 4–6 km depth, (2) a change in velocity gradient with a slow velocity increase followed by a rapid one until around 4.5 km⋅s−1 at 28–30 km depth, (3) a decrease of the velocity to minimum values reached at 49 and 54 km depth in Q1 and Q2, respectively, and (4) a second LVZ with slower velocities than in the shallow one from 62–64 to 92–93 km depth (Figure 4).
The shallowest layer L1, 4, and 6 km in thickness in Q1 and Q2, respectively, is characterized by the highest velocity gradient (0.25–0.4 km⋅s−1⋅km−1; Table 1). In both Q1 and Q2, the velocity continues to increase in the layer L2 down to its base at 29–31 km depth (Figure 4). Below L2, the velocity decreases, forming a LVZ visible in both sectors that we define as L3 (Figure 4). This low-velocity layer is marked by a continuous (in Q2) and discontinuous (in Q1) velocity decrease down to 54 and 49 km, respectively. The velocity drop in this LVZ is larger in Q2 than in Q1 (−11.6 and −6.3% of the velocity measured at its top; Table 1). The base of L3 lies at 62–64 km depth (Figure 4; Table 1). Below the L3 layer, we define L4, which is mainly made by a second large LVZ visible on the velocity profiles. The velocity drops of around 12.5% at 75 km depth. The base of this LVZ is around 92 km depth in both quadrants.
Summary of the lithospheric structure in Q1 and Q2 determined from the joint inversion of receiver functions and Rayleigh wave dispersion data
| Layers | Layer basal depth | Layer thickness | Velocity (km⋅s−1) at the base of the layer | Average velocity gradient (km⋅s−1⋅km−1) | Minimum velocity value (If LVZ) | LVZ velocity decrease (%) | |
|---|---|---|---|---|---|---|---|
| Q1 | L1 | 4 | 4 | 3.2 | 0.40 | ||
| L2 | 29 | 25 | 4.4 | 0.05 | |||
| L3 | 62 | 33 | 4.45 | LVZ | 4.17 | −6.3 | |
| L4 | 4.3 | LVZ | 3.8 | −11.6 | |||
| Q2 | L1 | 6 | 6 | 3.4 | 0.25 | ||
| L2 | 31 | 25 | 4.55 | 0.05 | |||
| L3 | 64 | 33 | 4.4 | LVZ | 4.05 | ||
| L4 | 93 | 19 | 4.4 | LVZ | 3.8 | −13.6 |
Thus, the joint inversion of receiver functions and Rayleigh wave dispersion data suggests a similar first-order structure of the lithosphere in Q1 and Q2. L1 and L2 are characterized by positive gradients, whereas L3 and L4 represent two successive LVZ (Figure 4). Interestingly, the main difference between Q1 and Q2 is the amplitude and the size of the LVZ in L3, which is broader and slower in the quadrant sampling the eastern sector (Q2) than in the northern one (Q1).
4. Discussion
4.1. Lithospheric anisotropy/dipping interface
At first glance, the lithosphere sampled by rays arriving from the northern and eastern azimuths presents a similar overall geometry. Despite a sparse back-azimuthal coverage (e.g., no RFs in Q3 and Q4) impeding unambiguous interpretation [e.g., Owens and Crosson 1988; Cassidy 1992], several lines of evidence indicate the occurrence of heterogeneities and anisotropic structures within the lithosphere beneath Mayotte. The first evidence is the non-zero TRFs [e.g., Cassidy 1992; Bertrand and Deschamps 2000] showing clear peaks of opposite polarities in Q1 and Q2 (Figure 2). Such a pattern may indicate the presence of anisotropic structures within a multi-layered lithosphere [e.g., Nagaya et al. 2008; Bar et al. 2019]. Although the anisotropy cannot be precisely characterized from RFs due to the little number of observations, the azimuthal seismic anisotropy obtained at MAYO station from surface and body waves suggests a complex anisotropy down to 100–150 km depth with two fast directions trending E–W and NE–SW [Mazzullo et al. 2017; Scholz et al. 2018]. The E–W trend was proposed to be caused by ridge-parallel mantle flow inherited from the N–S opening of the Somali basin, while the NE–SW one still remains enigmatic [Scholz et al. 2018]. The occurrence of dipping interfaces may also contribute to the inversion of peak polarity on the TRFs between Q1 and Q2, and to the occurrence of high amplitude TRFs [e.g., Savage 1998]. As for the anisotropy, due to the sparsity of data, the dips of the interfaces cannot be well constrained and are considered by simplicity as horizontal. Note that the uncertainty on the Moho depth increases with the increase of dip angle. Synthetic analysis shows that a dip angle >4° introduces an error on the depth estimation of the interface >2 km [Zhang et al. 2009].
Finally, all RRFs but one show two peaks arriving at around 1.5 s and 3–3.5 s (Figure 2). Only the 358° back-azimuth RF has a single positive phase after the P-direct phase at almost 1 s, suggesting a distinct structure. This feature, together with the arrival times of the direct P phase on the set of RRFs could originate from multi-scale heterogeneities within the lithosphere.
4.2. Structure of the lithosphere
Our combined analysis of receiver functions and the joint inversion of receiver function and Rayleigh wave dispersion data allows us to characterize the lithospheric structure and to further constrain the geometry proposed from receiver functions and H-𝜅 staking [Dofal et al. 2021]. In a previous analysis, we imaged three interfaces (at 4, 17 and 26–27 km depth), which we interpreted as the base of the Mayotte volcanic edifice, the interface (called “old Moho”) between a thinned continental crust and an underlying magma underplating, and the base of the magmatic underplating (called “new Moho”), respectively [Dofal et al. 2021]. Our new approach brings additional constraints to this geometry and allows us to discuss possible differences in the lithospheric structure between the northern and eastern quadrants, as supported by variations on radial RFs (Figure 2; see Section 3). Both velocity profiles computed from the NA and the joint inversion identify a shallow interface around 4 km depth (NA inversion: 3 and 4 km depth and joint inversion: 4 and 6 km depth for Q1 and Q2, respectively). Note that the slight differences in depth are in the range of the uncertainty, which is commonly assumed to be around 2 km for the Moho depth [e.g., Fontaine et al. 2015]. Another explanation could be the occurrence of a dipping interface toward Q2, which may explain part of the high energy on the transverse component. Nevertheless, this interface is interpreted as the base of the volcanic edifice of Mayotte Island that is lying 3.5 km below sea level [Audru et al. 2006]. The base of L2, lying at 29–31 km depth, is close to the interface evidenced at 26–27 km depth [Dofal et al. 2021]. Given the range of uncertainty, it is likely that our joint inversion imaged the same interface as the one identified by these authors. Meanwhile, our approach brings more detailed information on the structures located between 4 km and around 29 km depth. Indeed, the S-wave velocity profiles of Figure 4 both show a ramp-like increase with a sub-layer with a moderate velocity gradient between two sub-layers with smaller velocity gradients. The depth of the base of the first sublayer in Q1 and Q2 is located at 14 and 17 km, respectively, and coincides with that of the old Moho proposed in Dofal et al. [2021]. Note that the S-wave velocities determined for the base of this layer (3.5–3.7 km⋅s−1) in Q2 are compatible with the ones proposed for the oceanic crust [3.4–3.6 km⋅s−1; Christensen 1996; Leahy et al. 2010], but also for a bulk continental crust [3.65 km⋅s−1; Christensen 1996]. Thus, our velocity data do not allow to discriminate the oceanic or continental nature of this sub-layer. Its thickness (10–11 km) suggests however, that this unit either corresponds to an abnormally thick oceanic crust, which is regionally 6–7 km thick [Vormann et al. 2020; Dofal et al. 2021], or to a thinned continental crust abandoned during the southern drift of Madagascar [Dofal et al. 2021].
Below the old Moho, velocity gradients are constant until S-wave velocities reach 4.2 to 4.55 km⋅s−1 at the base of L2. Such a velocity range is comparable to that of magmatic underplating [around 4.2 km⋅s−1; Watts et al. 1985; Caress et al. 1995; Leahy et al. 2010], suggesting an endogenous crustal thickening of 14–15 km due to magma crystallization.
Below the new Moho, the L3 layer interpreted as the lithospheric mantle presents a ∼20-km-thick LVZ characterized by minimum S-wave velocities at 49–54 km depth (Table 1; Figure 4). The origin of this LVZ is discussed in the next section. Finally, our data suggest a LAB at 62–64 km depth and a well-expressed LVZ in the upper part of the asthenosphere, with an average drop of 12.5% in shear wave velocities (Table 1). The LAB depth determined in the present paper agrees with the range of depths (50–90 km) proposed by Barruol et al. [2019] for the Comoros archipelago and indicates that the lithosphere is abnormally thin (64 km instead of around 110 km) for a lithosphere dated at around 140 Ma [Coffin and Rabinowitz 1987]. Nonetheless, this value is similar to the lithospheric thickness of Madagascar [60 km; Rakotondraompiana et al. 1999], where the thinning of the lithospheric mantle is thought to result from the emplacement of an asthenospheric thermal anomaly in the Cenozoic [Stephenson et al. 2021].
5. Lithospheric-scale magma transfer
The renewal of volcanic activity east of Mayotte that started in spring 2018 was associated with a major seismic crisis, the events of which allowed to characterize the magma transfer in the upper lithosphere from a first magma reservoir located at 25–35 km depth by Cesca et al. [2020] and at 28 ± 3 km by Lemoine et al. [2020]. The seismicity is concentrated into two deep clusters located east of Mayotte at 20–50 km and 25–50 km depth [Lemoine et al. 2020; Bertil et al. 2021; Saurel et al. 2021]. The analysis of the submarine lavas emitted by the new volcano suggests two additional reservoirs located at 17 ± 6 km and between 37–48 km depth [Berthod et al. 2021a]. Finally, tomographic models computed from both terrestrial and ocean bottom seismometers recently imaged several low S-wave velocity zones interpreted as magma reservoirs located at about 10, 28, and 44 km depth, the deepest one being the largest in size [Foix et al. 2021].
The locations of the seismic clusters, of the magma reservoirs, and of the structures of the lithosphere that we determine from the present RF analysis strongly suggest that magma reservoirs are located at 17 km and 28 km, i.e., at the rheological interfaces between the crust and the underplating (the old Moho), and between the underplating and the lithospheric mantle, respectively (the new Moho, Figure 5). Interestingly, magnetotelluric soundings show the occurrence of two orders of magnitude of resistivity drop at 15 km depth interpreted as the presence of partial melt [Darnet et al. 2020]. The rheological effect of successive lithological layers is known to control the progressive growth of magma reservoirs by incremental sill injections [Kavanagh et al. 2006; Menand 2011, and references therein]. We, therefore, propose that the old Moho acted as a ponding zone since the initiation of the Cenozoic volcanism [e.g., Michon 2016], allowing the progressive development of a thick magma underplating that subsequently cooled and became part of the crust. The upper and lower interfaces of the newly formed underplating have likely played a role of mechanical heterogeneities that favored horizontal magma accumulation and the formation of independent magma reservoirs.
Conceptual model of the magmatic plumbing system below the currently active eruptive zone of Mayotte (quadrant Q2). In black, the S-wave velocity profile of the Q2 quadrant obtained at the MAYO station (this study). Grey dots indicate the hypocenters of the seismicity recorded during the Mayotte seismo-volcanic crisis from 2019-02-25 to 2020-05-10 [Saurel et al. 2022]. The red symbols represent areas of potential magma accumulation. Black arrows indicate possible magma migration paths from 80 km depth to the surface. On the right, the depth location of some interfaces provided by the literature. The lateral extent of objects is not constrained.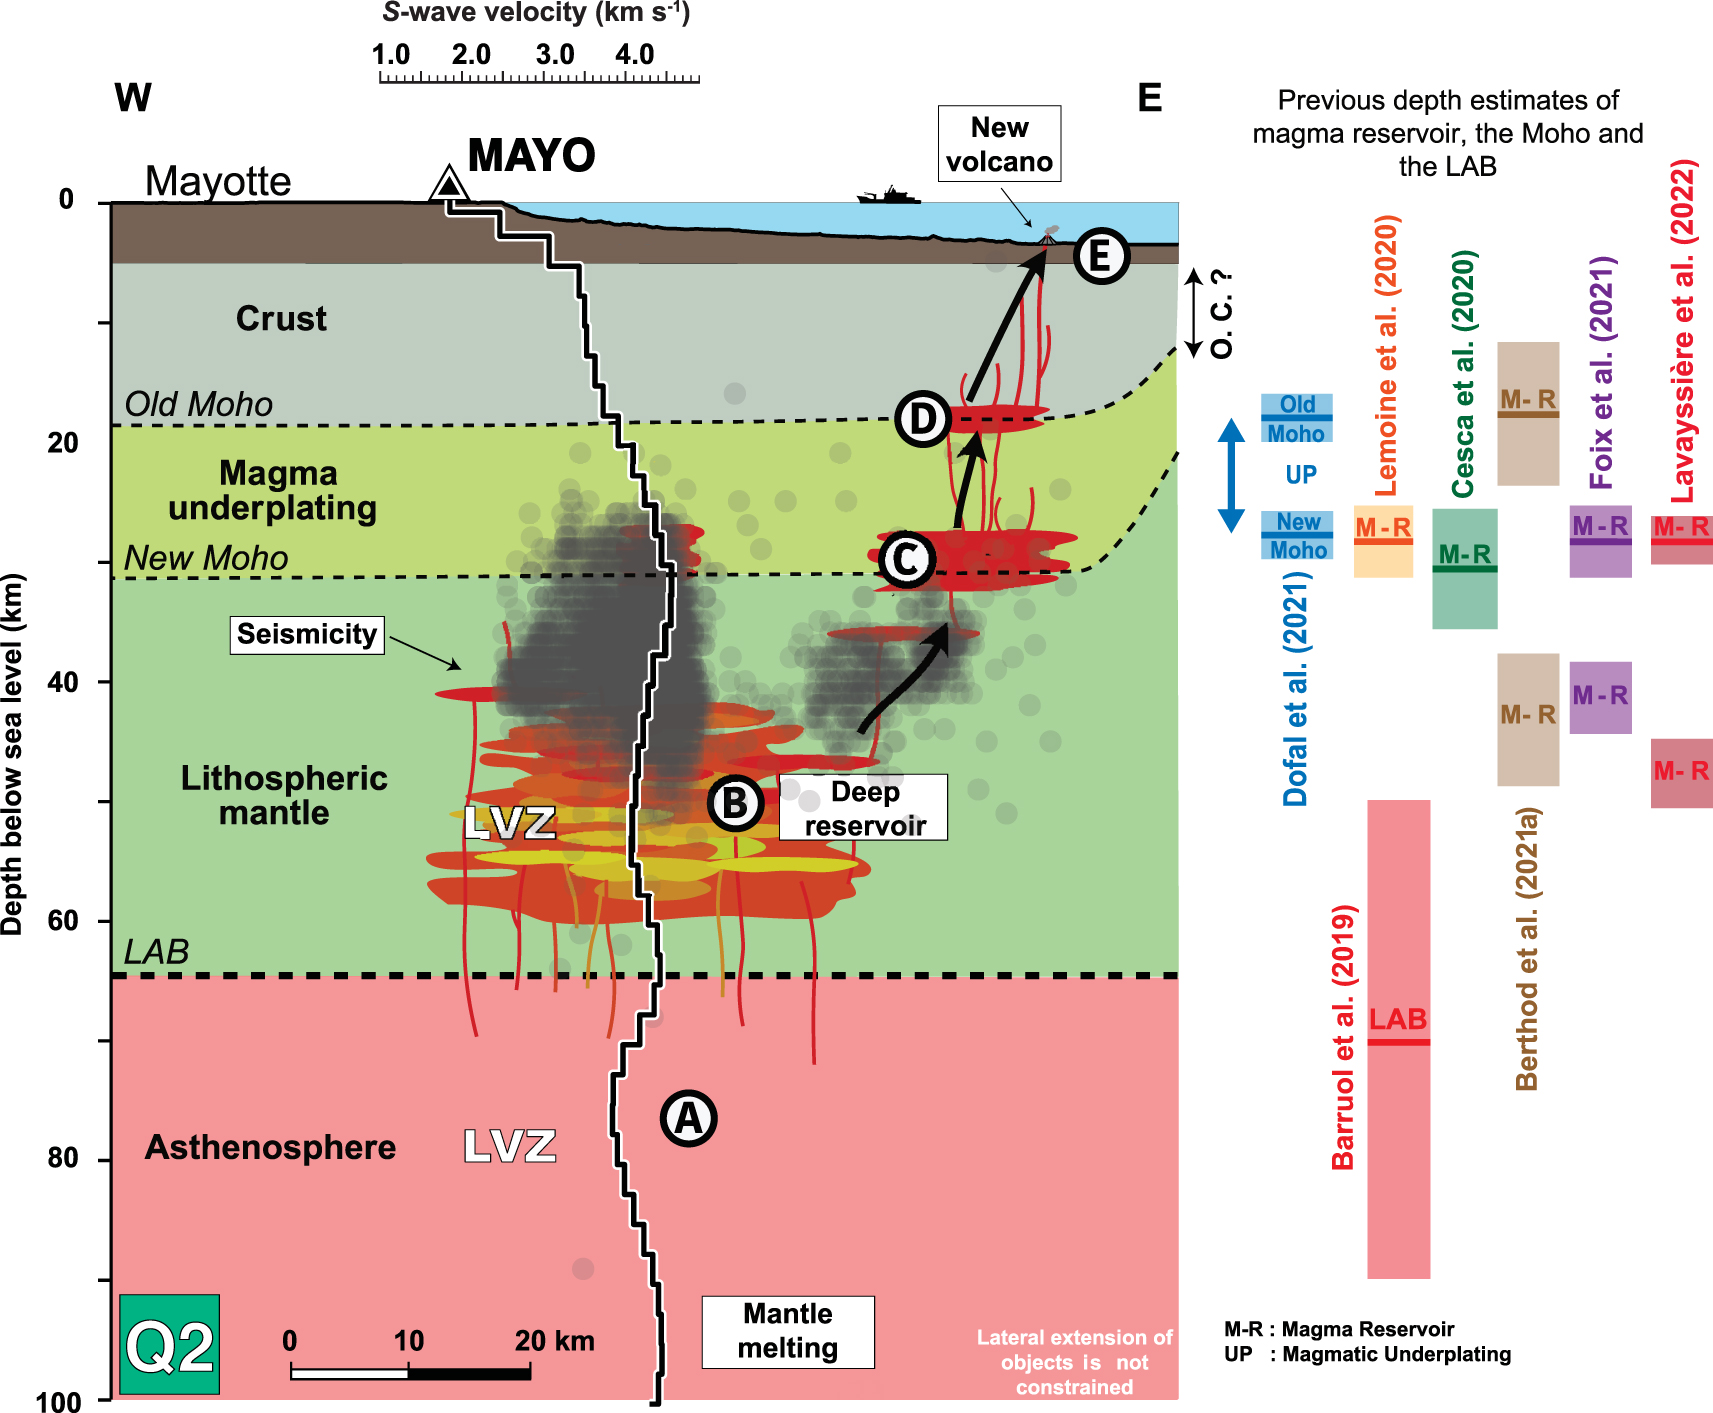
Both petrological and seismological data indicate a major magma reservoir located within the lithospheric mantle at a depth range of 37–52 km below sea level [Berthod et al. 2021a, b; Foix et al. 2021], which corresponds to the upper part of the LVZ that we obtain via the S-wave velocity profile determined for Q2 (i.e., from rays sampling the eastern quadrant where the current seismicity and volcanic activity occur). It is worth noting that the seismic data used by Foix et al. [2021] for their passive tomography does not allow to investigate mantle structures at depths greater than about 45 km and consequently, cannot image a downward continuity of the magma reservoir. Furthermore, the petrological pressure constraints were calculated from clinopyroxene crystals [Berthod et al. 2021a, b] that may have not sampled the entire storage zone. We, therefore, interpret the LVZ imaged with our joint inversion approach as a large magma storage zone between 38 and 58 km depth (Figure 5).
Our data cannot access the detailed structure and the heterogeneities within this large-scale molten body. It is therefore unlikely that this entire volume corresponds to a huge magma chamber filled by a sole magmatic phase. Instead, the S-wave velocity profile of Q2 reveals a progressive velocity decrease down to 54 km depth, which could sign the presence of partial melt and of a mush with an increasing amount of liquid phase from 38 to 54 km. Interestingly, the characteristics of the LVZ in Q1 (a discontinuous velocity decrease and higher S-wave velocities) suggest that a smaller amount of magma is stored in the lithospheric mantle in the northern quadrant beneath Mayotte than in the eastern one below the submarine volcanic ridge along which the new volcano formed [Feuillet et al. 2021]. The development of deep magma storage within the lithospheric mantle where no obvious interface exists raises the question of its controls. Analog experiments have suggested that the rigidity contrast between a stiff upper layer and a lower, less rigid unit prevents a vertical magma ascent and magma stalling in horizontal magma intrusions [Kavanagh et al. 2006]. Such a process can explain the development of sill injections right below the Conrad discontinuity, in the uppermost part of the viscous lower crust [Sparks et al. 2019]. A similar strength profile does exist in the lithospheric mantle where the lower part is viscous while the upper one remains brittle [Ranalli and Murphy 1987; Buck 1991]. Thus, we propose that the magma ascending from the asthenosphere stalls in the viscous lower lithospheric mantle, underneath a more rigid upper layer. The pressure decrease related to the magma emission along the submarine ridge may explain the intense seismicity that developed in the upper rigid layer, between 20–25 km and 50 km depth [Cesca et al. 2020; Lemoine et al. 2020; Feuillet et al. 2021; Saurel et al. 2021].
Although our approach does not allow to determine the precise location of the magmatic structures in the eastern quadrant (Q2), it provides results that remarkably agree with the suspected location of magma reservoirs [Lemoine et al. 2020; Cesca et al. 2020; Foix et al. 2021; Berthod et al. 2021a, b]. Our results provide insights and independent constraints into the deep plumbing system, i.e., from the surface down to the asthenosphere, revealing the existence of a substantial magma-rich zone within the lithospheric mantle. Finally, our results suggest that magma stalling beneath Mayotte is primarily controlled by brittle/ductile rheological contrasts in both the lithospheric mantle and the crust.
6. Conclusion
Despite a limited dataset due to the short duration of deployment of the MAYO seismic station, we are able to bring new elements to constrain the structure of the lithosphere beneath Mayotte and its northern and eastern submarine flanks. We identify deep magma storage within the lithospheric mantle (between 38 and 54 km depth) whose dynamics yields seismicity since 2018 in the brittle part of the lithospheric mantle. We propose that a shallow magma reservoir lies at the interface between the lithospheric mantle and the overlying crust, favoring the formation of thick magma underplating, and that two other magma reservoirs occur at ∼17 km and 28 km at the upper and lower boundaries of this underplating. Finally, our results suggest that the development of the plumbing system is controlled by the rheological contrasts existing within the lithosphere, contrasts that act as mechanical boundaries in which magma stalls and may progressively contribute to the formation of a thick magma underplating in areas of long-lasting activity. To better constrain the lateral and depth extents of the lithospheric structures and of the magma plumbing system at a more regional scale, future work should combine data recorded (1) by permanent onshore broadband stations, (2) by ocean bottom seismometers deployed at large scale around Mayotte and at smaller scale around the eruptive site [cf. REVOSIMA 2020; Saurel et al. 2021], and (3) by long term and multiparameter offshore geophysical observatory, as proposed by the future French MARMOR initiative.
Conflicts of interest
Authors have no conflict of interest to declare.
Acknowledgments
AD’s research was supported by a PhD grant from the University of La Réunion. Station MAYO installation was supported by the Programme Iles Eparses funded by the CNRS-INSU (Institut National des Sciences de l’Univers), CNRS-INEE (Institut National Ecologie et Environnement), TAAF (Terres Australes et Antarctiques Françaises). MAYO portable seismometer was provided by the Alfred Wegener Institute (AWI) in Bremerhaven. The RHUM-RUM data (http://dx.doi.org/10.15778/RESIF.YV2011) are hosted and served by the French RESIF data center (http://seismology.resif.fr). We thank C. Berthod for discussions on the magmatic plumbing system. We also thank A. Mazzullo for providing Rayleigh wave dispersion curve data and E. Stutzmann for discussions on the dispersion curve data. Finally, we would like to express our deepest thanks to the two anonymous reviewers who helped to improve the quality of the paper.