

1 Introduction
The marine Magnoliophyta Posidonia oceanica (L.) Delile is the key species of one of the most important benthic ecosystems in the Mediterranean Sea in terms of primary production, export of detritus towards other ecosystems, species diversity, spawning and nursery opportunities for species of fishery interest, water movement and sediment flows [1–12]. These meadows constitute an almost continuous belt along the Mediterranean shore, from the sea level down to 25–40-m depth (depending upon water transparency). Human activities, e.g., coastal development [13], pollution [14,15], changes in light availability [16], anchoring [17–19] and trawling [20–23], have a strong impact on these meadows and their decline has been observed in a number of regions (e.g., [13,24–26]).
The growth of P. oceanica rhizomes can be plagiotropic (creeping) or orthotropic (erect). As long as all suitable areas are not entirely colonized, rhizomes present plagiotropic growth. When shoot density increases, there is competition for light availability and rhizomes grow vertically [27,28]. Moreover, due to the length (up to 120 cm) and density of the leaves (up to 10 000 m−2), the meadow traps suspended sediments. Rhizomes react to burial by vertical growth. Within the sediment, the deeper parts of the rhizomes die, but their decay is very slow, so that they can persist for millennia. The terrace constituted by live and dead intertwined rhizomes, together with the sediment which fills the interstices, is called ‘matte’ [8,29–31]. When leaf shoots located at the apex of the rhizomes die (e.g., because of anchoring or light reduction), patches of matte without living rhizome are formed within the meadow, which may coalesce into large areas deprived of seagrass.
There is a range of descriptors for P. oceanica meadows: e.g., shoot or leaf density (total number of shoots or leaves in relation to the surface area, usually expressed per square metre), coverage (percentage of the substrate covered by P. oceanica), global density (global density index which integrates the two previous parameters; [32]), rhizome baring (this generally expresses a sediment deficit [33]), and leaf coverage by epiphytes. Some of them, such as density, are widely used and have been the focus of many in-depth studies (e.g., influence of depth on P. oceanica density [34,35]; classification of meadows according to shoot density [36]). The P. oceanica meadows have been studied at micro-(surface < 1 m2), meso-(surface between 1 and 104 m2) and large scale (surface between 104 and 108 m2) [29,37–39]. As far as coverage is concerned, most authors have focussed on coverage at large scale rather than at meso-scale. Both large scale and meso-scale studies of coverage have related this parameter, explicitly or implicitly, to human activities (e.g., port facilities, anchoring, pollution [40–42]). In addition, mesoscale studies always compare mean coverage data, expressed in percentage (see [43]) between different localities and do not take into account information regarding local spatial structure contained in raw data. The goal of the present study is to investigate the possible significance of coverage with regard to ‘plain meadows’ (by far the most common P. oceanica meadow type in the Mediterranean [44]) and its spatial structure at the mesoscale: is it related to human impact, to natural parameters such as depth or to endogenic processes?
2 Material and methods
2.1 Measurement of the coverage
Coverage corresponds to the percentage of the substrate covered by live P. oceanica in relation to the whole surface area. The coverage was measured by means of a 30 cm × 30 cm see-through plastic slide divided into nine 100 cm2 squares. The diver reaches the bottom and goes up 3 m using a depth-meter. Swimming 3 m above the bottom and holding the slide at arm's length, the diver counts the number of squares occupied by P. oceanica (Fig. 1). Projected surface (seen by the observer through the plastic slide) is 4 m2 and the size of the smallest patch of P. oceanica taken into account is 0.44 m2 (one subdivision projection). Thirty measurements are randomly performed during the random displacements of the diver in a radius of 20 m around a fixed point materialized by, e.g., a cement marker (in case of long-term monitoring locations) or a graduated rope. An area of 1250 m2 (size of a prospected area, corresponding to the surface of a circle of 20-m radius) within the seagrass meadow, but lacking in live P. oceanica, was regarded as not belonging to the meadow and was therefore not prospected. The reproducibility of the method is good: an ANOVA Kruskal-Wallis non-parametric test does not evidence significant differences between divers [45].

Coverage measurement method. From [45].
Two hundred and eighty-two sites were studied (Table 1). They are all located along the Provence and French Riviera coast, from the east of Marseilles to Saint-Tropez (Mediterranean Sea, Fig. 2), in meadows belonging to the ‘plain-meadow’ type.
Localisation and description of the study sites
| Location of the locality (see Fig. 2) | Locality | Number of sites per locality |
| 1 | Côte-Bleue | 25 |
| 1 | Anse du Rouet | 5 |
| 1 | Niolon | 10 |
| 2 | Prado | 29 |
| 2 | Corbière | 23 |
| 2 | Château d'If | 1 |
| 2 | Île du Frioul | 5 |
| 2 | Île de Riou | 4 |
| 3 | Saint-Cyr | 28 |
| 3 | Île Verte | 2 |
| 4 | Toulon | 51 |
| 4 | Toulon | 3 |
| 5 | Ile du Levant | 12 |
| 5 | Tour Fondue | 8 |
| 5 | Giens | 29 |
| 6 | Le Lavandou | 8 |
| 7 | Saint-Tropez | 39 |
| TOTAL | 282 |
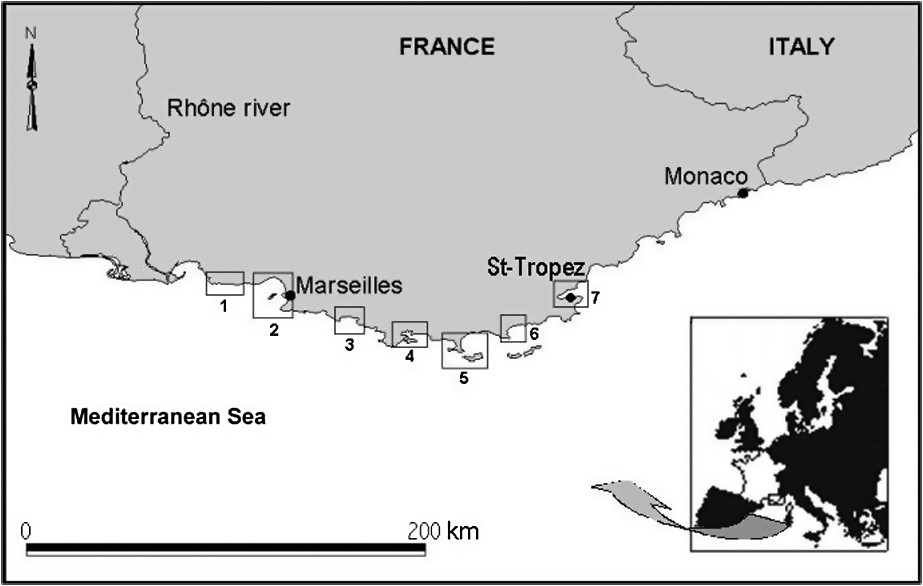
Geographical location of the localities from which coverage data were collected (numbers 1 through 7 refer to description of study sites, see Table 1).
For the purpose of studying spatial structure, the raw data (i.e. the 30 measurements of coverage) of the 282 sites were logged in a contingency table of 282 rows and 10 columns (Table 2).
Description of the contingency table with the coverage raw data
| Sites | Coverage values () | ||||||||||
| 0 | 1 | 2 | 3 | 4 | 5 | 6 | 7 | 8 | 9 | ||
| ⋮ | |||||||||||
| ⋯ | ⋯ | ⋯ | ⋯ | ⋯ | ⋯ | ⋯ | ⋯ | ⋯ | 30 | ||
| ⋯ | |||||||||||
2.2 Interpretation of coverage data
In order to verify that the data are not homogeneous, a test is carried out on the contingency table at the level of significance of 0.05 (to test the null assumption of independence between the rows and the columns) using the software XLStat v6.1.9®.
A hierarchical automatic classification was first performed using the software Statistica 6.1®, with the dissimilarity index of Euclidean distance. The hierarchical method of Ward (algorithm of the second-order moment) was then applied to the matrix of dissimilarity [46]. This method, applicable only on Euclidean or -distance matrix, minimizes the increase in intra-class inertia so that the classes are as homogeneous as possible. This method generates strongly structured trees with well-differentiated higher levels and packed lower levels.
K-means method was then applied to the contingency table using the software Statistica 6.1®. This method consists in improving in an iterative way (maximum number of iterations: 100; convergence threshold of the algorithm: 0.0001) an initial partition (the K objects constituting the centres of initial groups are those that maximize the inter-group inertia) by minimizing intra-class inertia. K is the number of classes of the partition (chosen by the user) obtained at the end of the algorithm execution. The algorithm is carried out several times starting from different initial partitions and the best solution is adopted. A test is carried out in order to verify that classes of coverage structure are well differentiated (at the level of significance of 0.05).
Factors that could be linked to the existence of well-differentiated structures of coverage within meadows and which are available for most of the 282 sites were taken into account (Table 3).
Description of non-endogenic factors taken into account in the statistical analysis of the classes of coverage structure
| Factor | Meaning | Classification | Number of sites for which the data are available |
| Depth (D) | Depth at which is located the meadow | Class 1: D⩽5 | 278 |
| Class 2: 5<D⩽10 | |||
| Class 3: 10<D⩽15 | |||
| Class 4: 15<D⩽20 | |||
| Class 5: 20<D⩽25 | |||
| Class 6: D>25 | |||
| Type of substrate (S) | Type of substrate on which the meadow grows | Class 1: S = sand | 282 |
| Class 2: S = rock | |||
| Relative level (L) | Localisation of the site, with reference to the deeper and the upper limits of the meadow at the locality | Class 1: L = deeper limit | 277 |
| Class 2: L = deep intermediate | |||
| Class 3: L = middle | |||
| Class 4: L = upper intermediate | |||
| Class 5: L = upper limit | |||
| Type of shoot density (SD) | Classification of the average values of shoot density in four categories according to the depth | Class 1: SD = abnormal | 127 |
| Class 2: SD = subnormal | |||
| Class 3: SD = normal | |||
| Class 4: SD = above normal | |||
| Anthropic pressure (P) | Estimation of the intensity of the anthropic pressure which is exerted on the meadow | Class 1: P = weak | 282 |
| Class 2: P = middle | |||
| Class 3: P = high |
Depth of the site is recorded using a depth-meter during scuba-diving, at the centre of the prospected site. The type of substrate is visually identified. Relative level is both estimated during scuba-diving and confirmed when cartographing the distribution of P. oceanica [47,48]. Shoot density is measured during scuba-diving by counting (three to five measurements at each site), the total number of shoots inside a 400-cm2 quadrate [49]. Type of shoot density follows the classification of Pergent et al. [35] that determines if the mean value of the meadow's shoot density is normal or not (classification in four categories), according to the depth at which it is located. Anthropic pressure is estimated using Table 4.
Estimation of the intensity of the anthropic pressure which is exerted on the meadow. Weak anthropic pressure: stations which fulfil all criteria A. Middle anthropic pressure: stations which fulfil only one of criteria B. High anthropic pressure: stations which fulfil at least two of criteria B or one of criteria C
| A | No permanent or sporadic anchoring |
| Distance at least 500 m from a port S>450 boats | |
| Distance at least 100 m from a port S<450 boats | |
| Distance at least 5000 m from a sewage outlet F>100 000 pe | |
| Distance at least 500 m from a sewage outlet | |
| 5000 pe <F<100 000 pe | |
| Distance at least 150 m from a sewage outlet F<5000 pe | |
| B | Distance less than 500 m from a port S>450 boats |
| Distance less than 100 m from a port S<405 boats | |
| Distance less than 5000 m from a sewage outlet F>100 000 pe | |
| Distance less than 500 m from a sewage outlet | |
| 5000 pe <F<100 000 pe | |
| Distance less than 150 m from a sewage outlet F<5000 pe | |
| Permanent anchoring | |
| Distance less than 100 m from an aquaculture facility or fish farm | |
| C | Distance less than 50 m from a sewage outlet F<5000 pe |
| Distance less than 150 m from a sewage outlet F>5000 pe |
In order to test whether the five factors (Table 3) make it possible to identify the class of coverage structure (and thus if each class can be defined by a profile of factors value), a factorial and discriminate analysis (FDA) was performed on 127 sites (number of sites for which data related to each factor were available), using the software XLStat v6.1.9®.
Using XLStat v6.1.9® software, a test was performed in order to determine whether a relation of dependence exists between the classes of coverage structure and each of the five factors at the level of significance of 0.05 (test carried out on the sites for which the factor data are available).
3 Results
3.1 test on raw coverage data
The test makes it possible to reject the null assumption of independence between the rows and the columns of the contingency table ( observed = 12 576***; degree of freedom (dof) = 2529; p-value < 0.0001). Consequently, this highly significant test indicates that there is a non-random distribution of the data.
3.2 Hierarchical classification analysis
The choice of a level for reading the dendrogram (Fig. 3) must be made in order to reach a correct level of dissimilarity while being relevant from the ecological point of view. It appears that the partition of the data into five classes of coverage structure profile, obtained considering node 4, seems the most suitable one. Another type of automatic classification, with the same dissimilarity index but performed using the method of the complete link, resulted in less legible results (due to the chain effect), but similar hierarchisation. The structuring of the data into five classes thus appears to be relatively appropriate.
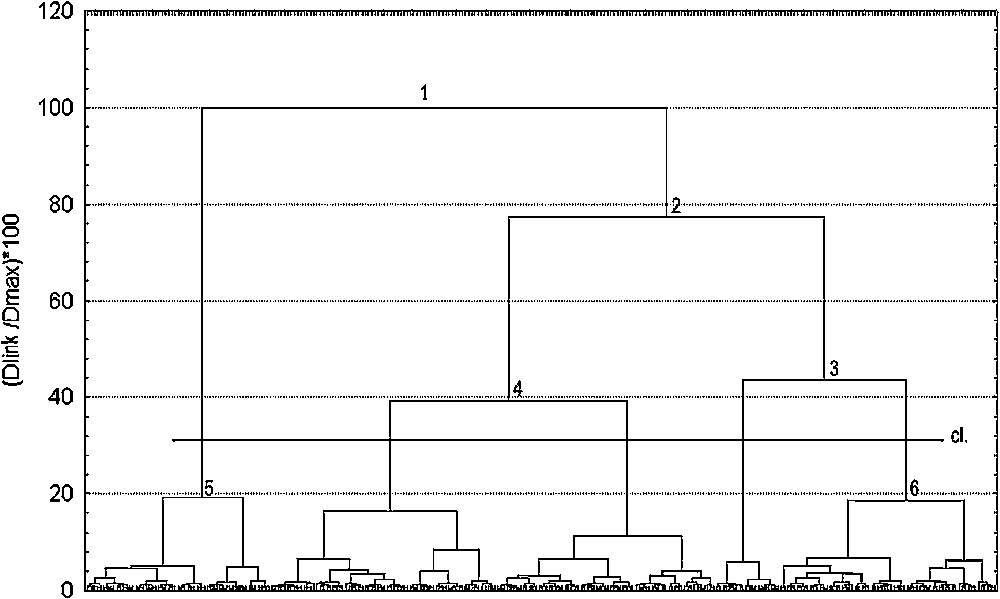
Dendrogram showing results of the hierarchical classification analysis of 282 sites. cl.: Selected level which led to the definition of 5 classes; y-axis: : percentage of dissimilarity relative to the maximum distance within data; x-axis: sites. Numbers 1 though 6 refer to nodes of the dendrogram.
3.3 K-means analysis
Partition into five classes gives satisfactory results (inertia intra-class: 1085; inertia inter-class: 1735). The convergence occurs at the 11th iteration. A class h is characterized by the means () of the number of measurements (cf. Table 2) of the whole set of sites () that compose it. A new contingency table can thus be created (Table 5). The test performed on this contingency table makes it possible to reject the null assumption of independence between the rows and the columns of the contingency table (***; ; p-value < 0.0001). The five classes obtained by the method of the K-means are thus highly significantly different. Fig. 4 shows a graphic representation of each class profile. Interestingly, confidence intervals are quite narrow.
Description of the contingency table which integrates the data concerning classes of coverage structure
| Class (h) | Nos. | Coverage values ( to 9) | ||||||||||
| 0 | 1 | 2 | 3 | 4 | 5 | 6 | 7 | 8 | 9 | |||
| 1 | (24) | ⋮ | ||||||||||
| 2 | (80) | |||||||||||
| 3 | (61) | ⋯ | ⋯ | ⋯ | ⋯ | ⋯ | ⋯ | ⋯ | ⋯ | ⋯ | 30 | |
| 4 | (77) | |||||||||||
| 5 | (40) |
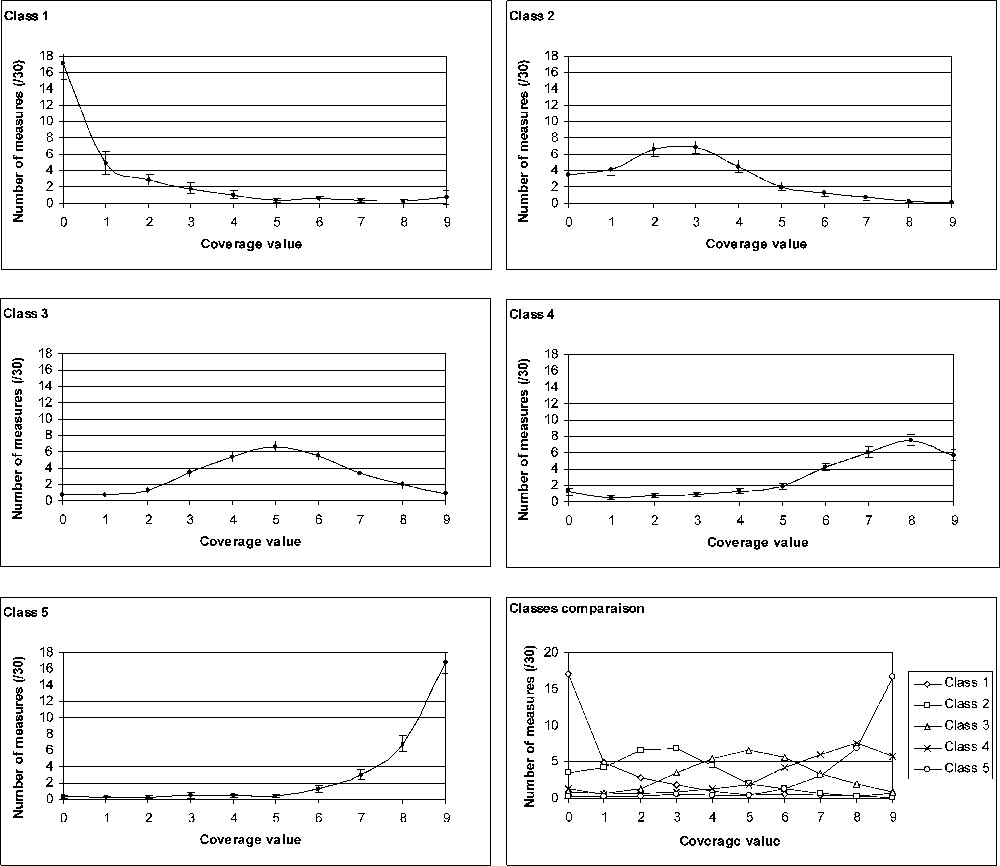
Graphic representation of the profile of the five classes of coverage structure. For each class, the ‘number of measurements’ (on the y-axis; representative of the considered class) at each coverage value (0 to 9) is calculated as the mean of the values of all sites belonging to the class.
3.4 Factorial and discriminate analysis
The apparent error rate of the FDA (confusion matrix) is extremely high (54.76%). Graphic representation of FDA results (Fig. 5) confirms that classes could not be discriminated by factorial axis obtained from the five initial factors. It is thus obvious that none of the coverage structure classes could be defined by a profile of factor value.
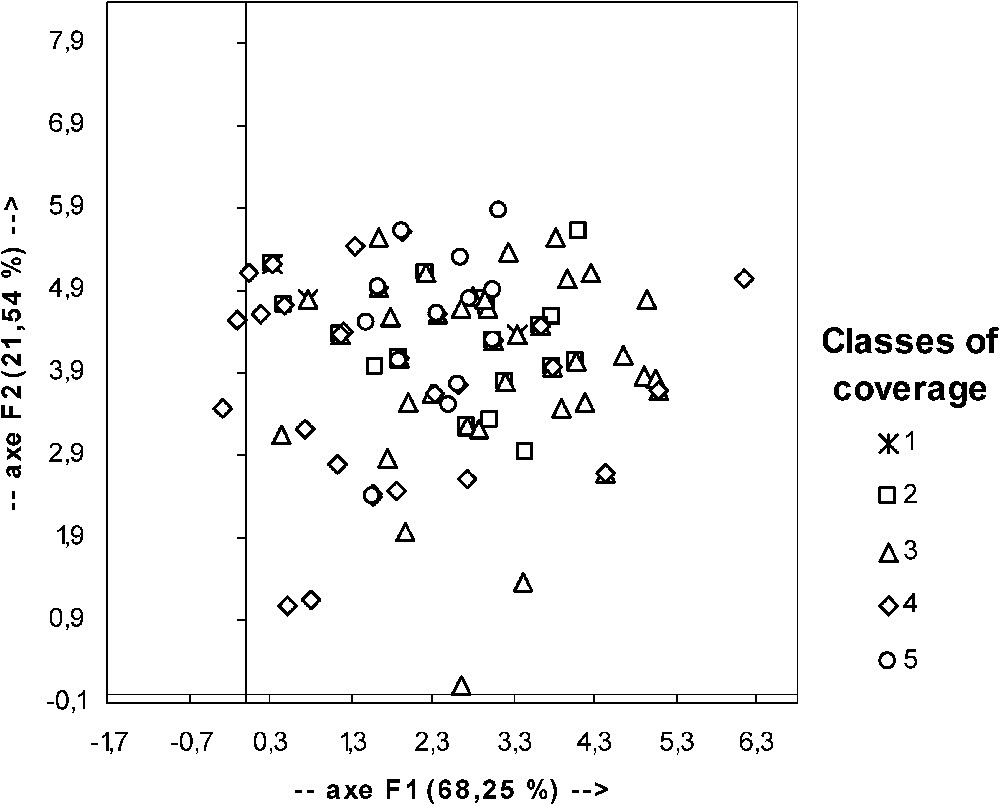
Graphic representation of the result of factorial and discriminate analyses performed with data for the classes of coverage structure and the considered factors (see Table 3). F1 and F2: component 1 and 2; in parenthesis: percentage of intrinsic variability explained by the considered component.
3.5 tests on classes of coverage structure and factors data
For all the factors except relative level, the test does not allow rejection of the null assumption of independence between the rows (classes of coverage structure) and the column (factor): depth: , dof = 20, p-value = 0.078847; type of substrate: , dof = 4, p-value = 0.206241; type of shoot density: , dof = 12, p-value = 0.092986; anthropic pressure: , dof = 8, p-value = 0.144533. The test shows the dependence between classes of coverage structure and relative level (, dof = 16, p-value = 0.000558). Table 6 presents by class of structure the distribution and the percentage of sites belonging to each class of the factor ‘relative level’.
Frequency table presenting by class of structure the distribution (number of sites, in parenthesis) and the percentage of sites belonging to each class of the factor ‘relative level’
| Deeper limit | Deeper intermediate | Middle | Upper intermediate | Upper limit | |
| 1 | 9.75%(4) | 17.39%(4) | 7.20%(9) | 4.88%(2) | 4.26%(2) |
| 2 | 43.90%(18) | 26.09%(6) | 15.20%(19) | 12.20%(5) | 25.53%(12) |
| 3 | 26.83%(11) | 26.09%(6) | 24.00%(30) | 29.27%(12) | 44.68%(21) |
| 4 | 19.51%(8) | 21.74%(5) | 32.00%(40) | 36.59%(15) | 17.02%(8) |
| 5 | 0.00%(0) | 8.70%(2) | 21.60%(27) | 17.07%(7) | 8.51%(4) |
4 Discussion and conclusion
To date, studies dealing with the P. oceanica coverage have only considered the mean coverage without taking into account the fact that sites with the same coverage value may exhibit different structure of coverage, i.e. a different degree of patchiness (e.g., [42,48,50]). And indeed it does appear that well-differentiated coverage structures do occur within P. oceanica meadows. Five classes of coverage structure can be defined. The first type of coverage structure (class 1) concerns meadows that present numerous areas of at least 4 m2 without any seagrass and few patches (larger or smaller than 4 m2) of P. oceanica. The structure represented by class 5 is the opposite case: an area extensively covered by P. oceanica with few patches without seagrass. Classes 2, 3 and 4 are intermediate structures, described by bell-shape distribution of coverage values with maxima at 3, 5 and 8, respectively.
Most extreme types of coverage structure have already been visually described and sometimes related to explanatory factors. For example, class-1 coverage structure is generally described as residual or colonizing patches of P. oceanica in areas under anthropic pressure and located at the meadow limits. But this type of structure often occurs within meadows at intermediate levels of the meadow depth range, where it is far from uncommon. In this intermediate position, this type of structure has been interpreted by authors as resulting from heavy direct anthropic impact, e.g., trawling, anchoring, and sewage discharge [41].
But FDA shows that none of the five classes of coverage structure could be related to a profile of explanatory factors. The test indicates that only the factor ‘relative level’ can be related to coverage structure class. Though the relation between coverage structure and relative level is not obvious, a pattern does appear to emerge: sites located at the middle level are principally classified in classes 3 through 5, at the deep intermediate level in classes 2 and 3 and those which are located at the upper intermediate level are classified principally in classes 3 and 4. Sites located at the deeper and upper limits are on average classified in coverage structure classes 2 and 3, respectively. There is no site located at the inferior limit classified in coverage structure class 5.
There is thus obvious coverage structuring, which cannot be linked to the factors taken in account in this study, except a pattern of distribution of coverage structures according to relative level. Two hypotheses could explain this observation.
The first is that the existence of well-differentiated structures is related to factors not taken into account in this study. Water movement seems the most obvious. It could have a strong impact on the structure of P. oceanica meadows through the pulling up of rhizomes, the enlargement of breaks within the meadow and sand tides [29,51,52]. Nevertheless, the water movement varies according to the depth [53], so it could be supposed that if hydrodynamics were a strong influencing factor for coverage structuring, classes of coverage structure would be dependent on depth, whereas results indicate an absence of dependence between depth and coverage classes.
The second hypothesis is that mesoscale structuring of the coverage could be due not only to external factors, but in part to endogenic processes (that is to say due to the seagrass itself and the mechanisms of rhizome growth and matte formation) or to genetic characteristics of the strains involved. A seagrass meadow is a patchwork of ramets (clones belonging to a same genetic individual) and of genets (genetically different individuals [54]). It is to be expected that genets exhibit distinct patterns of growth, matte formation and mortality of sets of shoots.
The results presented here give an indication of a possibly surprising fact: human impact may not constitute an obvious explanation factor for the coverage structuring of seagrass meadows at the mesoscale.
Acknowledgement
The authors acknowledge with thanks the help of G. Bernard, P. Bonhomme, E. Charbonnel, and G. Cadiou from GIS Posidonie for scuba diving data collection, Michael Paul for improving the English text, Prof. Lucien Laubier and two anonymous reviewers for their relevant suggestions. This work was performed as part of a programme funded by the ‘conseil régional PACA’ and ‘Méditerranée 2000’.