

1 Introduction
Niche partitioning and intra- and interspecific competition between fish are topics of unswerving interest to researchers. This interest is enhanced by the increased spread of invasive fish, which are considered a serious threat to global biodiversity [1–4]. Food resources constitute a key component underlying competitive interactions [5] and are often the principal mechanism of niche segregation [6]. Thus, niche parameters can rapidly respond to changes in intra- and interspecific competition as well as to changes in food abundance. The competition within or between populations of fish caused by strong overlaps of feeding niches can result in utilising alternative and metabolically worse food resources [7], and can lead to the spatial segregation of species or of age groups of one species [8–11]. In order to find the best way to describe the food niches of fish, numerous methods and software applications have been created, yet quite simple indexes have been successfully applied in most studies. Almost all of these indexes have focused on fish alimentary tract contents (ATC). However, the problem of estimating the food niche overlapping with omnivorous fish on the basis of ATC arises from the fact that these fish utilise different ecological formations. Thus, at least several highly specialised taxonomists have to be involved in the arduous work on ATC. Additionally, data relating to ATC are very noisy because an identified ATC comprises remains that can be determined according to the species level, determined only according to general food categories (i.e. higher taxonomic levels) as well as amounts of fragmented and digested remains that cannot be determined taxonomically. Thus, a variety of scales of precision can be applied during work on the ATC. Up until now, there has been no evidence whether and how precision in ATC estimation can affect the results. This study aims at assessing how three different options of the same database influence the effectiveness and concurrency of indexes commonly used to describe the food niche of fish. The options include: (1) only general (higher than species level) food categories, (2) categories of different levels of generality, and (3) only detailed (species level) food categories. It can be suspected that choosing only general food categories could result in losing detailed information. A solution including categories of different levels of generality in the dataset could result in methodological errors; choosing only more detailed food categories could result in losing information on a large part of the ATC. The study was conducted by applying three commonly used indexes, including the index of relative importance (IRI) [12], Levins’ index (niche breadth index) [13], and Shoener's similarity index [14]. The indexes were considered for the ATC of 4 species, including perch Perca fluviatilis L., roach Rutilus rutilus (L.), bleak Alburnus alburnus (L.), and catfish Ictalurus nebulosus Le Sueur, 1819. Perch and roach are widely distributed all over Europe. Roach is an omnivorous species that feeds on zooplankton, zoobenthos, detritus, epiphytes, phytoplankton and macrophytes [15,16]. At the juvenile stage, perch feeds on zooplankton, but as it increases in size, it switches to benthic macro-invertebrate food and later to a piscivorous diet [17,18]. Bleak is a cyprinid native to most of Europe that mainly inhabits lentic environments [19]. Bleak is an efficient zooplankton feeder, and its diet is also complemented by surface insects, blue-green algae and zoobenthos [20,21]. Roach, perch and bleak, while native to Polish lakes, are successful invaders and are regarded as a serious threat to native fauna in the regions of their invasion [22–24]. Catfish is native to the eastern regions of the United States of America. The fish was introduced in some European countries, including Poland, in the 1880s for aquaristic and farming purposes [25], and it is currently present in the freshwater bodies of almost all of Europe [26]. It eats a very wide range of food, including planktonic crustaceans, zoobenthos, epiphytes, filamentous algae, and fish [27–29], and is probably rarely preyed on by native piscivorous species. Their being opportunistic omnivores and lack of natural enemies make catfish considered to be competitors for native fish species.
The specific goal of the study was to compare the results of the indexes in order to assess: (1) whether results based on different options of the same database are similar, and (2) which of the options gives us the greatest opportunity to interpret the results. The food categories that were estimated in detail were cladocerans. This group was chosen because cladocerans are willingly eaten by omnivorous fish and are abundantly found in their ATC, and their chitinous carapaces are tough and small enough to not be crumpled and fragmented during ingestion.
2 Materials and methods
2.1 Fish sampling
Fish were caught in Lake Piaseczno (51°23′03′′N, 23°01′46′′E), which is situated in eastern Poland. The lake was selected for the studies because it has a meso-eutrophic status, thus suggesting limited food resources and resulting in strong feeding competition among fish. Additionally, Lake Piaseczno is without an outlet and is not stocked with fry, thus the structure of the relations among species and age classes of fish is not deranged. The lake area is 83.2 ha and its maximum depth reaches 38.8 m. The fish were collected by gillnets in the pelagic zone, nine times during the spring–summer–autumn seasons, including three times for each season. Every gillnet consisted of 14 panels with mesh sizes of 6.25, 8, 10, 12.5, 16.5, 22, 25, 30, 33, 38, 43, 50, 60, and 75 mm. The selection of fish species for further studies was based on the assumption that the number of individuals in each age group of distinct fish species was at least 20 for all catches. This assumption was fulfilled for four fish species, including bleak A. alburnus, roach R. rutilus, perch P. fluviatilis, and catfish I. nebulosus.
2.2 Laboratory analyses
Because age determines the biotic interactions of fish [30,31], diet analyses were conducted with regard to the age level. The age of the fish was determined on the basis of the yearly growth of scale radii, except for catfish, whose approximate age was determined on the basis of their total body length. The scales were measured with the aid of a microfiche projector. Annuli measurements were taken horizontally from the focus to the anterior-median edge. The length of each catfish individual was measured to the nearest millimetre. Two age groups were determined: ≤ 2+ with body length < 130 mm, and ≥ 3+ with body length ≥ 130 mm [32–34]. The ATC of at least 20 random individuals for each age group within species was estimated for proportions of food items. Prey from the complete ATC, after identification, were counted and weighed (wet weight), with the exception of Cladocera and Copepoda, whose biomass was computed with the use of mathematical estimations [35].
2.3 Statistical analyses
The dataset of each ATC was estimated based on three options. Option A comprised only general (higher than species level) food categories, option B comprised categories of different levels of generality, and option C comprised only detailed (Cladocera species) food categories (Table 1). These options were applied to estimate the food niche partitioning of fish by using the index of relative importance (IRI) [12], Levins’ index [13], and Shoener's similarity index [14].
Classification of food items found in the alimentary tract contents (ATC) of fish, assigned into three options used to compare the results of food niche partitioning indexes.
| Option A | Option B | Option C | ||
| Food category | Scientific classification | Food category | Scientific classification | |
| Cladocera | Order | Option A + option C | Acroperus elongatus | Species |
| Copepoda | Sublass | Acroperus harpae | Species | |
| Nematoda | Phylum | Alona affinis | Species | |
| Hirudinea | Subclass | Alonella excisa | Species | |
| Hydrachnidia | Unranked | Alonella nana | Species | |
| Isopoda | Order | Bosmina coregoni | Species | |
| Ephemeroptera | Order | Bosmina longirostris | Species | |
| Odonata | Order | Camptocercus rectirostris | Species | |
| Heteroptera | Suborder | Ceriodaphnia quadrangula | Species | |
| Coleoptera | Order | Chydorus sphaericus | Species | |
| Culicidae | Family | Daphnia cucullata | Species | |
| Chironomidae | Family | Daphnia longispina | Species | |
| Chaoboridae | Family | Diaphanosoma brachyurum | Species | |
| Trichoptera | Order | Drepanothrix dentata | Species | |
| Gastropoda | Class | Eurycercus lamellatus | Species | |
| others | Graptoleberis testudinaria | Species | ||
| Lathonura rectirostris | Species | |||
| Leptodora kindtii | Species | |||
| Leydygia acanthocercoides | Species | |||
| Picripleuroxus laevis | Species | |||
| Pleuroxus trigonellus | Species | |||
| Pleuroxus uncinatus | Species | |||
| Pseudochydorus globossus | Species | |||
| Sida crystallina | Species | |||
| Simocephalus vetulus | Species |
The index of relative importance (IRI) [12] constitutes the relative contribution of food items to the diet in terms of frequency of occurrence (% FO) and percentage composition by number (% N) and by mass (%M):
In order to standardise the index on a scale from 0 to 100%, it was calculated as a percentage of the sum of all IRI scores [36]:
Levins’ index [13], standardised by Hurlbert [37], estimates the niche breadth for fish according to the formula:
Schoener's similarity index [14] estimates overlaps in the diet according to the formula:
3 Results
3.1 Abundance and age-structure of fish
Of the four fish species, roach was the most abundant, for it constituted 63.4% of the pooled numerical catch. Perch constituted 17.9%, catfish comprised 15.0%, and bleak constituted 3.7% of the total catch of the studied fish species. The age of roach ranged from 0+ years to 4+ years. The age of perch ranged from 0+ years to 2+ years. The age of bleak ranged from 1+ year to 3+ years. For catfish, two age groups were distinguished, the first group comprising ≤ 2+ year individuals and the second group comprising ≥ 3+ year individuals.
3.2 Diet overlaps
3.2.1 Index of relative importance
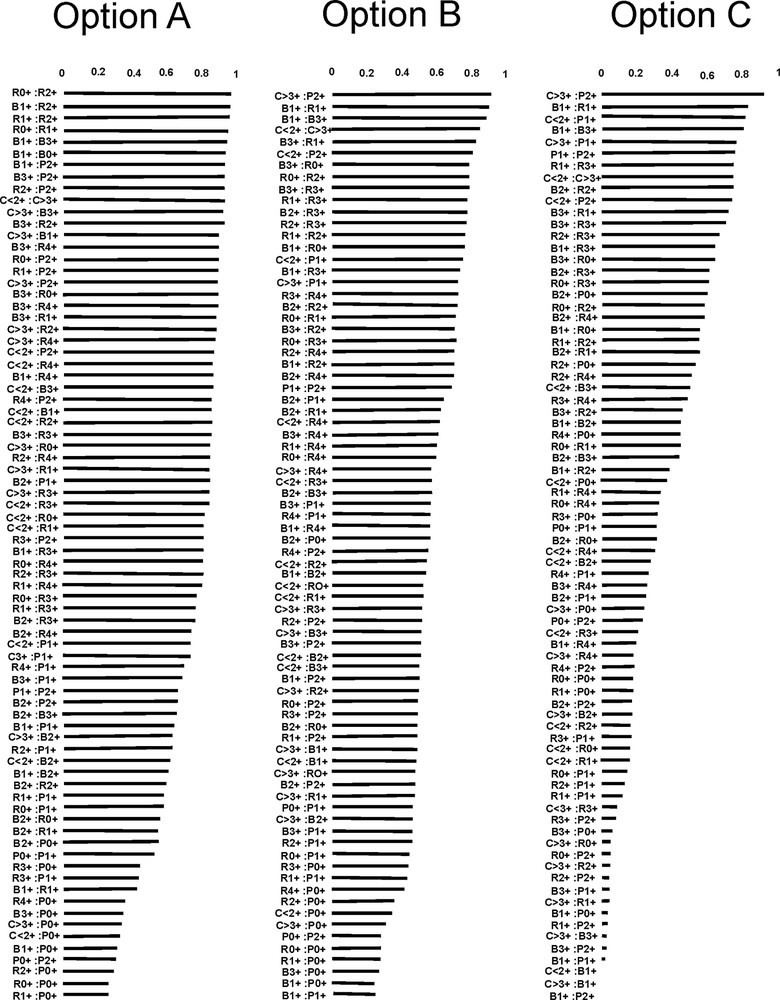
In option A, two prey items, Cladocera and Chironomidae, were the most important in the diet of the fish. Cladocera showed the highest values of IRI for all age groups of bleak (IRI = 31.1–68.2), catfish (IRI = 27.3–50.4), and 0+ roach (IRI = 27.1). For the rest of the age groups of fish, Chironomidae achieved the highest values of IRI (IRI = 24.7–34.3). In option B, Bosmina coregoni was the most important in the diet of bleak (IRI = 37.9–42.9), and Chironomidae showed the highest importance in the diet of roach (IRI = 21.7–34.3) and perch (IRI = 21.3–32.7), whereas lamellatus had the highest importance in the diet of catfish (IRI = 26.9–43.1). In option C, B. coregoni showed the highest importance in the diet of all age groups of bleak (IRI = 44.7–67.9) and roach (IRI = 24.5–69.2), except for 4+ roach, where Acroperus harpae (IRI = 30.6) and E. lamellatus (IRI = 35.2) had the highest values of IRI. In the diet of 0+ perch, A. harpae achieved the highest IRI values. For 1+–2+ perch and all age groups of catfish, E. lamellatus showed the highest importance in the diet (IRI = 89.4–93.3 for perch, IRII = 85.5–98.5 for catfish) (Fig. 1, Table 2).
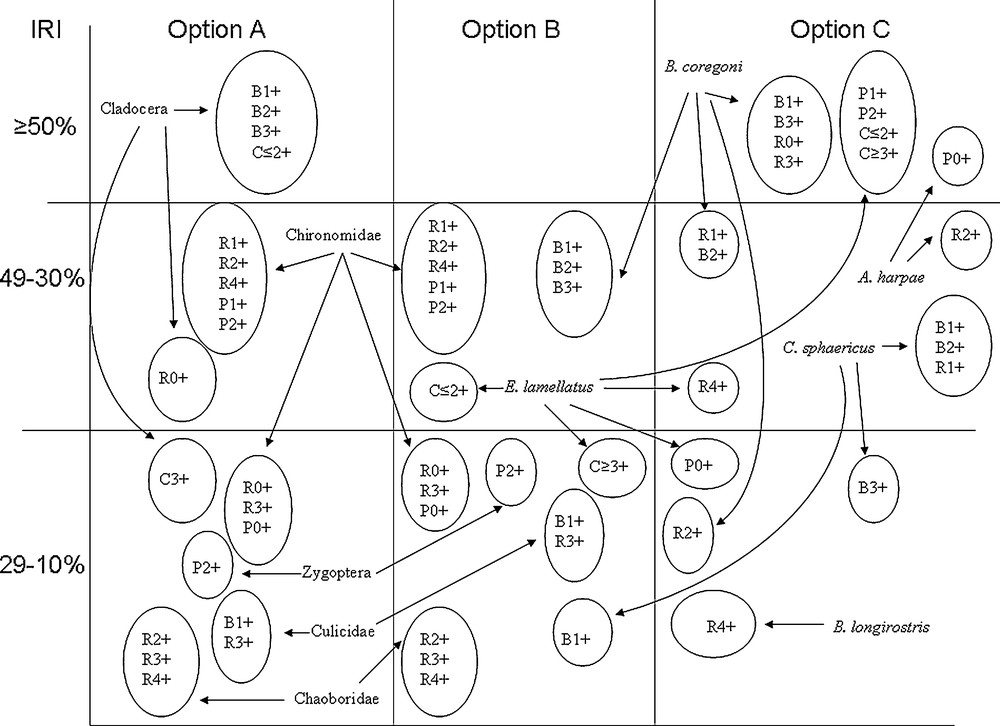
Diagrammatic depiction of the index of relative importance (IRI) values computed with the same database based on different options. Option A: only general (higher than species level) food categories; option B: categories of different levels of generality; option C: only detailed (species level) food categories. Species codes: R – roach, P – perch, B – bleak, C – catfish.
Index of relative importance (IRI) of prey items in alimentary tract contents (ATC) of fish computed for different options of the same database.
| Bleak | Roach | Perch | Catfish | ||||||||||
| 1+ | 2+ | 3+ | 0+ | 1+ | 2+ | 3+ | 4+ | 0+ | 1+ | 2+ | ≤2+ | ≥ 3+ | |
| Option A | |||||||||||||
| Cladocera | 68.2 | 62.3 | 63.1 | 31.1 | 17.9 | 10.5 | 11.1 | 0.7 | 27.1 | 6.3 | 7.9 | 50.4 | 27.3 |
| Copepoda | 2.3 | 4.1 | 3.7 | 3.1 | 4.3 | 14.3 | 3.1 | 0.7 | 1.1 | 1.0 | |||
| Nematoda | 6.3 | 5.2 | |||||||||||
| Hirudinea | 0.3 | 0.7 | |||||||||||
| Hydrachnidia | 1.5 | 2 | 5.2 | ||||||||||
| Isopoda | 6.3 | 7.3 | 15.3 | 8.1 | 8.9 | 15.5 | 13.7 | 10.5 | 7.3 | 3.1 | |||
| Ephemeroptera | 0.9 | 1.7 | 12.3 | 13.9 | 3.3 | 4.1 | 3.2 | 11.9 | 9.3 | ||||
| Anizoptera | 1.3 | 3.4 | |||||||||||
| Zygoptera | 5.1 | 13.3 | 3.1 | 4.2 | 5.7 | 13.9 | 25.5 | 7.1 | 18.2 | ||||
| Heteroptera | 1.1 | 1.3 | |||||||||||
| Coleoptera | 0.9 | 3.1 | |||||||||||
| Culicidae | 20.4 | 13.3 | 17.8 | 0.2 | 3.0 | 4.3 | 21.5 | 19.7 | 1.1 | 2.7 | 8.7 | ||
| Chironomidae | 3.5 | 21.7 | 33.5 | 34.3 | 24.7 | 33.2 | 21.3 | 32.7 | 30.9 | 13.7 | 11.2 | ||
| Ceratopogonidae | 3.3 | 2.7 | |||||||||||
| Chaoboridae | 9.1 | 10.0 | 2.1 | 14.3 | 19.1 | 21.8 | 27.0 | 25.0 | 3.1 | 0.7 | 2.2 | ||
| Trichoptera | |||||||||||||
| Lepidoptera | 3.2 | 4.1 | 3.3 | ||||||||||
| Gastropoda | 0.3 | 0.1 | 1.1 | 13.1 | |||||||||
| Others | 3.1 | 2.9 | 14.1 | 0.2 | 0.5 | 1.4 | 4 | 7.3 | 18.7 | 2.2 | |||
| Option B | |||||||||||||
| Copepoda | 2.3 | 4.1 | 3.7 | 3.1 | 4.3 | 14.3 | 3.1 | 0.7 | 1.1 | 1.0 | |||
| Nematoda | 6.3 | 5.2 | |||||||||||
| Hirudinea | 0.3 | 0.7 | |||||||||||
| Hydrachnidia | 1.5 | 2 | 5.2 | ||||||||||
| Isopoda | 6.3 | 7.3 | 15.3 | 8.1 | 8.9 | 15.5 | 13.7 | 10.5 | 7.3 | 3.1 | |||
| Ephemeroptera | 0.9 | 1.7 | 12.3 | 13.9 | 3.3 | 4.1 | 3.2 | 11.9 | 9.3 | ||||
| Anizoptera | 1.3 | 3.4 | |||||||||||
| Zygoptera | 5.1 | 13.3 | 3.1 | 4.2 | 5.7 | 13.9 | 25.5 | 7.1 | 18.2 | ||||
| Heteroptera | 1.1 | 1.3 | |||||||||||
| Coleoptera | 0.9 | 3.1 | |||||||||||
| Culicidae | 20.4 | 13.3 | 17.8 | 0.2 | 3.0 | 4.3 | 21.5 | 19.7 | 1.1 | 2.7 | 8.7 | ||
| Chironomidae | 3.5 | 21.7 | 33.5 | 34.3 | 24.7 | 33.2 | 21.3 | 32.7 | 30.9 | 13.7 | 11.2 | ||
| Ceratopogonidae | 3.3 | 2.7 | |||||||||||
| Chaoboridae | 9.1 | 10.0 | 2.1 | 14.3 | 19.1 | 21.8 | 27.0 | 29.3 | 3.1 | 0.7 | 2.2 | ||
| Trichoptera | |||||||||||||
| Lepidoptera | 3.2 | 4.1 | 3.3 | ||||||||||
| Gastropoda | 0.3 | 0.1 | 1.1 | 13.1 | |||||||||
| Others | 3.1 | 2.9 | 14.1 | 0.2 | 0.5 | 1.4 | 4 | 7.3 | 18.7 | 2.2 | |||
| A. elongatus | 0 | 0.01 | |||||||||||
| A. harpae | 17.8 | 0.8 | 3.3 | 3.0 | 4.3 | 0.6 | 0.21 | 19.2 | 0.5 | 0.1 | 2.9 | 0.2 | |
| A. affinis | 0.5 | 4.1 | 0.1 | 0.7 | 0.05 | 0.03 | 0.001 | 0.13 | 0.01 | ||||
| A. excisa | 0.04 | 0.003 | 0.0002 | ||||||||||
| A. nana | 0.04 | 0.0005 | |||||||||||
| B. coregoni | 42.9 | 37.9 | 42.8 | 16.9 | 6.9 | 2.57 | 7.7 | 0.02 | 0.002 | 0.003 | |||
| B. longirostris | 0.03 | 0.14 | 0.02 | 0.18 | 0.05 | 0.01 | 0.003 | ||||||
| C. rectirostris | 0.005 | 0.02 | 0.03 | 0.2 | 0.05 | 3.1 | 0.1 | ||||||
| C. quadrangula | 0.03 | 0.002 | 0.0002 | ||||||||||
| C. sphaericus | 24.0 | 6.5 | 16.0 | 0.5 | 7.2 | 2.1 | 1.6 | 0.01 | 0.2 | 0.03 | 0.002 | 0.1 | 0.03 |
| D. cucullata | 1.2 | 1.1 | 5.3 | 0.30 | 0.1 | 0.1 | 0.01 | ||||||
| D. longispina | 1.2 | 0.03 | 0.4 | 0.7 | 0.02 | ||||||||
| D. brachyurum | 0.2 | 0.007 | 0.002 | 0.1 | |||||||||
| D. dentata | 0.003 | 0 | |||||||||||
| E. lamellatus | 0.6 | 0.1 | 0.2 | 0.3 | 0.25 | 7.4 | 5.6 | 7.4 | 43.1 | 26.9 | |||
| G. testudinaria | 0.02 | 0.2 | |||||||||||
| L. rectirostris | 0.02 | 0.0005 | |||||||||||
| L. kindtii | 0.03 | ||||||||||||
| L. acanthocercoides | 0.2 | 0.01 | 0.004 | ||||||||||
| P. laevis | 0.004 | 0.005 | 0.0002 | ||||||||||
| P. trigonellus | 0.001 | ||||||||||||
| P. uncinatus | 0.004 | 0.001 | |||||||||||
| P. globossus | 0.003 | ||||||||||||
| S. crystallina | 0.7 | 0.05 | 0.8 | 0.003 | |||||||||
| S. vetulus | 0.02 | 0.04 | 0.01 | 0.41 | 0.1 | 0.1 | |||||||
| Option C | |||||||||||||
| A. elongatus | 0 | 0.02 | |||||||||||
| A. harpae | 10.5 | 1.2 | 10.6 | 17.0 | 40.8 | 5.5 | 30.6 | 70.8 | 7.5 | 1.3 | 5.7 | 0.8 | |
| A. affinis | 0.8 | 13.1 | 0.7 | 6.8 | 0.7 | 0.1 | 0.02 | 0.3 | 0.03 | ||||
| A. excisa | 0.2 | 0.03 | 0.001 | ||||||||||
| A. nana | 0.1 | 0.002 | |||||||||||
| B. coregoni | 63.0 | 44.7 | 67.9 | 54.3 | 38.8 | 24.5 | 69.23 | 2.9 | 0.03 | 0.04 | |||
| B. longirostris | 0.03 | 1.3 | 0.21 | 25.9 | 0.2 | 0.02 | 0.01 | ||||||
| C. rectirostris | 0.1 | 0.2 | 0.30 | 0.6 | 0.8 | 6.1 | 0.3 | ||||||
| C. quadrangula | 0.3 | 0.03 | 0.0009 | ||||||||||
| C. sphaericus | 35.2 | 44.8 | 25.4 | 1.7 | 40.3 | 19.8 | 14.1 | 1.8 | 0.7 | 0.5 | 0.03 | 0.1 | 0.1 |
| D. cucullata | 1.8 | 1.8 | 17.2 | 1.7 | 1.0 | 0.9 | 0.03 | ||||||
| D. longispina | 1.9 | 0.2 | 3.5 | 6.02 | 2.9 | ||||||||
| D. brachyurum | 0.5 | 0.04 | 0.02 | 1.0 | |||||||||
| D. dentata | 0.03 | ||||||||||||
| E. lamellatus | 1.8 | 0.7 | 1.7 | 3.02 | 35.2 | 27.4 | 89.4 | 93.3 | 85.5 | 98.5 | |||
| G. testudinaria | 0.1 | 0.4 | |||||||||||
| L. rectirostris | 0.05 | 0.002 | |||||||||||
| L. kindtii | 0.5 | ||||||||||||
| L. acanthocercoides | 0.6 | 0.1 | 0.04 | ||||||||||
| P. laevis | 0.02 | 0.02 | 0.0009 | ||||||||||
| P. trigonellus | 0.003 | ||||||||||||
| P. uncinatus | 0.02 | 0.01 | |||||||||||
| P. globossus | 0.1 | ||||||||||||
| S. crystallina | 1.0 | 0.4 | 1.5 | 0.01 | |||||||||
| S. vetulus | 0.2 | 0.2 | 0.2 | 5.2 | 0.1 | 0.22 |
3.2.2 Levins’ index
In option A, the lowest niche breadths were found for 0+–2+ roach, ≥ 3+ catfish and 2+ perch (BA = 0.009–0.05), whereas 2+ bleak had the broadest niche (BA = 0.507). In option B, the lowest niche breadths occurred for ≥ 3+ catfish as well as 1+ and 2+ roach (BA = 0.056–0.98), and the highest for 2+ bleak (BA = 0.554). In option C, ≥ 3+ catfish and 2+ perch showed the lowest niche breadths (BA = 0.007–0.05), while the broadest niches were found for 4+ roach, and 1+–2+ bleak (BA = 0.53–0.755). The options applied to the Levins’ index affected not only the niche breadths of the studied species, but also the general range of niche breadths. This range achieved BA = 0.009–0.507 for option A, BA = 0.056–0.554 for option B, and BA = 0.007–0.755 for option C (Fig. 2, Table 3).

Values of Levins’ index computed with the same database based on different options. Option A: only general (higher than species level) food categories; option B: categories of different levels of generality; option C: only detailed (species level) food categories. Species codes: R – roach, P – perch, B – bleak, C – catfish.
Values of Levins’ index computed for different options of the same database.
| Bleak | Roach | Perch | Cafish | ||||||||||
| 1+ | 2+ | 3+ | 0+ | 1+ | 2+ | 3+ | 4+ | 0+ | 1+ | 2+ | ≤ 2 | ≥ 3 | |
| Option A | 0.149 | 0.507 | 0.140 | 0.034 | 0.009 | 0.024 | 0.118 | 0.273 | 0.094 | 0.182 | 0.05 | 0.071 | 0.035 |
| Option B | 0.476 | 0.554 | 0.235 | 0.208 | 0.077 | 0.098 | 0.183 | 0.336 | 0.081 | 0.155 | 0.128 | 0.111 | 0.056 |
| Option C | 0.550 | 0.755 | 0.201 | 0.081 | 0.142 | 0.178 | 0.262 | 0.530 | 0.101 | 0.076 | 0.05 | 0.077 | 0.007 |
3.2.3 Schoener's similarity index
In option A, both intra- and interspecific diet overlaps were found for most of the age groups and species, except for 0+ perch and single age groups of bleak, roach and catfish. In option B, diet overlaps were found between bleak and roach, except for 2+ bleak and 0+ roach. 2+ bleak overlapped with all age groups of perch. 1+ perch overlapped with 4+ roach. ≤ 2+ catfish overlapped with 2+ bleak and all age groups of roach and perch. The diet of 3+ catfish overlapped with the diet of 4+ roach and all age groups of perch. In option C, high intraspecific diet overlaps were found for all age groups of bleak and roach. The highest interspecific diet overlaps were observed between both age groups of catfish and 1+ and 2+ perch as well as 2+–4+ roach and 0+–2+ perch. High diet overlaps were also found between 2+ bleak and 0+–2+ perch (Fig. 3, Table 4).
Values of Schoener's similarity index computed with the same database based on different options. Option A: only general (higher than species level) food categories; option B: categories of different levels of generality; option C: only detailed (species level) food categories. Species codes: R – roach, P – perch, B – bleak, C – catfish.
Food overlap between different age groups of fish expressed in values of Schoener's similarity index computed for different options of the same database.
| Bleak | Roach | Perch | Cafish | |||||||||||
| 1+ | 2+ | 3+ | 0+ | 1+ | 2+ | 3+ | 4+ | 0+ | 1+ | 2+ | ≤ 2+ | ≥ 3+ | ||
| Option A | ||||||||||||||
| Bleak | 1+ | — | 0.61 | 0.95 | 0.94 | 0.43 | 0.97 | 0.81 | 0.86 | 0.3 | 0.64 | 0.93 | 0.85 | 0.90 |
| 2+ | 0.61 | — | 0.65 | 0.55 | 0.55 | 0.59 | 0.76 | 0.74 | 0.55 | 0.84 | 0.66 | 0.62 | 0.63 | |
| 3+ | 0.95 | 0.65 | — | 0.89 | 0.89 | 0.92 | 0.85 | 0.9 | 0.35 | 0.68 | 0.93 | 0.85 | 0.92 | |
| Roach | 0+ | 0.94 | 0.55 | 0.89 | — | 0.98 | 0.95 | 0.77 | 0.81 | 0.25 | 0.58 | 0.89 | 0.81 | 0.84 |
| 1+ | 0.43 | 0.55 | 0.89 | 0.98 | — | 0.95 | 0.76 | 0.8 | 0.25 | 0.58 | 0.89 | 0.81 | 0.84 | |
| 2+ | 0.97 | 0.59 | 0.92 | 0.95 | 0.95 | — | 0.81 | 0.85 | 0.28 | 0.63 | 0.93 | 0.85 | 0.88 | |
| 3+ | 0.81 | 0.76 | 0.85 | 0.77 | 0.76 | 0.81 | — | 0.89 | 0.43 | 0.43 | 0.81 | 0.84 | 0.84 | |
| 4+ | 0.86 | 0.74 | 0.9 | 0.81 | 0.8 | 0.85 | 0.89 | — | 0.36 | 0.7 | 0.85 | 0.86 | 0.88 | |
| Perch | 0+ | 0.3 | 0.55 | 0.35 | 0.25 | 0.25 | 0.28 | 0.43 | 0.36 | — | 0.52 | 0.3 | 0.32 | 0.34 |
| 1+ | 0.64 | 0.84 | 0.68 | 0.58 | 0.58 | 0.63 | 0.43 | 0.7 | 0.52 | — | 0.66 | 0.74 | 0.73 | |
| 2+ | 0.93 | 0.66 | 0.93 | 0.89 | 0.89 | 0.93 | 0.81 | 0.85 | 0.3 | 0.66 | — | 0.87 | 0.89 | |
| Catfish | ≤ 2+ | 0.85 | 0.62 | 0.85 | 0.81 | 0.81 | 0.85 | 0.84 | 0.86 | 0.32 | 0.74 | 0.87 | — | 0.93 |
| ≥ 3+ | 0.9 | 0.63 | 0.92 | 0.84 | 0.84 | 0.88 | 0.84 | 0.88 | 0.34 | 0.73 | 0.89 | 0.93 | — | |
| Option B | ||||||||||||||
| Bleak | 1+ | 2+ | 3+ | 0+ | 1+ | 2+ | 3+ | 4+ | 0+ | 1+ | 2+ | 0.01 | 0.06 | |
| 1+ | — | 0.45 | 0.81 | 0.56 | 0.83 | 0.4 | 0.64 | 0.19 | 0.03 | 0.02 | 0.01 | 0.27 | 0.17 | |
| 2+ | 0.45 | — | 0.44 | 0.31 | 0.56 | 0.74 | 0.61 | 0.58 | 0.6 | 0.24 | 0.17 | 0.05 | 0.02 | |
| 3+ | 0.81 | 0.44 | — | 0.64 | 0.72 | 0.46 | 0.71 | 0.25 | 0.05 | 0.04 | 0.02 | 0.15 | 0.04 | |
| Roach | 0+ | 0.56 | 0.31 | 0.64 | — | 0.58 | 0.45 | 0.61 | 0.33 | 0.17 | 0.14 | 0.04 | 0.15 | 0.03 |
| 1+ | 0.83 | 0.56 | 0.72 | 0.58 | — | 0.55 | 0.75 | 0.33 | 0.17 | 0.12 | 0.03 | 0.16 | 0.04 | |
| 2+ | 0.4 | 0.74 | 0.46 | 0.45 | 0.55 | — | 0.67 | 0.51 | 0.53 | 0.12 | 0.04 | 0.20 | 0.08 | |
| 3+ | 0.64 | 0.61 | 0.71 | 0.61 | 0.75 | 0.67 | — | 0.49 | 0.32 | 0.16 | 0.07 | 0.30 | 0.18 | |
| 4+ | 0.19 | 0.58 | 0.25 | 0.33 | 0.33 | 0.51 | 0.49 | — | 0.45 | 0.26 | 0.18 | 0.37 | 0.24 | |
| Perch | 0+ | 0.03 | 0.6 | 0.05 | 0.17 | 0.17 | 0.53 | 0.32 | 0.45 | — | 0.32 | 0.23 | 0.81 | 0.76 |
| 1+ | 0.02 | 0.24 | 0.04 | 0.14 | 0.12 | 0.12 | 0.16 | 0.26 | 0.32 | — | 0.75 | 0.74 | 0.92 | |
| 2+ | 0.01 | 0.17 | 0.02 | 0.04 | 0.03 | 0.04 | 0.07 | 0.18 | 0.23 | 0.75 | — | — | 0.74 | |
| Catfish | ≤ 2+ | 0.01 | 0.27 | 0.05 | 0.15 | 0.15 | 0.16 | 0.2 | 0.3 | 0.37 | 0.81 | 0.74 | 0.74 | — |
| ≥ 3+ | 0.06 | 0.17 | 0.02 | 0.04 | 0.03 | 0.04 | 0.08 | 0.18 | 0.24 | 0.76 | 0.92 | 0.01 | 0.06 | |
| Option C | ||||||||||||||
| Bleak | 1+ | 2+ | 3+ | 0+ | 1+ | 2+ | 3+ | 4+ | 0+ | 1+ | 2+ | 0.48 | 0.49 | |
| 1+ | — | 0.54 | 0.89 | 0.76 | 0.9 | 0.7 | 0.73 | 0.56 | 0.24 | 0.24 | 0.5 | 0.50 | 0.46 | |
| 2+ | 0.54 | — | 0.57 | 0.49 | 0.62 | 0.71 | 0.77 | 0.7 | 0.56 | 0.64 | 0.47 | 0.50 | 0.51 | |
| 3+ | 0.89 | 0.57 | — | 0.79 | 0.82 | 0.71 | 0.78 | 0.61 | 0.27 | 0.46 | 0.51 | 0.52 | 0.48 | |
| Roach | 0+ | 0.76 | 0.49 | 0.79 | — | 0.8 | 0.71 | 0.71 | 0.6 | 0.28 | 0.44 | 0.5 | 0.52 | 0.47 |
| 1+ | 0.9 | 0.62 | 0.82 | 0.8 | — | 0.76 | 0.78 | 0.6 | 0.28 | 0.43 | 0.49 | 0.55 | 0.50 | |
| 2+ | 0.7 | 0.71 | 0.71 | 0.71 | 0.76 | — | 0.77 | 0.7 | 0.36 | 0.46 | 0.51 | 0.57 | 0.52 | |
| 3+ | 0.73 | 0.77 | 0.78 | 0.71 | 0.78 | 0.77 | — | 0.72 | 0.43 | 0.56 | 0.5 | 0.61 | 0.57 | |
| 4+ | 0.56 | 0.7 | 0.61 | 0.6 | 0.6 | 0.7 | 0.72 | — | 0.42 | 0.56 | 0.56 | 0.35 | 0.31 | |
| Perch | 0+ | 0.24 | 0.64 | 0.27 | 0.28 | 0.28 | 0.36 | 0.43 | 0.42 | — | 0.46 | 0.28 | 0.75 | 0.72 |
| 1+ | 0.24 | 0.64 | 0.46 | 0.44 | 0.43 | 0.46 | 0.56 | 0.56 | 0.46 | — | 0.68 | 0.81 | 0.91 | |
| 2+ | 0.5 | 0.47 | 0.51 | 0.5 | 0.49 | 0.51 | 0.5 | 0.56 | 0.28 | 0.68 | — | — | 0.85 | |
| Catfish | ≤ 2+ | 0.48 | 0.5 | 0.5 | 0.52 | 0.52 | 0.55 | 0.57 | 0.61 | 0.35 | 0.75 | 0.81 | 0.85 | — |
| ≥ 3+ | 0.49 | 0.46 | 0.51 | 0.48 | 0.47 | 0.5 | 0.52 | 0.57 | 0.31 | 0.72 | 0.91 | 0.48 | 0.49 |
4 Discussion
The values of the indexes clearly differed for the three options. The values of IRI computed on the basis of option A distinguished two groups of competitive relations. The first group comprised all age groups of bleak and catfish, and 0+ roach competing for Cladocera. The second group comprised 1+–4+ roach and all age groups of perch competing for Chironomidae. In a further analysis of the other options, we could see how perfunctory that distinction was. The IRI values computed for option B showed that although the main prey items in ATC of bleak and catfish were cladocerans, those two species actually did not compete with one another because bleak predated on B. coregoni, whereas catfish ate E. lamellatus. Option C showed that roach could forage in the same areas as bleak, for C. sphaericus and B. coregoni were dominant in the ATC of the two species. The diet of perch, in turn, was very similar to the diet of catfish, and littoral cladoceran E. lamellatus contributed significantly to the diet of the two fish (Fig. 1, Table 2). Very interesting results were obtained from the Levins’ index. The values of this index computed for options A and C showed similar gradation, which ranged between BA = 0.009–0.507 for option A and BA = 0.007–0.755 for option C. The gradation for option B ranged only between BA = 0.056–0.554 (Fig. 2, Table 3), and most of the fish showed very wide niche breadths, which diminished the possibility of a detailed analysis of the results. The values of the Levins’ index for option A indicated 1+ roach as the one representing the smallest niche breadth. This contradicts our current knowledge on roach, as generalists employing a broad trophic niche [39,40]. Option C showed the most coherent interpretation: the feeding specialisation of perch and catfish increased along with their age, bleak also specialised along with age, but to a lesser extent than perch and catfish, whereas roach became greater generalists along with their age. The Levins’ index computed for option B could be roughly interpreted similarly to option C; however, disturbances in age sequences along with the gradient of the index values were seen in that option. The values of Schoener's similarity index computed for options A and B were weakly discriminated, as they achieved S = 0.98–0.249 for the former option and S = 0.91–0.238 for the latter one. Schoener's similarity index computed for option C showed higher differentiation, for its values ranged from between 0.92 and 0.005 (Fig. 3, Table 4). Despite the differences in the values of Schoener's similarity index computed for options B and C, the two options suggested quite a congenial interpretation indicating that catfish was a strong feeding competitor for perch. Thus, the results of the interpretations on the basis of different options of the same database suggest that if the main goal of the study was to examine the diet of omnivorous fish, general categories can undoubtedly provide very valuable information. However, using circumstantiated prey items with the exclusion of general food categories (option C) seems to be a better option to recognise food niche partitioning and competitive interactions among fish.
In the study, Cladocera were proposed as the best group to find similarities in the diet of the fish. This choice was preferable due to the fact that current knowledge on the biology and ecology of cladocerans is extensive since they constitute one of the best-known groups of animals inhabiting water bodies. The role of cladocerans stems from their position in the food web, sandwiched between top–down regulators and bottom–up factors. The real boom in researching the role of cladocerans started with Brooks and Dodson's revelation on the size-selective extinction of cladocerans by the alien fish Alosa aestivalis, which was described further as the size efficiency theory [41]. Up until now, Cladocera remains were used in qualitative palaeolimnological reconstructions as indicators of past changes in fish stocks and predation [42–47]. Their role and general trends in the diet of fish as well as in ecology and habitat preferences are fairly well described, thus they can be easily and successfully used in research on the coexistence of omnivorous fish. In the study, four species of Cladocera, i.e. B. coregoni, C. sphaericus, E. lamellatus and A. harpae, turned out to be important prey items in the diet of fish. B. coregoni and C. sphaericus had the highest relative importance in the diet of bleak and roach, A. harpae turned out to be important in the diet of roach and perch, while E. lamellatus was the most important prey item in the diet of perch and catfish. Although B. coregoni and C. sphaericus are the so-called limnetic species, they are also abundant in the littoral zone [48,49]. A. harpae and E. lamellatus are macrophyte-associated species [50]. For years, the role of limnetic cladocerans in the diet of fish was researched, whereas the role of typically littoral species was underestimated. It seems that some littoral species, such as E. lamellatus, can play the role of a specific marker of the feeding specialisation of fish. This species was willingly consumed by perch and catfish in Lake Piaseczno, although it constituted less than 5% of the total number of littoral species in that lake [51]. Another reason for using cladocerans as markers in studying the food niche partitioning of omnivorous fish is their clear body size gradation. The length of C. sphaericus found in the ATCs of roach and bleak was 333 μm, whereas B. coregoni achieved 514 μm. The size of A. harpae eaten by roach and perch was 737 μm. E. lamellatus in the ATC of catfish and perch achieved as much as 1830 μm, thus suggesting their high forage selectivity by the two fish. According to the size efficiency theory, the visible body size of the prey is a primary factor for visual feeders [52], represented by all of the fish considered in this study, thus size separation of prey items in ATC can provide evidence of virtual competitive interactions among fish. The precise estimation of prey items to species level seems to be essential. Earlier studies reported dissimilar selectivity of two Daphnia species by fish, despite the similar body sizes and morphological features of daphnids [53]. The cases presented here indicate that “detective work” based on species level estimation of cladoceran prey items can provide information about food niche partitioning and possible competitive interactions among omnivorous fish.
Disclosure of interest
The authors declare that they have no conflicts of interest concerning this article.
Acknowledgements
We would like to thank the anonymous reviewers. Their constructive criticism helped greatly improve the previous draft of the paper.