

Version abrégée
Cet article présente une étude systématique par microspectroscopie Raman des phases de silice présentes dans l'impactite du cratère de Chicxulub, au Mexique. Les spectres Raman ont été enregistrés sur deux appareils différents, mais complémentaires. D'une part, nous avons utilisé un spectromètre triple monochromateur Jobin-Yvon T64000, réglé en mode soustractif, avec une détection multicanal CCD refroidie à 77 K et une excitation laser λL =514,5 nm. Les échantillons ont été analysés avec un microscope Olympus (objectif ×100). La résolution spectrale expérimentale obtenue sur les spectres est de ±1 cm−1, avec une largeur spectrale de fentes de 2 à 2,5 cm−1. D'autre part, nous avons recueilli les spectres à l'aide d'un spectromètre Raman Bruker à transformée de Fourier, avec une excitation nm fournie par un laser . Dans ce dernier cas, nous avons réalisé les expériences, soit sous microscope (objectif ×40), soit en mode macroscopique, lorsque le signal était trop faible, avec une résolution spectrale effective de ±2 cm−1. Sur les deux montages, la puissance du faisceau laser était comprise entre 200 et 250 mW.
Nos résultats ont été obtenus sur quatre sections fines et polies de la roche de Chicxulub, avec une résolution spatiale minimum de l'ordre de 2 μm sous microscope, permettant l'examen de grains de petites dimensions.
La figure présente quatre spectres typiques obtenus entre 100 et 1 000 cm−1. Les fréquences Raman observées pour chacune des sections sont reportées dans les tableaux I et II. Dans le tableau I, nous avons rassemblé également les résultats publiés par Scott et Porto [14] pour le quartz α et par Sharma et al. [15] pour la coésite, ainsi que les fréquences des bandes Raman de la coésite synthétique et des roches choquées de l'Arizona. Le tableau I nous permet ainsi de comparer les spectres que nous avons obtenus avec les données expérimentales existantes [2,3,7–9,11,13–16] pour le quartz cristallin, les quartz choqués, les quartz soumis en laboratoire à de hautes pressions et les polymorphes du quartz, tels que la coésite.
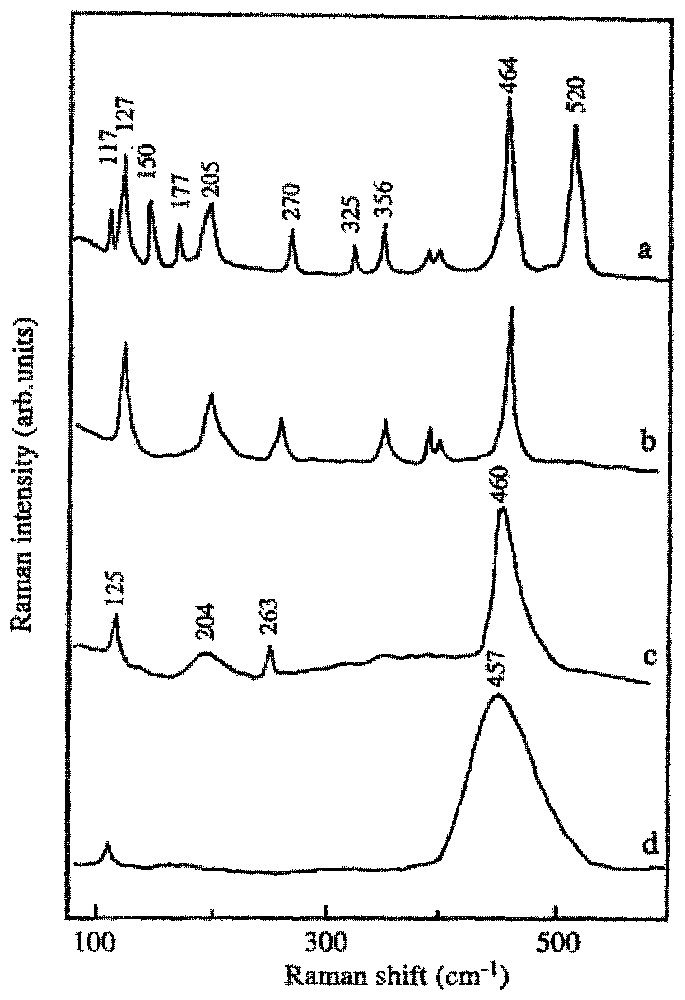
Raman spectra of impactite samples from Chicxulub crater showing different phases: a, coesite + crystallized quartz; b, crystallized quartz; c, shocked quartz, intermediate crystallized; d, shocked disordered natural quartz.
Spectres Raman de l'impactite du cratère de Chicxulub, mettant en évidence différentes phases : a, coésite + quartz cristallin ; b, quartz cristallin ; c, quartz choqué à désordre intermédiaire ; d, quartz naturel choqué hautement désordonné.
Raman peaks (cm−1) for Chicxulub impactites, natural/synthetic coesite (CS) and quartz (QZ) between 100 and 1 300 cm−1.
Position des bandes Raman (cm−1) pour l'impactite de Chicxulub, les coésites naturelle et synthétique (CS), et le quartz (QZ) entre 100 et 1 300 cm−1.
| Peak | Coesite 1 | Coesite 2 | R79–2 | R77–17 | Coesite, | Quartz 4 |
| attribution | Chicxulub | Chicxulub | Arizona 3 | |||
| CS | 116 s | 116 s | 117 s | – | 115.9 m | – |
| QZ | 127 s | 127 m | 127.8 m | 128 s | ||
| CS | 150.5 m | 151 m | 150 m | – | 151 m | – |
| CS | 175.5 s | 176 s | 177 s | – | 175.7 s | – |
| CSQZ | 203.5 m | 204 m | 205 m | 205 m | 205 m | 207 s, bd |
| QZ | – | – | – | 264 m | – | 264 m |
| CS | 268 s | 269 s | 270 s | – | 271 s | – |
| CS | 325.7 m | 326 m | 325 m | – | 325 m | – |
| CSQZ | 354.7 m | 355 m | 356 m | 356 m | 355 m | 356 m |
| QZ | – | – | – | 395 m | – | 395 m (sh) |
| QZ | – | – | – | – | – | 401 w |
| CS | 425.5 m | 427 m | – | – | 425 m | – |
| QZ | 465.6 m | 466 m | 464 m | 464 m | 463 vs | 464 vs |
| CS | 520 vs | 521 vs | 520 s | – | 521 s | – |
| QZ | – | – | – | 695 w | – | 696 w |
| CS | – | 785 w | – | – | – | – |
| QZ | – | – | 794 w | 795 w | – | 795 w, sh |
| QZ | – | – | 804 w | 806 w | – | 807 w |
| CS | – | 815 w | – | – | – | – |
| CS | – | 837 w | 834 w | – | – | – |
| CS | – | 1 036 w | – | – | – | – |
| CSQZ | – | 1 065 w | 1 064 w | 1 065 w | – | 1 066 w, sh |
| QZ | – | – | 1 081 w | 1 082 w | – | 1 083 w |
| CS | – | 1 144 w | – | – | – | – |
| CSQZ | – | 1 164 w | 1 160 w | 1 162 w | – | 1 161 w |
| QZ | – | – | 1 232 w | 1 230 w | – | 1 231 w |
Raman peaks and widths (cm−1) for well crystallized (1), intermediate (2) and disordered quartz (3) from Chicxulub impactite between 100 and 600 cm−1.
Position et largeurs des bandes Raman (cm−1) entre 100 et 600 cm−1 pour le quartz cristallin (1), à désordre intermédiaire (2) et hautement désordonné (3) présents dans l'impactite de Chicxulub.
| MODES | 1 | 2 | 3 |
| E (t) + E (l) | 128 | 122–125 | (120–123) |
| A1 (broad) | 207 | 200–204 | – |
| E (t) + E (l) | 265 | 260–263 | – |
| A1 (weak) | 356 | (353) | – |
| E (t) | 394 | – | – |
| E (l) | 401 | – | – |
| A1 (strong) | 464 | 458–460 | 455 |
| Half-width (Γ) of | |||
| 5 | 10–15 | >30 | |
| 464 cm−1 band |
En premier lieu, nous déterminons avec certitude que la roche de Chixculub contient trois polymorphes de silice : le quartz α et deux variétés de haute pression – la coésite et le quartz désordonné. Les résultats sont rassemblés dans le tableau II. Le quartz α est identifié par une bande Raman intense à 464 cm−1. La présence de coésite est vérifiée par les bandes Raman à 521, 425, 355, et 271 cm−1, caractéristiques de cette phase. Enfin, l'existence de quartz désordonné est confirmée par les variations du profil spectral de la bande intense, correspondant à la vibration à 464 cm−1 des liaisons SiOSi du quartz cristallin. En effet, il ressort que l'analyse du profil spectral de cette bande est un critère quantitatif pour la détermination de la cristallinité et du degré de désordre des phases en présence. Dans le quartz cristallin, cette bande Raman correspond au mode vibrationnel respiratoire de type A1 du tétraèdre SiO4. Lorsque le désordre structural augmente, on observe que sa position est décalée vers des nombres d'onde inférieurs, jusqu'à 455 cm−1 dans le quartz désordonné (figure ; tableau II).
Des études antérieures par spectroscopie Raman sous hautes pressions conduites par McMillan et al. [11] sur des monocristaux de quartz montrent clairement un phénomène identique lorsque la pression augmente. Pour des pressions de 21,7, 25,8 et 31,4 GPa, on observe cette vibration à 463, 461 et 455 cm−1, respectivement. Ce phénomène s'accompagne également d'un élargissement de la bande, mesuré par la demi-largeur à mi-hauteur réelle Γ donnée par la formule de Irmer [6]. Ce paramètre Γ est lié à la cristallinité des phases examinées. Une augmentation de Γ signifie un désordre croissant et une perte de cristallinité.
L'élargissement et le décalage vers les basses fréquences de cette bande peut être expliqué par le fait que les distances moyennes entre atomes augmentent sous l'effet d'une légère expansion du réseau. De plus, lorsque le désordre s'installe, des irrégularités dans les longueurs et les angles de liaison apparaissent du fait, soit de la brisure des pontages SiOSi entre les tétraèdres, soit de phénomènes de réorientation stérique affectant l'organisation des tétraèdres dans le réseau et qui conduisent à la rupture de la symétrie de translation. Ces effets vont entraı̂ner des modifications du profil de la bande Raman A1, ainsi qu'une diminution de son intensité. On observe des changements similaires, bien que moins bien résolus, en spectroscopie infrarouge [5]. Dans le quartz α,Γ est de l'ordre de 5 cm−1. Dans le quartz à désordre intermédiaire et les quartz hautement désordonnés, Γ augmente de 10 à 30 cm−1. Le spectre Raman de la phase de quartz désordonné présente dans l'impactite de Chixculub est constitué d'un mode principal à 455 cm−1, dont la demi-largeur à mi-hauteur est au moins de 30 cm−1. Nous remarquons également l'absence de signal Raman provenant de verre diaplectique dans nos échantillons, alors que cette phase est observée sur des échantillons choqués en laboratoire. Les observations expérimentales que nous avons collectées dans le cadre de cette étude nous permettent ainsi d'estimer que l'impactite de Chixculub a été formée à des pressions maximum de l'ordre de 30–31 GPa. Nous confirmons donc que la roche de Chicxulub est d'origine explosive, consécutivement à un impact de grande ampleur.
Finalement, ces expériences démontrent que la microspectroscopie Raman est une méthode de microanalyse puissante pour l'étude des processus de désordre structural et pour l'identification formelle de polytypes de la silice. C'est une technique fiable, précise, rapide et particulièrement facile à mettre en œuvre, même sur des échantillons non préparés. Le fait que des micrograins de l'ordre de quelques micromètres puissent être analysés de façon non destructive, soit en sections polies, soit in situ dans la masse, représente un avantage expérimental sur des spectroscopies plus classiques, comme l'absorption infrarouge.
1 Introduction
The aim of this paper is to present Raman spectroscopy experiments carried out on natural silica varieties of the Chicxulub crater (Mexico). From the mineralogical standpoint, these phases are interesting because they were likely formed in explosive events at very high pressure. Although the origin of silica polytypes from Chicxulub is not settled yet, they are believed to be impactites. In this work we provide further evidence of this origin.
It is generally accepted that usual X-ray diffraction methods applied to glassy materials are not very sensitive to local or intermediate-range order. Therefore, optical spectroscopies are necessary to gain further insights in these systems. An advantage of employing both Raman and IR techniques is that vibrational spectroscopy gives information on the short-range ordering and, therefore, clearly has a higher sensitivity than X-ray diffractometry in the investigation of samples with strong structural distortions.
On the one hand, Raman scattering is well adapted for the study of disordered materials, particularly in the case of disordered silica, high-pressure polymorphs and synthetic glasses [8–10,18]. On the other hand, spectroscopic properties of the high-pressure polymorphs and the shock textures of rocks have been used to interpret impact processes [16]. Before the availability of micrograin techniques, the positive identification of fine-grained coesite and other high-pressure phases was made only on extracts. In situ measurements were not acquired and critical information was lost [7]. With the recent development of micro-Raman techniques, the Raman microprobe (RMP) is emerging as an important tool in mineralogical research [12,13] and, in particular, in the case of in situ studies of high-pressure polymorphs of silica in shock-metamorphosed rocks.
2 Experimental details
In this study, four polished thin sections from Chicxulub were examined with RMP. Their Raman spectra were recorded using the λL=514.5 nm line of an Ar+ laser with a Jobin-Yvon T64000 spectrometer equipped with a multichannel charge-coupled device (CCD) detector cooled at 77 K. The samples were analysed under an Olympus microscope with a 100× objective, giving 2 μm spatial resolution. The spectral slit width was 2–2.5 cm−1, yielding an experimental spectral resolution of ±1 cm−1. Fourier-transform Raman spectra were carried out with a Bruker instrument using the 1 064 nm excitation line of a Nd : YAG laser both in microscopic and macroscopic modes with an actual spectral resolution of ±2 cm−1. In both cases, the beam power was kept between 200 and 250 mW.
3 Results and discussion
3.1 Raman spectra
The figure shows four of the recorded typical Raman spectra in the spectral range 100–1 000 cm−1 obtained from the Chixculub impactite. The frequencies of all the observed lines for each thin section are given in tables I and II. Table I summarizes also the data published by Scott and Porto [14] for α-quartz and by Sharma et al. [15] for coesite, and the Raman lines of synthetic coesite and shocked rocks from Arizona.
It is clear from the results that the Chicxulub rock contains mostly three polymorphs of silica: the original α-quartz and two high-pressure varieties – coesite and disordered quartz. α-quartz can be identified instantly on the basis of its intense Raman line at 464 cm−1. Fine-grained crystals of coesite were easily identified in situ by their characteristic Raman lines at 521, 425, 355, and 271 cm−1. The strongest line at 521 cm−1 has been assigned to a symmetric SiOSi stretching mode (A1 vibrational mode), correlating with the 464 cm−1 mode of α-quartz. These two strongest lines (521 and 464 cm−1) are sufficient to distinguish unambiguously these two crystalline forms of SiO2. It is thus clear that these samples contain at the same time coesite and quartz because some quartz lines occur in all the natural coesite (figure, a). This fact was confirmed by Boyer et al. [2] in Raman spectra of natural coesites from three different geological environments: eclogite-facies rocks.
The Raman spectrum of well crystallized α-quartz exhibits bands at 128 (s), 206 (s, bd), 356 (m), 395 (m, sh), 464 (vs), 696 (w), 795 (w, sh), 806 (w), 1 082 (w), 1 160 (w) cm−1 (figure, b). The detailed identification of the vibrational modes of different forms of silica has been made in previous publications by several authors who assigned all of the observed bands [1,3,4,15]. In accordance with these data, the strongest band in the spectrum of quartz at 464 cm−1 is due to a symmetrical stretch vibration (tetrahedron breathing). It is also known from the infrared spectra of various silicate materials that the asymmetric SiO stretch is in the 1 200–900 cm−1 region, while the symmetric stretch has been assigned to the 800–600 cm−1 region.
Disorder in quartz greatly influences its Raman spectra (figure, c and d). Upon decreasing the degree of lattice ordering, the bands of internal vibrations characterizing the interatomic motions in the tetrahedra become less intense and less sharp, in good correspondence with the infrared spectrum [5]. In addition, as quartz becomes increasingly disordered, the vibrational frequencies of all bands are clearly lowered (table II). The frequency shift can be attributed to the decreasing degree of crystallinity.
The shift towards lower wavenumbers was observed especially for the band around 464 cm−1. Similar frequency changes should be expected for the corresponding infrared vibration, but have never been described. Perhaps the much greater width of the infrared bands, in contrast to the narrow Raman bands, might be one reason that in the infrared spectrum band shifts cannot be as clearly observed as in the Raman spectrum: e.g., the internal vibrational band at about 1 080 cm−1 has, even in the infrared spectra of ordered quartz, a half-width of about 100–120 cm−1 [17].
The shift of the main Raman bands toward lower wavenumbers indicates that in general the average distances between atoms become somewhat larger, i.e., that the lattice is slightly expanded. The increase in band half-widths and the accompanying decrease of intensity can be interpreted in such a way that, during disorder, the distribution of bond lengths and bond angles within and between SiO4 tetrahedra becomes increasingly irregular. Both line broadening and decreasing intensity are especially clear for the main band at about 464 cm−1 in well ordered quartz. In the Raman spectra of the intermediate quartz, this band shifts toward 461 cm−1; and besides, three low-frequency bands (401, 392, 354 cm−1) are absent too. In samples with a high degree of disorder only one broad and weak band at about 455 cm−1 is observed (sometimes the 122 cm−1 band is observed also). In this case, most of all low-frequency bands disappear.
It is very important to indicate here that the same phenomenon was observed by McMillan et al. [11], who carried out a Raman spectroscopic study of single crystals of quartz samples shocked at peak pressures between 14.5 and 31.4 GPa. For example, compared with the unshocked sample, the 21.7 GPa sample shows small frequency shifts for most of the peaks (of order 1–2 cm−1), to both higher and lower wavenumber. These peak shifts are more pronounced in the 25.8 GPa sample. The 31.4 GPa sample shows even more marked frequency shifts for the peaks of crystalline quartz, accompanied by considerable broadening of the quartz bands near 455, 800 and 1 060 cm−1. The prominent band at about 464 cm−1 in unshocked samples shifts clearly to lower wavenumbers in shocked samples: 463 cm−1 (21.7 GPa), 461 cm−1 (25.8 GPa), 455 cm−1 (31.4 GPa). The peak frequencies for the 14.5 GPa shocked sample are identical to those found for the unshocked quartz. However, between 21.7 and 31.4 GPa, the A1 modes at 464 cm−1 and 206 cm−1 and the E mode at 128 cm−1 show smooth but non-linear decreases in frequency with increasing shock pressure. A simple interpretation of this result is that the shocked crystalline quartz remains under tensile stress relatively to the unshocked sample. For this shocked quartz sample, an additional broad shoulder near 500 cm−1 and a broad band at 608 cm−1 are clearly observed in the spectrum and are definitely characteristic of the presence of diaplectic glass. In the RMP spectra of disordered Chicxulub quartz, we did not observe these bands. We explain the absence of diaplectic glass in the impactite by the fact that this event implies a very large body. Diaplectic glass is the amorphous phase, which may have formed by pressure induced amorphization of the crystalline quartz lattice during a low temperature event. Consequently, both shock timescale and shock heating in a natural, colossal impact event are much higher than in laboratory experiments. The former process should have been completed over few seconds at very high temperature, while the latter is extremely short – of the order of few microseconds. Thus, by comparing our results with those obtained in laboratory experiments, we can assume, with good accuracy, that the formation of disordered quartz in the Chicxulub impactite occurred at least in the 26–31 GPa pressure range, and more likely at a maximum pressure of 31 GPa.
3.2 Estimation of crystallinity
The increasing degree of ordering and the decrease of crystallinity are intimately linked to the decreasing order of the lattice. Consequently, the increasing irregularities of bond lengths and of interatomic distances must be seen as the main source of disorder. Therefore, using vibrational spectroscopy analysis, the increasing bandwidths are more expressive for estimating the degree of lattice disorder than are the changes in their spectral positions [13]. Following Irmer [6], we calculated the actual half-width Γ listed in table II by using the equation , where Γs is the measured half-width and s the spectral slit width.
The half-width of the intense Raman band at about 464 cm−1 appears to be the best tracer for investigating changes connected with structural ordering. Half-width values of about 5–7 cm−1 characterize a well ordered sample. Intermediate disordered quartz shows Γ values between 10–15 cm−1, while in highly disordered samples Γ⩾30 cm−1 (table II).
The RMP measurements, performed with high spatial resolution down to about one micrometer, allow investigation not only of individual crystals or grains but also of thin sections or unprepared rock samples. Because of much simpler sample preparation, Raman spectroscopy can be more widely used than infrared spectroscopy. Furthermore, compared with infrared measurements, RMP spectroscopy affords higher lateral resolution, because of the considerable smaller wavelengths of the exciting light.
4 Conclusions
In conclusion, the coexistence of two crystalline forms of SiO2, i.e., coesite and disordered quartz in impactites from Chicxulub has been ascertained by their Raman spectra. While these spectra are extremely sensitive to short-range order, they also yield information about the overall disorder. Therefore, it turns out that the structural order of quartz can be well characterized by RMP spectroscopy. Frequency shift, band broadening, as well as Raman intensity appear to depend strongly on the degree of ordering. By measuring the half-width of the SiO Raman band at about 464 cm−1, the degree of lattice disorder can be estimated even in highly disordered quartz. Samples shocked at high pressure in laboratory display Raman features very similar to those obtained from the Chixculub impactite. Thus, there is a good deal of evidence that the Chixculub rock has undergone a shock metamorphism. Consequently, RMP spectroscopy is a powerful micro-analytical method for investigating the process of structural disordering. Additionally, Raman spectrometry, applied to those materials, is a highly reliable probe, as well as being relatively convenient, rapid and, in particular, non-destructive.