

Version abrégée
1 Introduction
L'agglomération de la ville de Ho-Chi-Minh (HCM), anciennement ville de Saigon, au Sud-Vietnam, avec une population de plus de 5 millions d'habitants, est confrontée à un énorme problème d'alimentation en eau potable, à la fois pour les besoins domestiques et pour les besoins industriels. Le plus gros problème provient de la pollution des nappes aquifères superficielles. La pollution est d'abord d'origine naturelle, par invasion de l'eau de mer dans les régions côtières, la ville de HCM étant située seulement à 45 km à vol d'oiseau de la mer de l'Est et communiquant avec elle par plusieurs fleuves (Fig. 1) et par lessivage des dépôts de sel laissés durant les différentes transgressions du Tertiaire et surtout du Quaternaire. La pollution est ensuite d'origine humaine, à cause des énormes concentrations de population le long des cours d'eau qui sillonnent l'agglomération.
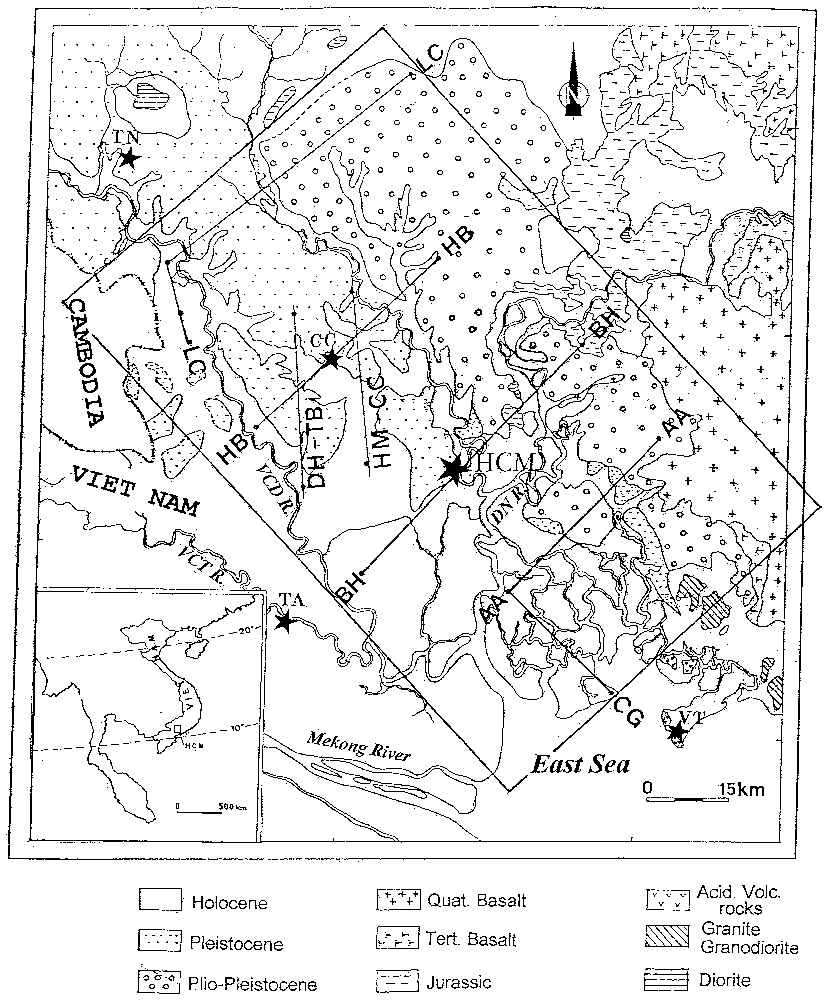
Location of the studied area (rectangle) on the simplified geological map of the northeastern border of the Mekong Delta around the agglomeration of HCM City. Stars: centres of HCM City and of some surrounding towns cited in the text (VT: Vung-Tau; TN: Tay-Ninh; TA: Tan-An). Principal Rivers: R. (DN: Dong-Nai; VCT: Vam-Co-Tay; VCD: Vam-Co-Dong). Lines: geoelectrical profiles (DH-TB; HM-CC; LC; HB; BH; AA; CG).
Emplacement de la région étudiée (rectangle) sur fond de carte géologique simplifiée de la bordure nord-est du delta du Mékong autour de l'agglomération de HCM. Étoiles : centres de HCM et de quelques villes principales citées dans le texte (VT : Vung-Tau ; TN : Tay-Ninh ; TA : Tan-An). Principales rivières : R. (DN : Dong-Nai ; VCT : Vam-Co-Tay ; VCD : Vam-Co-Dong). Lignes droites : profils géoélectriques (DH-TB ; HM-CC ; LC ; HB ; BH ; AA ; CG).
Les travaux de recherche hydrogéologique au Sud-Vietnam ont débuté dès 1930, sous la colonisation française [6], ont été poursuivis pendant la guerre par les Américains [1] et, depuis 1975, par différents organismes publics vietnamiens. De nombreux forages ont été effectués dans l'agglomération de HCM et ont permis de trouver des aquifères superficiels dans les sédiments quaternaires (Holocène, Pléistocène), et d'autres plus profonds, jusqu'à 200 m environ, dans les sédiments tertiaires (Pliocène, Miocène). Malheureusement, certains aquifères sont pollués par un taux de minéralisation excessif, dépassant une concentration équivalente à 1 g de chlorures par litre, norme admise pour l'eau potable.
Il est donc important de définir une méthodologie géophysique capable de délimiter les zones polluées, aussi bien près de la surface qu'en profondeur, afin de mieux comprendre le processus de contamination des nappes aquifères et de guider l'implantation des forages dans la recherche des nappes d'eau douce.
Parmi les méthodes géophysiques appliquées aux recherches hydrogéologiques, c'est la méthode de sondage électrique (SE) qui est de loin la plus utilisée [7,8]. En effet, il existe un bon contraste électrique entre les aquifères d'eau douce (d'une résistivité de quelques centaines d' m) et les aquifères d'eau salée (quelques m). Malheureusement, la profondeur d'investigation des SE est très limitée, de l'ordre de 1/4–1/10 de la longueur de la ligne d'injection de courant dans le dispositif Schlumberger. Pour des raisons d'ordre pratique, cette longueur est généralement limitée à 1000 m maximum. L'originalité de la méthodologie adoptée durant la présente étude consiste en l'utilisation conjointe de deux méthodes complémentaires : le SE pour l'exploration superficielle, jusqu'à une centaine de mètres de profondeur, et le sondage magnéto-tellurique (SMT) pour l'exploration profonde jusqu'à plusieurs centaines de mètres de profondeur [2,5]. La méthode combinée SE/SMT a été appliquée avec succès le long de deux profils DH-TB et HM-CC, situés au nord-ouest de HCM (cf. Fig. 1) [4,5]. Nous présentons dans cet article les résultats complets comportant cinq profils supplémentaires, LC, HB, BH, AA et CG (Fig. 1), et un total de 60 stations réparties sur les sept profils, couvrant une large région autour de l'agglomération de HCM (délimitée par le rectangle sur la Fig. 1). Au niveau de chaque station, les données SE et SMT sont obtenues sous forme de courbes de sondage, qui représentent respectivement la courbe de résistivité apparente en fonction de l'écartement des électrodes d'injection (2–1000 m) pour les données SE et la courbe de résistivité apparente en fonction des fréquences (3–2500 Hz) pour les données SMT. Un exemple de ces courbes de sondage a été donné dans l'article publié précédemment [5].
Après inversion des données SE et SMT, il est possible de réaliser une tomographie électrique de la région étudiée, en dressant les cartes de l'image électrique du sous-sol à différentes profondeurs, et en établissant leur relation avec la qualité des nappes d'eau souterraine.
2 Cadres tectonique et géologique
Les roches les plus anciennes rencontrées dans le delta du Mékong sont des roches cristallines du Précambrien au Paléozoı̈que [1]. Sur la bordure nord-est du delta, on observe l'existence des collines de rhyolite, de dacite et de granite hercynien, alignées suivant la direction nord-ouest de Vung-Tau (VT) à Tay-Ninh (TN) (Fig. 1). Cette direction structurale correspond au fossé tectonique du delta du Mékong, dans lequel se déposent d'épaisses séries mésozoı̈ques. La subsidence de ce fossé vers la fin du Tertiaire (Néogène) entraı̂ne le dépôt d'anciennes alluvions du Pliocène jusqu'au Pléistocène, affleurant principalement sur la bordure nord-est du delta et contenant les plus importants réservoirs d'eau douce. La partie sud-ouest est entièrement recouverte par des alluvions quaternaires récents (Holocène) dont les réservoirs contiennent plutôt de l'eau salée ou saumâtre.
3 Relation entre la résistivité des nappes aquifères et la qualité de l'eau
Dans un réservoir saturé d'eau, la contenance en eau peut être représentée par la porosité du réservoir. C'est le cas général des aquifères dans le delta du Mékong, dont les roches- réservoirs sont constituées de sables et de graviers. On peut alors adopter une relation empirique simplifiée entre la résistivité électrique du réservoir et sa porosité, relation connue sous le nom de loi d'Archie [3] :
Il est important de connaı̂tre la valeur de ρe qui dépend de la concentration équivalente C en NaCl. On trouve dans Keller et Frischknecht [3], une série de courbes donnant ρe en fonction de C pour différentes températures.
La qualité de l'eau souterraine dépend principalement de sa salinité, c'est-à-dire de la concentration C. Le Tableau 1 montre la correspondance entre cinq « qualités » usuelles d'eau, caractérisées par leur concentration C et leur résistivité ρe, obtenue à partir des courbes de Keller et Frischknecht à la température de 20 °C. À partir de la loi simplifiée d'Archie, nous pouvons tracer les courbes de variation de la résistivité du réservoir en fonction de sa porosité pour les cinq qualités considérées de l'eau (Fig. 3). En adoptant une certaine hypothèse sur la porosité, il est possible d'en déduire la qualité de l'eau connaissant la résistivité du réservoir.
Correspondence between the quality of the groundwater characterised by its sodium chloride concentration C, and its resistivity ρe at temperature 20 °C (from [3]).
Correspondance entre la qualité de l'eau souterraine caractérisée par sa concentration C en chlorure de sodium, et sa résistivité ρe, à la température de 20 °C (d'après [3]).
| Groundwater quality | Concentration C (g l−1) | Resistivity m) |
| Salty (seawater) | 30 | 0.2 |
| Brackish | 7.5 | 0.8 |
| Mineralised | 2 | 3 |
| Potable | 0.4 | 15 |
| Fresh | 0.1 | 60 |

Graph of bulk resistivity of aquifer versus reservoir porosity for five usual groundwater qualities according to the simplified Archie's law.
Graphes de la résistivité des aquifères en fonction de la porosité du réservoir pour cinq qualités usuelles de l'eau souterraine, d'après la loi d'Archie simplifiée.
4 Coupes géoélectriques SE et SMT le long du profil BH
L'inversion des données SE et SMT le long d'un profil permet de dresser les coupes géoélectriques correspondantes, donnant la distribution de la résistivité du sous-sol le long d'une section verticale. Les résultats de l'inversion concernant deux profils, DH-TB et HM-CC, ont été publiés dans un article précédent [5]. À titre d'exemple, nous présentons ici les résultats obtenus le long d'un nouveau profil BH, long de 60 km environ, composé de 10 stations et traversant l'agglomération de HCM (cf. Fig. 1).
Sur la Fig. 2 sont donnés respectivement en (a) et en (b) les coupes géoélectriques SE et SMT du profil BH. Comme il a déjà été observé sur les anciens profils [5], la coupe géoélectrique SE donne plus de détails sur la structure superficielle jusqu'à 200 m de profondeur environ (Fig. 2a), tandis que la coupe SMT permet d'obtenir des informations à plus grande profondeur, jusqu'à 800 m environ (Fig. 2b). L'existence de trois forages carottés à proximité du profil BH permet de corréler les coupes géoélectriques avec la stratigraphie. On peut constater ainsi que, dans la partie sud-ouest du profil, les sédiments quaternaires sont plus conducteurs ( m), probablement à cause de la présence d'eau salée ou saumâtre (Fig. 2a). L'existence de nappes saturées d'eau salée très conductrice (couleur rouge : m) indique une forte porosité de ces nappes de l'ordre de 40 %, d'après les graphes de la Fig. 3. En adoptant, en première approximation, cette valeur de porosité pour tous les aquifères (axe vertical correspondant à 40 % sur la Fig. 3), il est possible d'établir une échelle de la qualité de l'eau en fonction de la résistivité des aquifères (échelle indiquée sur la partie droite des Figs. 2 et 4). On observe ainsi l'existence probable de nappes d'eau douce potable (couleur bleue) très locales dans les aquifères néogènes, superficiels à l'extrémité nord-est du profil, et plus profonds au sud-ouest. Au-dessous, on trouve les schistes argileux imperméables du Mésozoı̈que (ρ≈100– m) et le socle très résistant ( m) de roches ignées (Fig. 2b), ces deux éléments étant tous deux dépourvus de nappes aquifères.
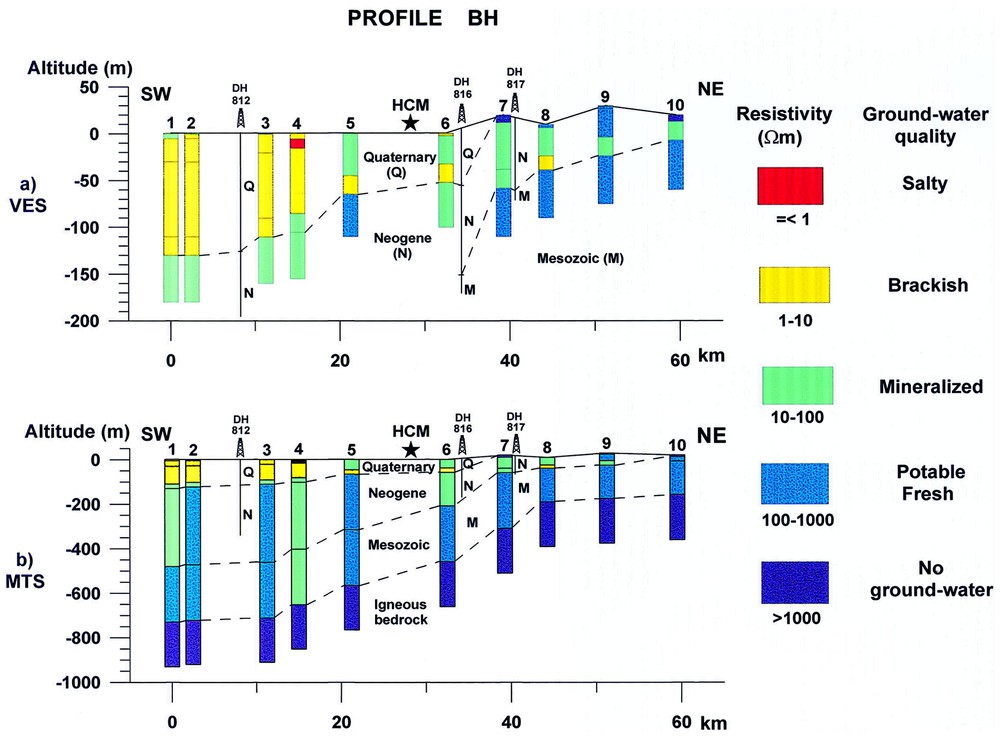
Geoelectrical cross-section along the profile BH. Star: centre of HCM City. Drill-holes: DH 812, 816, 817. a: VES geoelectrical cross-section; b: MTS geoelectrical cross-section.
Coupe géoélectrique le long du profil BH. Étoile : centre de HCM. Forages : DH 812, 816, 817. a : Coupe géoélectrique des résultats de SE ; b : coupe géoélectrique des résultats de SMT.
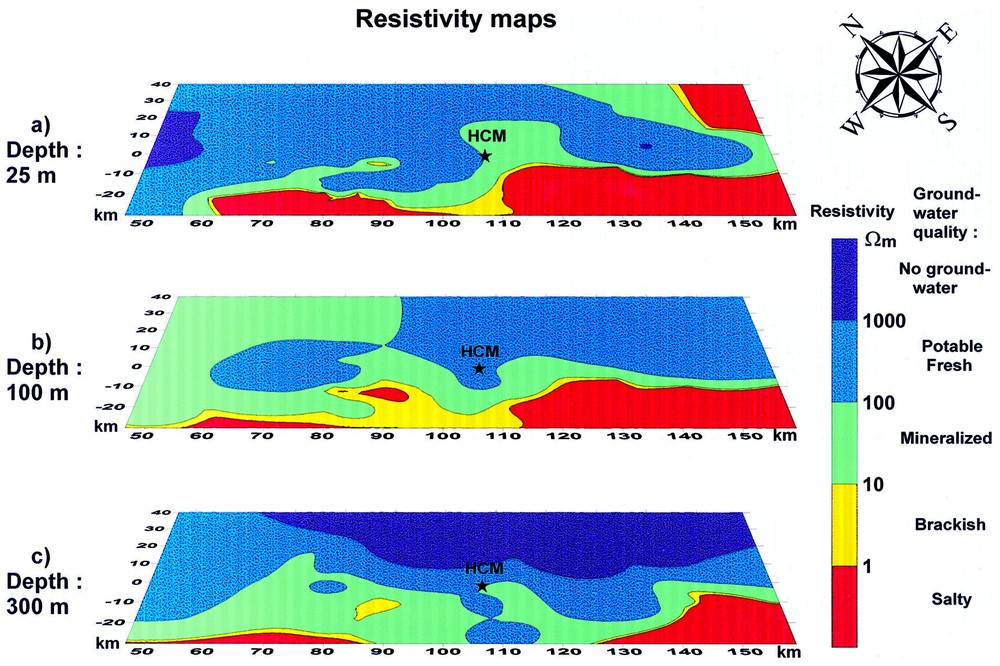
Electric tomography of the studied area: resistivity maps at three depths: (a) 25 m; (b) 100 m; (c) 300 m.
Tomographie électrique de la région étudiée : cartes de résistivité à trois profondeurs : (a) 25 m ; (b) 100 m ; (c) 300 m.
5 Tomographie électrique : évaluation de la qualité des ressources d'eau souterraine
Au total, sept profils ont été ainsi interprétés dans la région étudiée (un rectangle de 117×75 km, Fig. 1), donnant une image électrique du sous-sol de la surface, jusqu'à 800 m de profondeur environ. Il est donc possible de construire une tomographie électrique de cette région en traçant les cartes de résistivité à différentes profondeurs. La Fig. 4 montre trois cartes de résistivité, correspondant respectivement aux profondeurs 25, 100 et 300 m.
La carte de profondeur 25 m (Fig. 4a) montre dans sa partie sud-ouest l'existence de larges zones d'eau salée et saumâtre (couleurs rouge et jaune). Les zones d'eau douce (couleur bleue) se trouvent dans les parties nord et est de la carte, et localement au sud-est de HCM. Sur la bordure nord-ouest de la carte, on observe une petite zone très résistante (couleur pourpre : m), qui peut s'expliquer par l'existence d'une couverture latéritique. Il a été démontré que cette couverture constituait un excellent réservoir d'eau douce dans les parties hautes du relief [4,5]
Sur la carte de profondeur 100 m (Fig. 4b), la zone salée et saumâtre remonte vers le nord-ouest de HCM, autour de la ville de Cu-Chi (CC sur la Fig. 1). L'eau minéralisée (zone verte) s'étend largement au nord et au nord-ouest de HCM.
Sur la carte de profondeur 300 m (Fig. 4c), la zone d'eau douce se réduit à une bande étroite le long de la bordure nord-est du delta du Mékong. Elle pourrait se prolonger par un diverticule sud-ouest vers la ville de Tan-An (TA sur la Fig. 1) où des forages profonds ont trouvé de l'eau douce vers 200 m de profondeur [1]. La partie orientale est très résistante (zone pourpre) et correspond au socle de roches ignées.
6 Discussion et conclusion
L'approvisionnement en eau potable rencontre de grandes difficultés dans le delta du Mékong, à cause de la pollution des nappes aquifères superficielles. Le plus grand potentiel des ressources d'eau douce se trouve à plus grande profondeur, >200 m. La méthode classique d'exploration géophysique par sondage électrique SE ne permet pas d'atteindre ces profondeurs. Nous avons montré dans cet article que la méthode combinée sondage électrique (SE)/sondage magnéto-tellurique (SMT) permet d'obtenir une image électrique plus complète de la surface, jusqu'à 800 m de profondeur, et de réaliser une véritable tomographie électrique du sous-sol. Cette méthodologie se révèle beaucoup plus économique qu'un programme d'exploration par forages profonds, très coûteux, dont le nombre est, par conséquent, limité. La tomographie électrique est particulièrement adaptée pour l'investigation hydrogéologique des vastes plaines alluviales et constitue un guide précieux dans l'évaluation de la qualité des ressources d'eau douce du delta du Mékong.
1 Introduction
The agglomeration of Ho-Chi-Minh (HCM) City (formerly Saigon City) and several surrounding rural districts in South Vietnam, with more than 5 million inhabitants, are confronted with a dramatic shortage of fresh water supply because of the contamination of several aquifers. Due to its location at about 45 km from the East Sea (Fig. 1), superficial aquifers along the coastal area are contaminated by the seepage of seawater and by the inland incursion of salty tidal water, especially during the dry season (November–April). In the other areas, the contamination originates from the leaching of saline sediments deposited during different Tertiary and Quaternary transgressions. The human activities contribute to the pollution of many rivers that run through the agglomeration. During high water season (August–November), about half the Delta is inundated by overflow of the Mekong River. As a result of the seasonal flooding and drying, the soils have become saturated with aluminium and iron salts, which are toxic to most crops. Moreover, a closely integrated manmade network of canals and inland waterways is subject to tidal incursion of brackish or salty water from the East Sea, which may extend far inland during the low water season (February–April).
Many wells were drilled in Saigon City by the French–Asian Hydraulic Company [6]. Since 1959, the Americans concentrated groundwater investigations in the delta of South Vietnam [1]. After the end of the war, in 1975, the demand of groundwater for domestic and industrial purposes in both old and newly developing areas required immediate attention. Many government agencies have been created to investigate and exploit groundwater. As a result of many years of investigation, especially by deep drilling (>200 m) in the agglomeration of HCM City, it has been possible to identify deeper fresh-water aquifers in several favourable areas. However, some deep aquifers as well as some superficial ones have brackish or salty water with variable Total Dissolved Solids (TDS) contents. The chemical characteristics of groundwater vary with depth in a very complicated way and are known only in some deep wells on limited areas. Therefore, it is very important to use an efficient geophysical methodology in order to delineate the extent of groundwater contamination, not only near the surface but also at larger depth.
Traditionally, Vertical Electrical Sounding (VES) has been widely used and has played a significant role in groundwater geophysics (e.g., [7,8]). Owing to the strong contrast of resistivity between a freshwater aquifer (a few hundred m) and a saline water aquifer (a few m), the efficiency of the VES method lies in the direct correlation, in simple cases, of the interpreted data to groundwater quality. Unfortunately, the investigation depth of this method is relatively low, about 1/4–1/10 of the distance between the current electrodes with the Schlumberger array. For deeper exploration, the Magneto-Telluric Sounding (MTS) method is more suitable (e.g., [2,5]). In fact, these two methods are quite complementary, and the use of the combined VES/MTS method can provide a more complete electrical image of the sedimentary series from the surface to the deep basement. This combined method was first successfully applied along two profiles, DH-TB and HC-CC, located to the northwest of HCM City (see Fig. 1). The results showed a close correlation of the groundwater pollution of the groundwater with the palaeo-geomorphology of laterites, and with the subsequent palaeo-relief during the Tertiary and Quaternary periods [4]. A simple guide for hydrogeological investigation was proposed in order to localise fresh aquifers both in shallow and deep zones connected respectively with Quaternary and Tertiary tectonics [5]. Based on this guide, we have extended the studied area with five more profiles, LC, HB, BH, AA and CG, i.e. a total of 60 stations including the two former profiles, covering a large region around HCM City along the East border of the Mekong Delta (rectangle in Fig. 1). This large number of stations allows performing, after inversion of both VES and MTS data, an electric tomography of the studied area, showing electrical maps at different depths, which may be connected with the quality of groundwater.
2 Tectonic and geological setting
The oldest known rocks of the region are granite, gneiss, quartzite and other crystalline rocks, considered to be of Precambrian to Early Palaeozoic age [1]. In South Vietnam, hills of rhyolite and dacite as well as Hercynian granite are aligned along a northwest trend from Vung-Tau (VT) to Tay-Ninh (TN) (see Fig. 1). This trend coincides with the tectonic trough in which the alluvial complex of the Mekong Delta was later deposited. From Permian to Eocene, interbedded continental sediments were deposited in the subsiding basin. A very thick Mesozoic shale was encountered in deep drill-holes. The northwest-trending tectonic trough began to subside in Late Tertiary period (Neogene). During Plio-Pleistocene, the Old Alluvium was deposited by the Mekong and its tributaries in a vast deltaic fill that extends landwards up to the bedrock outcrops, and seawards up to the present coastline. Along the northeastern margin of the trough, the Old Alluvium is in places interbedded with and in part overlain by basalt flows provided by local eruptions of small volcanoes in the early stages of the alluviation. To the southwest, the delta is entirely covered by the recent Quaternary Holocene sediments. The Holocene alluvium contains relatively poor aquifers, largely because of the fine texture of the deposits. Non-potable brackish or salty groundwater is also widely present. Aquifers in Old Alluvium are the principal sources of fresh water supply [1].
In the studied area, several drill-holes tap water-bearing zones in the Old Alluvium (see Fig. 2), especially in the Neogene sediments that have high yield and economical importance because they spread widely with a large thickness and down to 200 m depth. However, the Neogene aquifers have variable TDS and are also contaminated by brackish or salty water in some places.
3 Relationship between bulk resistivity of an aquifer and its water quality
Numerous investigations have established the efficiency of electrical resistivity methods as a tool for evaluating groundwater quality [7]. Many contaminants contain an ionic concentration considerably higher than the native groundwater. Increased ionic concentration, or TDS, results in higher electrical conductivity (or lower resistivity) of the water. Thus, in an aquifer containing a contaminant, one would expect the pore water resistivity to be lower than in a non-contaminated area. The resistivity of a water-bearing rocks decreases with increasing water content. In a fully saturated rock, which is the general case for the aquifers in the Mekong Delta, water content may be taken as equal with porosity. For these aquifers the rock-reservoir of which is made principally of porous sand or gravel, it has been observed that the resistivity varies approximately as the inverse square of the porosity. This observation has led to the widespread use of an empirical function relating resistivity and porosity which is known as Archie's law [3]:
| (1) |
For a first approximation, a value of 1 may be assumed for a and a value of 2 for m:
| (2) |
In practice, the uncertainty in the knowledge of the parameters a and m is less serious than the uncertainty in the choice of the proper value of ρe.
The resistivity ρe of the electrolyte depends on the salinity of the water. Since groundwater may have a variety of salts in solution, the concept of an ‘equivalent salinity’ is frequently used. It is defined as the salinity of a sodium chloride solution that would have the same resistivity as that of the particular solution. Keller and Frischknecht [3] give a set of curves showing the relationship between the resistivity and the salinity of a sodium chloride solution at various temperatures. The curves indicate a decrease of the resistivity ρe with increasing temperature, but the effect has little influence in normal condition of temperature between 20 and 40 °C. The decrease of ρe, as the inverse of the salinity (expressed as the concentration C of sodium chloride in grams per litre (g l−1)), for C<100 g l−1 [3] is more important.
The quality of the groundwater depends principally on the concentration C. In practice, we consider five usual groundwater qualities as shown in Table 1 with the corresponding sodium chloride concentrations C and resistivities ρe obtained from Keller and Frischknecht's curves at 20 °C.
By using the simplified Archie's law (Eq. (2)), we obtain the curves of the bulk resistivity ρ versus the porosity (P%) for the five groundwater qualities in Table 1 (Fig. 3). With a hypothesis on the porosity of an aquifer, it is possible to evaluate its quality from its bulk resistivity, which can itself be obtained from the inversion of VES and MTS data.
4 VES and MTS geoelectrical cross-section of the profile BH
The inversion results of two former profiles, DH-TB and HM-CC, were presented in a previous paper [5]. As an example, we present hereafter the new results obtained along the profile BH, about 60 km long, including 10 stations and passing through the agglomeration of HCM City (see Fig. 1). The VES data and the MTS data in audiofrequency range (3–2500 Hz) were obtained by the same procedure of measurement as previously described [5]. An example of VES curve and an example of MTS curve are shown in this paper [5].
The stratigraphy in the Mekong Delta is subhorizontal. Therefore, the assumption of a layered model (1D) for the data inversion is justified. Using interactive software and a multilayer 1D model, the resistivity and the thickness of each layer were successively modified until the theoretical VES/MTS curves have a best fit with the experimental VES/MTS curves at each station.
The inversion results of 10 stations of the profile BH are shown in Fig. 2 in the form of two geoelectrical cross-sections corresponding respectively to VES results (Fig. 2a) and to MTS results (Fig. 2b). As already observed in the previous paper, the VES geoelectrical cross-section gives more detail on shallow structures until about 200 m depths, whereas the MTS geoelectrical cross-section provides more information on deeper structures until about 800 m depths.
The profile BH encounters three drill-holes dug for hydrogeological exploration, DH812, 816 and 817, location and stratigraphy logging of which are reported in Fig. 2. It is therefore possible to correlate the geoelectrical cross-section with the stratigraphy. Red colour indicates a resistivity of about 1 m, which corresponds to a porosity of about 40% on the salty-water curve of the graph in Fig. 3. The intersection of the 40% vertical line with the different water quality curves (Fig. 3), gives an approximate correspondence between the bulk resistivity ρ (colour scale) and the water quality, as shown on the right part of Figs. 2 and 4. A porosity of 40% may be somewhat high and relevant only to a shallow aquifer, a value of 20–30% is more probable for deeper aquifers. However, the corresponding groundwater quality is not significantly changed.
Quaternary sediments in the southwestern part of the profile are more conductive ( m), corresponding probably to the presence of salty or brackish shallower aquifers (Fig. 2a). Fresh groundwater (blue colour) can be found locally in shallow Neogene aquifers to the northeastern extremity of the BH profile, and deeper to the southwest. However, there is some ambiguity between deep Neogene aquifers and impermeable Mesozoic shale layers that have a bulk resistivity of the same order (ρ=100– m). Finally, the deepest resistive layer ( m) detected by MTS (Fig. 2b) can be attributed to the igneous bedrock that outcrops at the East border of the studied area (see Fig. 1). Like the Mesozoic layer, the bedrock does not contain any interesting aquifer.
5 Electric tomography: evaluation of the quality of the groundwater resources
Seven profiles in the studied area (Fig. 1) have been interpreted with the procedure presented above for the BH profile, providing an electrical image of the underground structure from the surface until a depth of about 800 m. It is then possible to realise an electric tomography by drawing the resistivity maps at different depths. Fig. 4 shows three such maps corresponding respectively to the depths 25, 100 and 300 m, and covering the studied area (rectangle of 117×75 km in Fig. 1).
5.1 25-m depth map
The southwestern border (Fig. 4a) shows a very low resistivity ( m); shallow Quaternary aquifers are there salty or brackish (red or yellow area). Fresh Neogene groundwater (blue) can be found to the north of the studied region, to the east, and, locally, to the southeast of HCM City. At the northwestern border of the map, we observe a small very resistive zone (purple: m), which can be explained by the presence of a lateritic cover. It was demonstrated that this cover constitutes an excellent fresh groundwater reservoir in higher relief [4,5].
5.2 100-m depth map
Salty and brackish areas (Fig. 4b) extend toward the northwest of HCM City, around the Cu-Chi (CC) town (see Fig. 1). Mineralised groundwater (green area) appears to extend widely toward the north and the northwest of HCM City. Fresh groundwater is more localised to the north of CC town and to the east and southeast of HCM City.
5.3 300-m depth map
The fresh groundwater area becomes a narrow band along the northeast-trending border of the Mekong Delta (Fig. 4c). It is interesting to note the existence of a blue ridge (ρ=100– m), from HCM City to the Tan-An (TA) town located to the southwest (see Fig. 1). This suggests the possible extent in this region of a deep fresh groundwater aquifer, where some deep drill-holes found freshwater at about 200 m depth [1]. The resistivity of the eastern part of the studied area is very high (purple), corresponding probably to the igneous bedrock that outcrops at its eastern border (see Fig. 1).
6 Discussion and conclusion
For two decades, a great deal of effort has been devoted to groundwater investigation in the Mekong Delta, the exploration technique used being principally the traditional Vertical Electrical Sounding (VES) method. Its investigation depth rarely reached more than 200 m, so that only Quaternary shallow aquifers could be detected. Unfortunately, the water of these aquifers is frequently salty or brackish. To reach deeper aquifers, some deep drill-holes (>200 m depth) were realised, with a variable success. These deep drill-holes are very expensive and their number was limited.
In the present paper, we show that a combined VES/MTS (Magneto-Telluric Sounding) methodology gives a good electric image of the ground structure from the surface until great depths (∼800 m). Geological information inferred from some drill-holes provided good constraints on the stratigraphic interpretation of the geoelectrical results. The resulting electric tomography is made of electrical images in horizontal planes of different depths. This methodology is less expensive than an extensive deep drill-holes program, especially in the case of the Mekong Delta, which covers a very vast alluvial plain and where most fresh groundwater resources can be found only at great depth [1]. The electric tomography constitutes an interesting and cheap guide for the evaluation of the quality of the groundwater resources of the Mekong Delta.