

Version française abrégée
1 Introduction
Les oxydes d'uranium tendent à perdre leur plomb radiogénique du fait de la large différence de rayon ionique entre Pb2+ et U4+. Si le plomb peut s'accumuler à proximité des oxydes d'U sous forme de galène [13,19], une partie généralement migre en dehors des zones minéralisées [5,11–13]. Dans cette étude, nous essayons de quantifier la proportion de plomb radiogénique qui a pu migrer en dehors d'un gisement d'uranium de type discordance, le gisement de Shea Creek (Ouest Athabasca, Saskatchewan, Canada, Fig. 1 [16,20]), en nous appuyant sur : (1) la composition isotopique de galènes distribuées dans et autour du gisement, (2) le rapport Pb/U moyen du corps minéralisé qui sera comparé avec le rapport théorique calculé à partir des âges UPb de dépôt des minéralisations uranifères dans le bassin Athabasca [1,2,6,7,9,10,18,23], (3) les distributions 3D des teneurs en U, Pb et des rapports Pb/U, afin de localiser les chemins possibles de migration de Pb.
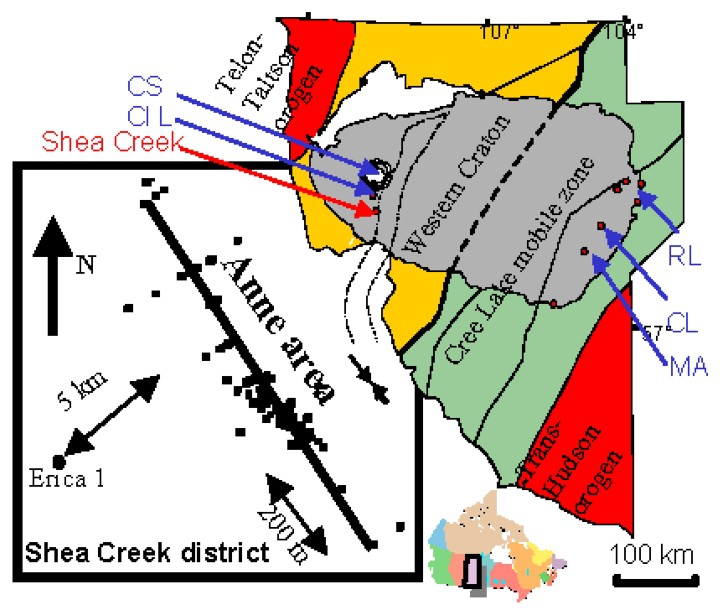
Location of the Shea Creek district. The inset shows the drilling pattern in the Anne mineralised area of the Shea Creek district. The line represents the section shown in Fig. 2b. MA: McArthur, CL: Cigar Lake, RL: Rabbit Lake, Cl L: Cluff Lake, CS: Carswell Structure.
Localisation du district uranifère de Shea Creek. L'encart montre la distribution des sondages dans la zone minéralisée de Anne du district de Shea Creek. La droite représente la section montrée sur la Fig. 2d. MA : McArthur, CL : Cigar Lake, RL : Rabbit Lake, Cl L : Cluff Lake, CS : structure de Carswell.
2 Composition isotopique de galènes
Des galènes ont été prélevées (i) au sein d'un échantillon minéralisé dont les oxydes d'U ont été datés à 1281±6 Ma [7], et (ii) dans des fractures non minéralisées à 50–80 m au-dessus du corps minéralisé. Les galènes (i) sont extrêmement uranogènes (Tableau 1), avec un âge maximal de dépôt de la source uranifère de Pb (983±46 Ma) nettement plus jeune que l'âge des oxydes d'uranium du même échantillon. Ces galènes montrent que le plomb uranogène peut être piégé dans la zone minéralisée, mais qu'il peut migrer sur une plus longue distance que le voisinage immédiat de l'oxyde d'uranium père. Les galènes (ii) sont moins radiogéniques (Tableau 1), avec une contribution thorigène non négligeable. Ces galènes témoignent d'une redistribution de plomb, par suite du lessivage de minéraux riches en Th de la base du bassin ou des granitoı̈des du socle [4,5] et, dans une moindre mesure, d'oxydes d'uranium.
Isotopic Pb composition of galenas; nd: no data. The table shows the uncertainties related to the ion current instabilities (last significant digit). Full uncertainties, including mass-fractionation, have been estimated using a standard, SRM 981: 0.08–0.1%, 0.12–0.15% and 0.2% on the 206Pb/204Pb, 207Pb/204Pb, 208Pb/204Pb ratios, respectively
Composition isotopique en plomb des galènes ; n.d. : pas de donnée. Le tableau indique les incertitudes dues aux instabilités du courant ionique (dernier chiffre significatif). L'incertitude totale, tenant compte du fractionnement de masse, a été estimée en utilisant un standard SRM981 : 0,08–0,1%, 0,12–0,15% et 0,2% sur les rapports 206Pb/204Pb, 207Pb/204Pb, 208Pb/204Pb ratios, respectivement
| Sample No. | Elevation | Whole rock content | Isotopic ratios | |||||
| above Uc | Pb (ppm) | U (ppm) | 206Pb/204Pb | 207Pb/204Pb | 208Pb/204Pb | 208Pb/206Pb | 207Pb/206Pb | |
| She 68A-653.1 | 186 | 0.66 | 32.264 ± 3 | 16.847 ± 2 | 51.293 ± 5 | 1.58980 ± 3 | 0.52216 ± 1 | |
| She 68A-658 | nd | nd | 31.945 ± 12 | 16.801 ± 6 | 51.166 ± 19 | 1.60174 ± 8 | 0.52621 ± 1 | |
| She 16-672.6 | 17 | 7.5 | 29.396 ± 2 | 16.586 ± 2 | 48.656 ± 5 | 1.65512 ± 4 | 0.56422 ± 1 | |
| She 16-718.7 | 38 800 | 374 000 | 6140 ± 19 | 452.9 ± 14 | 46.77 ± 14 | 0.0076183 ± 9 | 0.07377 ± 2 | |
| She 16-718.7 | 38 800 | 374 000 | 6149 ± 3 | 453.7 ± 2 | 45.96 ± 2 | 0.0074744 ± 9 | 0.07379 ± 2 | |
| She 16-718.7 | 38 800 | 374 000 | 5787 ± 8 | 427.6 ± 6 | 45.84 ± 6 | 0.0079246 ± 3 | 0.07389 ± 3 |
3 Rapport Pb/U moyen du corps minéralisé
Les teneurs en U et Pb ont été analysées sur 2943 échantillons prélevés le long des forages d'exploration (Fig. 1, Tableau 1). Cette base de données a permis de construire des modèles 3D de distribution des teneurs en U et Pb (Fig. 2) et des rapports Pb/U (Figs. 3 et 4) à l'aide du logiciel GOCAD [17], dans et autour de la zone minéralisée, et de calculer le rapport Pb/U moyen du corps minéralisé (équations (1) et (2)) : 0,071±0,015. Ce rapport correspond à celui qu'aurait eu un gisement formé en un épisode il y a 485±97 Ma, en supposant, de plus, que l'essentiel du plomb est d'origine uranogène et qu'il n'y a eu de perte, ni en plomb, ni en uranium (équation (4)).
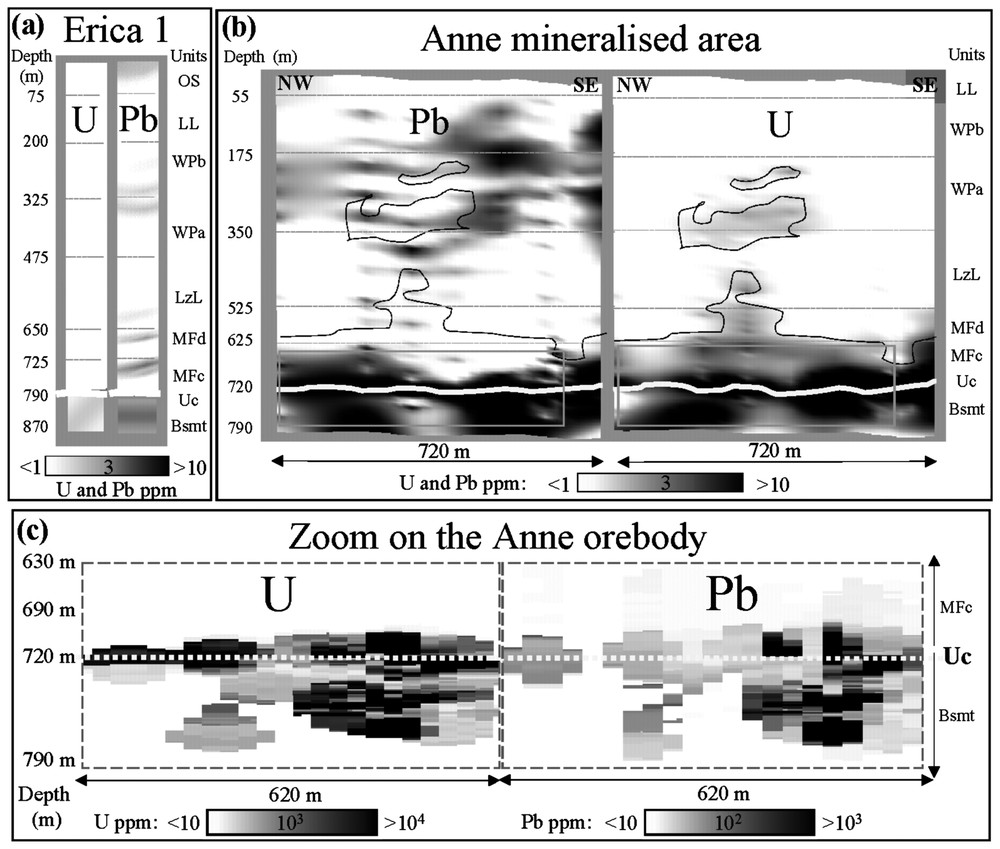
Vertical sections in the 3D UPb distribution models. (a) Section along Erica 1 drill hole (non-mineralised), used as a reference for the background U and Pb contents. (b) Section in the Anne mineralised area through the sandstone cover, the orebody, and the basement, along the Saskatoon Lake Conductor (see inset of Fig. 1 for location). The U and Pb contents are painted according to their values (black: contents above 10 ppm; white: contents below 1 ppm). See text, for sandstone units abbreviations; Uc: unconformity, Bsmt: basement. Black contour: isovalue curve for U=2 ppm. (c) Zoom on the Anne orebody (see rectangle in Fig. 2b), where the models has been refined thanks to a denser sampling (samples collected every 10 to 50 cm). In this zone, U and Pb contents are systematically above 10 ppm.
Sections verticales dans les modèles de distribution spatiale des teneurs en U et Pb. (a) Section le long du sondage Erica 1 (non minéralisé), utilisé comme référence pour les teneurs en U et Pb du fond géochimique. (b) Section dans la zone minéralisée de Anne à travers la couverture gréseuse, le corps minéralisé, et le socle, le long du Saskatoon Lake Conductor (voir l'encart de la Fig. 1 pour la localisation). Les teneurs en U et Pb sont représentées par des couleurs (en noir : teneurs supérieures à 10 ppm ; en blanc : teneurs inférieures à 1 ppm). Voir le texte pour les abréviations des formations des grès ; Uc : discordance, Bsmt : socle. Contour noir : courbe isovaleur U=2 ppm. (c) Détail du corps minéralisé (voir rectangle dans la Fig. 2b), où les modèles ont pu être affinés grâce à un échantillonnage plus dense (un échantillon tous les 10–50 cm). Dans cette zone, les teneurs en U et Pb dépassent systématiquement 10 ppm.
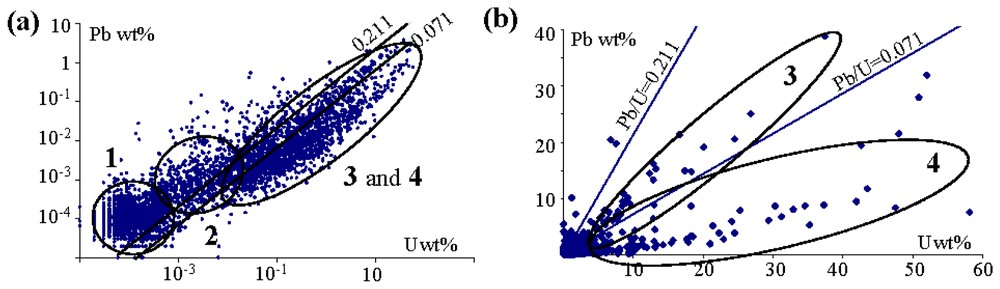
2D plot of Pb vs U contents (∼3000 samples). (a) Log scale, (b) normal scale. The Pb/U ratios of 0.211 and 0.071 correspond to the theoretical ratios for an U deposition at 1315 Ma and 485 Ma, respectively, in a closed system with negligible amount of common and thorogenic Pb. The figures refer to the sample group number, as defined in the text.
Diagramme 2D des teneurs en Pb vs U (∼3000 échantillons). (a) Échelle log, (b) échelle normale. Les rapports Pb/U de 0,211 et 0,071 correspondent aux rapports théoriques pour un dépôt uranifère il y a 1315 Ma et 485 Ma, respectivement, dans un système fermé, avec des quantités de plomb commun et thorogénique négligeables. Les chiffres font référence aux numéros des groupes d'échantillons définis dans le texte.
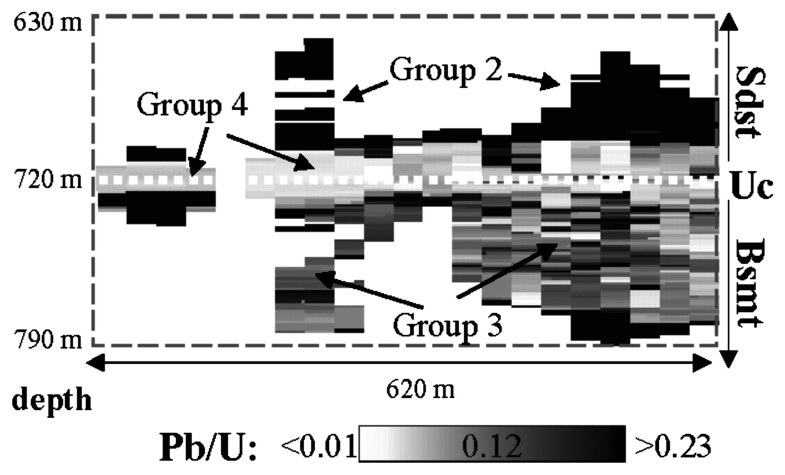
Pb/U distribution in the Anne orebody. The section is the same as the one shown in Fig. 2c, where Pb and U contents are above 10 ppm. Group numbers refer to the location of the sample groups defined in Fig. 3. Sdst: sandstone; Bsmt: basement; Uc: unconformity.
Distribution des rapports Pb/U dans le corps minéralisé de Anne. La section représentée est la même que celle de la Fig. 2b, dans laquelle les teneurs en Pb et U dépassent 10 ppm. Les numéros de groupe font référence à la localisation des groupes d'échantillons définis dans la Fig. 3. Sdst : grès ; Bsmt : socle ; Uc : discordance.
4 Distribution 3D de U, Pb et Pb/U
Les plus fortes teneurs en U et Pb sont localisées le long de la discordance (au maximum 50 m au-dessus) et localement dans le socle (Fig. 2b). De plus faibles anomalies Pb dans les formations supérieures des grès, ne correspondant pas à des anomalies en U, semblent indiquer des chemins de migration de Pb, probablement le long de structures intersectant la stratigraphie.
Excepté pour les faibles teneurs en U et Pb (<10 ppm, groupe 1, Fig. 3a), Pb est globalement corrélé avec U, en accord avec une origine uranogène du plomb. Cette corrélation n'est cependant pas linéaire. Les échantillons faiblement minéralisés (U<500 ppm, groupe 2, Fig. 3a), localisés principalement à l'aplomb du corps minéralisé (Fig. 4), ont des rapports Pb/U supérieurs au rapport théorique de 0,211 (équation (4), en considérant un âge de 1315 Ma). En notant que les âges les plus anciens enregistrés à Shea Creek sont d'environ 1315 Ma [7], des rapports supérieurs à 0,211 indiquent un gain en plomb uranogène, et/ou une perte en U, et/ou la présence de plomb commun ou thorigène.
À l'inverse, les échantillons fortement minéralisés ont des rapports inférieurs à 0,211 (Fig. 3a). Les plus faibles rapports Pb/U sont notamment distribués dans la minéralisation massive le long de la discordance (Fig. 4), suggérant que, dans cette zone, U a été déposé plus récemment et/ou qu'une grande quantité de plomb radiogénique y a été lessivée.
5 Discussion
Dans le bassin Athabasca et le gisement de Shea Creek, en particulier, les oxydes d'uranium ont perdu une quantité importante de plomb radiogénique, comme le montrent les âges isotopiques UPb, souvent discordants [1,2,6,7,9,10,15,18,23].
Ce plomb radiogénique a été au moins en partie redéposé sous forme de galène dans la zone minéralisée, puisque certaines galènes (type (i)) ont des compositions isotopiques extrêmement uranogènes.
Pour quantifier la proportion de plomb radiogénique éventuellement perdue en dehors du gisement, nous émettrons tout d'abord les hypothèses (1) que l'essentiel du plomb est uranogène, (2) qu'il n'y a pas eu de perte en plomb à l'échelle du corps minéralisé depuis le ou les dépôts uranifères.
L'hypothèse (1) est vérifiée par l'existence d'une corrélation entre les teneurs en U et Pb (Fig. 3), et par les compositions isotopiques UPb des oxydes d'uranium [6,7,9,10,18] et des galènes de type (i).
Avec l'hypothèse (2), le gisement de Shea Creek peut être vu comme un système fermé, dans lequel l'uranium aurait été apporté en un ou plusieurs épisodes et tout le plomb radiogénique aurait été conservé. Dans ce cadre, le rapport Pb/U de 0,0711 indique qu'au moins la moitié du gisement a dû s'être formée au cours d'événements plus récents que 485 Ma (équation (5)). Ce résultat est même sous-estimé, puisque du plomb commun et du plomb thorigène sont aussi présents, comme le montre la composition isotopique des galènes de type (ii).
Ce résultat est improbable, puisque d'après les études géochronologiques antérieures dans l'Athabasca [1,2,6,9,10,15,18,23], les gisements d'uranium se sont essentiellement formés au Méso-Protérozoı̈que. Les âges plus jeunes représentent, soit des dépôts mineurs de pechblende [6,18], soit des âges de remobilisation d'anciennes uraninites [1,6,14,15].
Par conséquent, l'hypothèse d'une rétention totale de plomb radiogénique dans le corps minéralisé apparaı̂t trop restrictive. Seule une partie du plomb y a été piégée, mais l'essentiel (environ 60 %) a migré à plus de 700 m du corps minéralisé.
Le plomb a préférentiellement migré le long de la discordance où sont observées les minéralisations les plus riches avec les plus faibles rapports Pb/U (Fig. 4). La discordance constitue en effet une zone de forte perméabilité, le long de laquelle les fluides tardifs ont pu facilement circuler [12,15].
1 Introduction
Uranium oxides easily loose their radiogenic lead (206Pb, 207Pb), due to the large ionic radius difference between Pb and U. Previous mineralogical studies on U deposits reveal that part of Pb did not necessarily migrate over long distances, as radiogenic galena is usually found within or adjacent to uraninite grains or in coffinite resulting from uraninite alteration [13,19]. However, radiogenic galenas have also been observed further away from the U orebodies, e.g., up to 35 m above the Midwest unconformity-type deposit [5], in the clay mantle surrounding the Oklo natural reactors, or 3 to 45 m below them in the conglomerate [11,13]. Excess radiogenic Pb in U- and Th-poor sandstone samples has been reported as far as several kilometres from some U deposits in the Athabasca and Thelon Basins [12].
However, those observations generally derive from a limited number of samples, precluding any quantitative evaluation of the proportion of uranogenic Pb that has been lost from the U orebodies. In this study we are trying to quantify the uranogenic lead loss at the scale of an unconformity-related U-deposit, the Shea Creek deposit (Saskatchewan, Canada), following a three-step method:
- (1) analyses of the Pb isotopic composition of some galenas, to evidence that radiogenic lead may be, at least partly, retained within the ore zone;
- (2) calculation of the average Pb/U ratio at the scale of the orebody and comparison with possible theoretical ratios calculated with respect to available UPb isotopic ages, to estimate the amount of radiogenic lead lost from the orebody;
- (3) 3D modelling of the spatial distributions of the Pb and U contents and of the Pb/U ratios, to identify the possible Pb migration pathways.
2 Geological setting
The Shea Creek prospect is located 15 km south of the Carswell structure (western Athabasca Basin) along the NNW-trending Saskatoon Lake Conductor (SLC, Fig. 1) corresponding to a wide (80 m) graphitic reverse fault zone [20]. The study will be focussed on the Anne mineralised area, which presents similar characteristics to other unconformity-type deposits of the Athabasca. The high-grade polymetallic mineralisation (U±Ni, Co, Cu, Fe, Au) was found in the vicinity of the unconformity between a Palaeoproterozoic basement and the Athabasca Group sandstone. It mainly consists of U oxides, variably dissolved and altered to SiP-rich U-bearing phases. Galena crystals are frequent within U-oxide grains or associated with their Si-rich alteration products. The orebody is surrounded by a silicified zone (10 m wide) and an alteration halo, including illite, dravite, Al-phosphates–sulphates and redox features (bleaching or hematisation) [16]. Similar palaeofluid compositions and thermobarometric conditions as for the eastern-Athabasca deposits were determined [8]. The present sandstone cover, 700- to 800-m-thick, comprises four formations [16]: Manitou Falls (basal unit), itself made up of two members (MFc, MFd), Lazenby Lake (LzL), Wolverine Point, also made up of two members (WPa, WPb), Locker Lake (LL) and Overside (OS, eroded over the mineralised area). The basement is composed of a metasedimentary unit (graphitic metapelites and garnetites), injected by pegmatoids and intercalated between two granitic gneiss units.
The oldest UPb ages recorded in the Shea Creek deposit are around 1315 Ma: upper intercepts at 1362±71 Ma, 1301±34 Ma and 1281±6 Ma [7]. A younger age has been obtained at 391±34 Ma (concordant data) on some massive U-oxides collected at the unconformity [7]. Similar events have been recorded in the Cluff Lake orebodies located 15 km to the north [2], as well as in the other deposits of the eastern part of the Athabasca Basin [1,6,9,10,18,23]. The most common U deposition ages plot within a restricted time interval between 1330 and 1380 Ma, although older (1550–1460 Ma [1,6,9,10]) and younger ages (1300–700 Ma [1,2,6,9,10,18,23]) have also been determined from upper intercepts in Concordia diagrams.
3 Methodology
3.1 Isotopic Pb analyses
PbPb isotopic studies have been performed on six galena crystals at IGEM (Moscow) on a multicollector mass-spectrometer Sector 54. Three samples have been selected immediately above the Anne uranium orebody in the MFc formation, in non-mineralised (U<5 ppm) vertical fractures filled with pyrite and galena. Three other galena crystals have been selected, within the uranium orebody, from a vein crosscutting some U oxides that have been dated by [7] (concordant UPb upper intercept at 1281±6 Ma and lower intercept at 53±18 Ma with a MSWD of 19 on a Concordia diagram).
3.2 3D geochemical modelling
105 vertical drill holes and 54 directional drill holes diverging from some of the vertical drill holes have been completed by COGEMA along the SLC in the Anne mineralised area. The vertical boreholes have been drilled down to more than 800 m through the Athabasca sandstone to the basement, whereas directional drill holes were restricted to the ore zone close to the unconformity. The drilling pattern had a 20–25 m spacing along a 300 m strike length and 50 to 70 m perpendicularly (Fig. 1). One barren drill hole, Erica 1, has been used as a reference for background U and Pb contents, because it is located about 5 km away from the SLC and it does not intersect any graphite-rich structure. In each drill hole, composite samples have been taken every 10 m in the sandstone and in the basement, except in the ore zones where the sampling interval was in the range 10–50 cm. Two thousand nine hundred and forty-three samples were analysed at the Saskatchewan Research Council by ICP–OES for Pb following a tri-acid total digestion (HFHNO3HClO4). U was analysed by fluorimetry.
The 3D distribution of U, Pb and Pb/U was modelled with the GOCAD software [17]. The values were interpolated in a 3D grid by the Discrete Smooth Interpolation method [17] within a 750×250×750 m volume with grid cell dimensions of 20×30×10 m in the Anne mineralised area, decreased to 20×30×1 m in the orebody. In this paper are shown vertical sections across these 3D models: (i) along Erica 1 drill hole (Fig. 2a), (ii) in the Anne mineralised area through the sandstone cover, the ore zone and the basement (Fig. 2b), and (iii) zoomed on the orebody (Fig. 2c).
3.3 Average Pb/U ratio of the orebody
The average Pb/U ratio at the scale of the orebody (Figs. 3 and 4) was calculated from the following formula:
| (1) |
The density of a 106 gram cell was calculated taking into account the U and Pb contents:
| (2) |
The estimated error was calculated as follow:
| (3) |
3.4 Theoretical Pb/U ratios
The amount of lead produced from the radioactive decay of U, , for a U deposition at time t, can be calculated from the formula of [3], expressed here in mass ratio:
| (4) |
Hence, for a single episode of U deposition at 1315 Ma, . Consequently, a rock that has remained a closed system with respect to U and Pb and that contains negligible amount of common and thorogenic Pb should have a present-day mPb/mU ratio of 0.211. Higher ratio would indicate uranogenic Pb gain and/or U loss and/or the presence of non-uranogenic Pb. Inversely, lower ratio would indicate uranogenic Pb loss and/or U gain.
If several events of U deposition occurred, then
| (5) |
The ratios will be considered as ‘theoretical ratios’ that will be used as references to estimate the Pb and/or U gain and/or loss.
4 Results
4.1 Pb isotopic composition of galena
Considering the 206Pb/204Pb, 207Pb/204Pb, and208Pb/204Pb ratios for common Pb at 1350 Ma from the model of [22] (16.43, 15.43 and 36.09, respectively), the three galenas from the non-mineralised fractures above the Anne orebody (Table 1) are partly uranogenic, but common and thorogenic lead are also present. The least square regression of the 207Pb/204Pb vs 206Pb/204Pb ratios yields an age of 1391±430 Ma (MSWD=0.32). This age would correspond to the oldest deposition age of the uranium source, if galena crystals were formed at present time, which is however not proved. The deposition age of the source would be younger for an older age of galena crystallisation.
Conversely, the three galenas collected from the vein crosscutting some U oxides (Table 1) are extremely uranogenic. For these galenas, the deposition age of the uranium source cannot be older than 983±46 Ma (MSWD=0.19).
4.2 U and Pb distribution
U and Pb contents in barren areas are below 2 ppm and 5 ppm in the sandstones, respectively, and below 6 ppm and 44 ppm in the basement, respectively (Erica 1, Table 2, Fig. 2a). These contents will be used as thresholds values to define the U- and Pb-enriched areas in the distribution models (Fig. 2).
U and Pb whole rock contents of the 2943 exploration samples. Upper Sdst: Wolverine Point, Locker Lake (and Otherside for Erica 1) formations. Upper LzL and lower LzL: upper and lower halfs of the Lazenby Lake formation. MFd: Manitou Falls d formation. Upper and lower MFc: upper and lower halfs of the Manitou Falls c formation. Values in parentheses are the median, which is given each time it differs from the mean. Nb: number of samples. Detection limits were 0.1 ppm for U and Pb
Teneurs « roche totale » des 2943 échantillons d'exploration. Upper Sdst : formations Wolverine Point et Locker Lake (et Otherside pour Erica 1). Upper LzL et lower LzL : moitiés supérieure et inférieure de la formation Lazenby Lake. MFd : Formation Manitou Falls d. Upper and lower MFc : moitiés supérieure et inférieure de la formation Manitou Falls c. Les médianes (entre parenthèse) sont données lorsqu'elles diffèrent des moyennes. Nb : nombre d'échantillons. Les limites de détection sont de 0,1 ppm pour U et Pb
| Formation | Anne | Erica1 | |||||||||
| min | max | mean | ± | nb | min | max | mean | ± | nb | ||
| U (ppm) | U (ppm) | ||||||||||
| Upper Sdst | 0.1 | 4.4 | 0.8 | 0.5 | 414 | 0.1 | 1.2 | 0.7 | 0.2 | 21 | |
| Upper LzL | 0.2 | 2.8 | 0.8 | 0.5 | 83 | 0.1 | 1.1 | 0.7 | 0.2 | 6 | |
| Lower LzL | 0.4 | 2.9 | 1.0 | 0.5 | 110 | 0.1 | 0.7 | 0.1 | 0.0 | 4 | |
| MFd | 0.5 | 3.4 | 1.3 | 0.7 | 116 | 0.1 | 0.8 | 0.2 | 0.1 | 6 | |
| Upper MFc | 0.5 | 499 | 6.6 | 39 | 210 | 0.2 | 0.6 | 0.4 | 0.0 | 6 | |
| Lower MFc | 0.7 | 374 000 | 5 872 (467.6) | 22 490 | 735 | 0.4 | 0.6 | 0.4 | 0.2 | 3 | |
| Basement | 0.6 | 520 000 | 11 481 (609) | 42 283 | 1223 | 1.4 | 6.0 | 2.9 | 2.0 | 6 | |
| Pb (ppm) | Pb (ppm) | ||||||||||
| Upper Sdst | 0.1 | 17.7 | 1.6 | 1.6 | 414 | 0.7 | 4.6 | 2.0 | 1.2 | 21 | |
| Upper LzL | 0.1 | 9.1 | 1.0 | 1.2 | 83 | 0.6 | 2.8 | 0.7 | 0.9 | 6 | |
| Lower LzL | 0.1 | 3.7 | 0.9 | 0.6 | 110 | 0.4 | 1.1 | 0.8 | 0.3 | 4 | |
| MFd | 0.2 | 3.6 | 1.1 | 0.6 | 116 | 0.4 | 1.9 | 1.0 | 0.6 | 6 | |
| Upper MFc | 0.1 | 149 | 4 (1.4) | 13.6 | 210 | 0.5 | 2.6 | 1.4 | 0.8 | 6 | |
| Lower MFc | 0.2 | 38 800 | 222 (27) | 1488 | 735 | 0.4 | 0.6 | 0.5 | 0.1 | 3 | |
| Basement | 0.2 | 3×10⁵ | 764 (49) | 2634 | 1223 | 3.3 | 44.3 | 21.6 | 15.0 | 6 |
The U-richest areas are located along the unconformity in the Anne area, in the 30 lower metres of the MFc formation and down to 70 m into the basement (U contents systematically above 10 ppm and locally up to a few tens of wt%, Fig. 2b and c, Table 2). The Pb-richest contents globally follow a similar distribution (Fig. 2b and c), suggesting that Pb is of uranogenic origin and/or that Pb was also added during the mineralising events.
In the other sandstone formations (MFd, LzL, WPa, WPb, LL), U contents only very locally exceed 2 ppm (up to 4.4 ppm, Fig. 2b, Table 2), but these local anomalies are not supported by Pb enrichment. The Pb anomalous zones appear more widely developed higher in the basin, especially in the WP formations (up to 17.7 ppm). The relative distribution of these U and Pb anomalies may suggest that some uranogenic Pb might have migrated from the U-rich zone upward, probably along some fractures crosscutting the lithostratigraphy.
4.3 Pb/U distribution
Except for samples with low U and Pb contents (<10 ppm, group 1, Fig. 3a), Pb is globally positively correlated with U. This correlation is however not linear, as the Pb/U ratios tend to decrease with increasing U-grade.
Most samples with less than 500 ppm U (group 2, Fig. 3a) display Pb/U ratios higher than 0.211, which is the theoretical ratio for a U deposition at 1315 Ma. Those samples are essentially located on the margins of the orebody, especially toward the sandstone, as shown on the Pb/U spatial distribution model (Fig. 4). The ∼1315 Ma age being approximately the oldest event recorded at Shea Creek [7], the high Pb/U ratios observed in this zone might reflect radiogenic Pb gain and/or U loss and/or the presence of non-uranogenic Pb minerals.
Samples richer in U (U>500 ppm) have Pb/U ratios lower than 0.211 (Fig. 3a), suggesting either increasing radiogenic Pb loss and/or increasing proportion of more recently deposited U oxides, with increasing ore grade. The high-grade samples plot themselves in two groups: group 3 with Pb/U ratios between 0.089 and 0.138, and group 4 with Pb/U ratios between 0.021 and 0.028 (Fig. 3b). Group-3 samples are located in the basement, while group-2 samples are located in the massive ore zone along the unconformity, where the Pb/U ratios are the lowest (Fig. 4). The particularly low Pb/U ratios distributed in this zone indicate that the U ore was deposited more recently or that radiogenic lead has been more massively leached along the unconformity.
The average Pb/U ratio calculated at the orebody scale (Fig. 4) is 0.071±0.015. It corresponds to the theoretical ratio expected for a U orebody formed 485±97 Ma ago, containing only uranogenic lead and that has remained closed relative to U and Pb.
5 Interpretation
5.1 Evidence of radiogenic lead retention in the ore zone
Uranium oxides in the Athabasca Basin, and in the Shea Creek deposit in particular, experienced significant episodic Pb loss [1,6,7,9,10,15,18,23], as evidenced from the numerous discordant data in Concordia diagrams, and the frequent non-zero lower intercepts ranging from 700 to 200 Ma.
Radiogenic Pb has however been trapped within the orebody, at least partly, as shown by the extremely uranogenic Pb composition of the three galenas collected in the mineralised sample. Their compositions compare well with that of the galenas from the mineralised zone of the Midwest deposit [5]. However, the oldest possible deposition age of the uranium source (983±46 Ma) does not correspond to the age of the U oxides present in the same thin section (1281±6 Ma, [7]). This indicates that the source was external to the sample, which highlights the possibility of ‘long-distance’ Pb migration within the orebody, i.e., Pb is not systematically redeposited in the immediate vicinity of the U oxides. Such Pb migration has already been observed at the scale of a hand sample in the Key Lake deposit [23], by comparing the UPb isotopic composition of uraniferous phases with that of their corresponding matrix after mechanical separation of the two components.
These data however do not indicate whether all radiogenic lead was retained within the ore zone or not. The anomalous Pb contents observed upper in the sandstone (Fig. 2b) and the increase of the Pb/U ratios toward the margins of the orebody (Fig. 4), where some galenas have also been observed, may suggest a Pb migration upward. However the non-negligible amount of common and thorogenic Pb in those galenas indicates that the source cannot be the U oxides exclusively because the amounts of Th, 208Pb and 204Pb are very low in those minerals (208Pb/204Pb ratios from 38.3 to 43 [7]). Hence, common and thorogenic lead from these galenas may derive either from Th-rich sandstone layers (heavy-mineral-rich layers of the basal MF formations) or from Th-rich high K-calcalkaline granitoids in the basement [4]. Such Pb isotopic compositions correspond to those of the ‘basement-type’ galena around the Midwest orebody [5], which have been interpreted as resulting from the alteration of the regolith below the unconformity.
5.2 Pb loss quantification
To quantitatively constrain the proportion of lead that may have been lost outside the ore zone, the average Pb/U ratio of 0.071±0.015 will be now discussed with respect to the two following hypothesis: (1) Pb was essentially of uranogenic origin, (2) the orebody has remained closed relative to Pb.
5.2.1 Is Pb essentially of uranogenic origin?
The uranogenic origin of lead in the ore zone is supported by: (i) the low amounts of 208Pb and 204Pb measured in the U oxides of all Athabasca deposits (e.g., [6,7,9]), (ii) the highly radiogenic composition of galena crystals associated with U-oxides, and (iii) the positive correlation between the U and Pb contents for U higher than 500 ppm (Fig. 3). Common and thorogenic lead has been only observed in some galena crystals above the ore zone. Furthermore, this hypothesis is conservative (see below).
5.2.2 Has the orebody remained closed?
If uranogenic Pb was totally trapped as galena within the ore zone, the orebody may be considered as a closed system, in which U has been added into one or several episodes. If U and Pb contents are integrated at the scale of the orebody (Fig. 4), short distance U and/or Pb migrations should not affect the average Pb/U ratio of the mineralised zone.
In such a closed system and considering the two ages measured on the U oxides at Shea Creek [7] as the two main U deposition events, the present-day average Pb/U ratio of 0.071±0.015 indicates that only 9±9% of U has been deposited at 1315 Ma and 91±9% at 391 Ma (Eq. (5)). Even if more U deposition events are added, the closed system hypothesis implies that more than 50% of the U orebody must have been deposited during events younger than 485±97 Ma. This percentage becomes even greater if common and thorogenic Pb are present in the system.
Such a recent deposition age for the main part of the orebody seems unlikely, as previous geochronological studies on different U deposits in the Athabasca Basin have shown that the major events of U deposition occurred during the Meso-Proterozoic [1,2,6,9,10,15,18,23]. Most younger UPb ages derive from lower intercepts on Concordia diagrams [6,9,10,18,23], indicating remobilisation events associated with Pb loss. Only rare upper intercept ages in the range 200–500 Ma have been obtained, but they correspond to U oxides of minor volumetric importance forming rim or intergranular filling around older uraninites [2,6,18]. In the Shea Creek deposit, the age of 481 Ma obtained on a massive U-oxide [7] likely represents an older uraninite that experienced total Pb loss 481 Ma ago [14].
Therefore, the hypothesis that the orebody has remained closed relative to Pb appears too restrictive. For a main deposition event, ca 1315 Ma ago and if no U was lost since, we may estimate that at least 53 to 64% of the radiogenic Pb has been lost from the Anne orebody. This is a minimum value as we also assumed that the amount of common and thorogenic Pb is negligible. This result is in the same order as the one estimated by [20] in the Key Lake deposit from a limited number of samples.
The Pb anomalies observed in the sandstone cover above the orebody (Fig. 2b) are not sufficiently rich in lead (Pb contents only rarely above 6 ppm, Table 2) to compensate the large amount of missing lead in the orebody. Therefore, a major part of radiogenic Pb likely migrated more than 700 m (dimension of the model) away from the orebody.
5.3 Pb migration pathways
Possible Pb migration pathways may be deduced from the relative 3D distribution of U and Pb. As shown in Fig. 2b, Pb anomalies that are not supported by U anomalies seem to follow some structures extending from the basement up to the WP formations. Such anomalies may result from the migration of uranogenic lead along fractures crosscutting the lithostratigraphy.
At the scale of the orebody (Fig. 4), the increase in the Pb/U ratios from the high-grade ore zone at the unconformity toward the sandstone cover is consistent with a Pb migration upward. However, the galenas selected in the Pb-enriched zone above the orebody are only slightly uranogenic, indicating that the main part of uranogenic lead probably did not migrate upward.
Conversely, the location of the lowest Pb/U ratios along the unconformity, indicates that uranogenic lead has been more massively leached from this zone (Fig. 4). It suggests that Pb preferentially migrated along the unconformity, which is consistent with the presence of highly permeable lithologies at the base of the Athabasca Basin (regolith and microconglomerate). This is also supported by the very radiogenic isotope ratios measured in rocks close to the unconformity, up to several kilometres away from some unconformity-related deposits in the Thelon and Athabasca Basins [12].
6 Conclusion
This study demonstrates that although part of radiogenic Pb was trapped within the orebody as galena, 53 to 64% of Pb must have migrated over distances exceeding 700 m from the orebody, preferentially along the unconformity. For an uranium orebody of 10 000 tons formed 1315 Ma ago, at least 1120 to 1350 tons of radiogenic Pb should have been lost. Such a tremendous lead loss is especially favoured in the Athabasca U deposits, because of the numerous post-ore tectonic events recorded in the basin [15], and the occurrence of oxidised and extremely chloride-rich basinal brines [8], highly favourable for the Pb transport as chloride complexes [21].