

Version française abrégée
Le climat de la Terre lors de la dernière période glaciaire (de 115 à 21 000 ans avant le présent) présente des oscillations brutales, de grande amplitude et affectant la plupart des régions à des degrés divers. Durant la période qui nous intéresse ici, on distingue deux types d'événements : les événements de Dansgaard–Oeschger (D/O), qui présentent des oscillations abruptes en température [1,5] de façon assez régulière [14], faisant probablement intervenir des changements dans la circulation thermohaline, mais dont la cause est encore largement inconnue aujourd'hui : les événements de Heinrich, caractérisés par la présence de détritiques d'origine glaciaire dans les sédiments de l'Atlantique nord [16], apportés par des icebergs provenant des calottes de glace laurentienne et fenno-scandinave. La fonte de ces icebergs tend, par l'apport d'eau douce à l'océan, à arrêter la circulation méridienne atlantique, refroidissant le climat autour de l'Atlantique nord [8,11,13,17]. Cette succession d'événements est enregistrée dans certaines carottes de sédiments, dont la MD95-2042 [19], à laquelle nous comparons nos simulations. Pour simuler ces événements climatiques abrupts, nous utilisons ici un modèle climatique dit de complexité intermédiaire appelé CLIMBER-2 [12,15], auquel nous appliquons le scénario de flux d'eau douce suggéré par Ganopolski et Rahmstorf [4]. Leur approche permet de reproduire correctement les variations de température observées au Groenland, mais n'apporte pas d'explication quant à la cause des événements de D/O. Nous reprenons ici cette approche mais, pour comparer nos résultats avec l'enregistrement isotopique de la carotte MD95-2042, nous avons besoin de définir un contenu isotopique aux flux d'eau additionnels. Cependant, le mécanisme donnant lieu aux événements de D/O n'étant pas connu, nous ne donnerons pas de contenu spécifique aux flux d'eau additionnels associés à ces événements. En revanche, pour les événements de Heinrich, le contenu isotopique est choisi de façon cohérente avec le contenu que peuvent avoir les icebergs, c'est-à-dire avec le contenu isotopique de la glace provenant de calottes de basse altitude. Nous utilisons ici un contenu de (cf. [7]). La Fig. 1 présente les résultats du modèle à 40°N dans l'Atlantique. Les courbes (b) et (e) montrent l'isotope 18 de l'oxygène simulé pour la calcite, pour la surface et à 3000 m de profondeur, calculé d'après [10,18], comme suit :
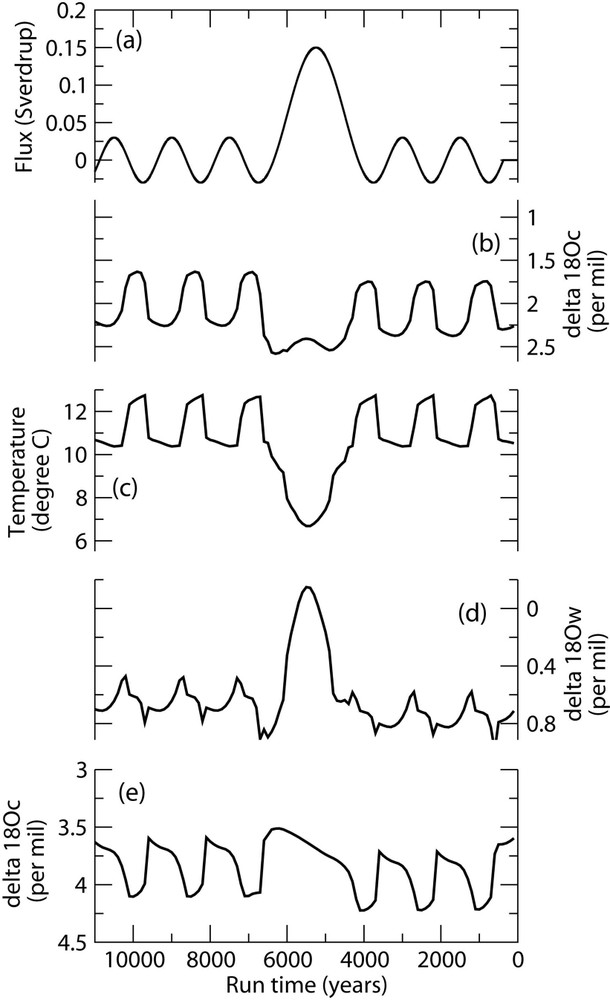
Scenario and model output for the D/O events and HEs. (a) Anomalous freshwater flux scenario in Sverdrup (). All model outputs are showed at 41.25°N in the Atlantic basin to be compared with the core MD95-2042. (b) Simulated of the calcite for the surface layer that is the first 50 m of the model (in per mil vs. SMOW). (c) Temperature evolution in the model for the surface layer (in °C). (d) Simulated evolution of the of the water for the surface layer (in ‰ vs. SMOW). (e) Simulated of the calcite at 3000-m depth. Results in temperature and of the water are not shown for the depth 3000-m as they look similar and contribute for half the amplitude each, see text for discussion.
Scénario et résultats du modèle pour les événements de D/O et de Heinrich. (a) Scénario en flux d'eau douce ajouté en Sverdrup (). Toutes les sorties du modèle sont données à 41,25°N dans l'Atlantique pour une comparaison aisée avec la carotte MD95-2042. (b) de la calcite pour le niveau de surface du modèle, i.e. les 50 premiers mètres (exprimé en pour mille versus SMOW). (c) Évolution de la température dans le modèle pour le niveau de surface (en °C). (d) Résultats de la simulation en de l'eau (en pour mille versus SMOW). (e) de la calcite simulée pour une profondeur de 3000-m. Les résultats pour la température et le de l'eau ne sont pas inclus ici, car leurs variations sont dans le même sens et contribuent chacun pour la moitié du signal en de la calcite.
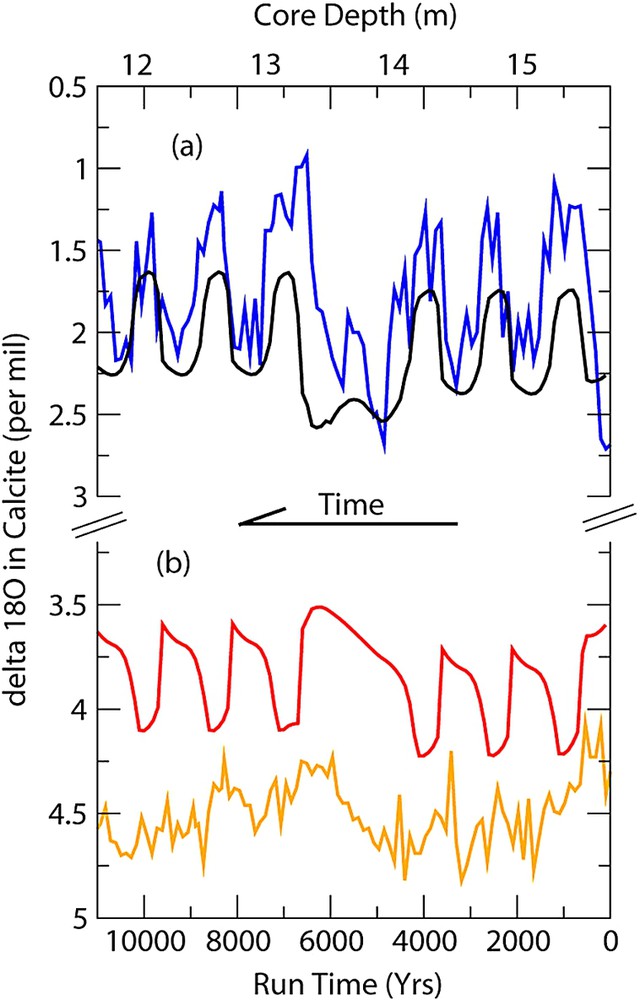
Model–data comparison in . (a) computed in the first layer of the model (lower curve) compared to the planktic record of Shackleton et al. [19] (upper curve). (b) computed in the model at 3000-m depth (upper line) compared to the benthic of the same core (lower line). The top horizontal axis shows the record versus the core depth, whereas the bottom horizontal one shows it versus the model time.
Comparaison données–modèle en de la calcite. (a) de la calcite calculé dans le premier niveau du modèle (50 premiers mètres, courbe du bas) ainsi que le de la calcite provenant de l'enregistrement planctonique de la carotte MD95-2042 (courbe du haut). (b) de la calcite calculée dans le modèle à 3000 m de fond (courbe du haut) ainsi que l'enregistrement benthique de la carotte MD95-2042 (courbe du bas). L'axe des abscisses supérieur est gradué en profondeur dans la carotte de sédiments, tandis que l'axe des abscisses inférieur est gradué en fonction du temps de simulation.
1 Introduction
The climate of the last glacial period (115 to 21 kyrs BP) is characterized by abrupt and large scale changes. These events are mainly of two types: the Dansgaard–Oeschger events – or D/O events, faithfully recorded in the Greenland ice-cores [1,5], and the Heinrich Events – or HEs [6]. The former are characterized by large abrupt warming and cooling, occurring with a fairly regular pacing of about 1500 years [14]. The mechanism driving the D/O events probably involves changes in the thermohaline circulation, though the ultimate causes are however not known. The stable periodicity might suggest a solar-induced mechanism, but internal oscillations of the climate system cannot be ruled out. On the contrary, the mechanism leading to Heinrich Events is much better understood. The presence in sediment cores of the North Atlantic of layers with high Ice Rafted Debris (IRD) content (discovered by [16]) have been explained by the melting of numerous icebergs in this region, which additionally provided a huge freshwater input to the North Atlantic. Modelling studies have shown that such an input would cause the thermohaline circulation (THC) to collapse, cooling the surface of the North Atlantic [8,11,13,17]. The succession of D/O events – that is of abrupt cooling and warming – cannot only be seen in Greenland ice-core records, but also in a few sediment cores where the 18O/16O ratio measured in the calcite of planktic foraminifera shells is showing the same type of oscillations. In the core of Shackleton et al. [19], the benthic signal looks similar to Antarctic ice core records and might be caused by temperature changes or by a water signal with low oxygen-18 content. The interpretation given by the authors of the original paper will be here re-assessed, together with a thorough analysis of the planktic signal.
2 Modelling approach
Recently, Ganopolski and Rahmstorf [4] have suggested a mechanism to reproduce temperature oscillations such as D/O events. It involved the input of a freshwater – or salt – flux to the North Atlantic to trigger changes in modes of the thermohaline circulation in a coupled climate model. Depending on its strength, the input of freshwater slows (as part of the D/O oscillation) or shuts down (Heinrich Event) the THC, inducing cooling periods for the North-Atlantic temperature. The input of a salt flux accelerates the THC, therefore warms the North Atlantic and consequently the temperature over Greenland. This mechanistic approach yields temperature variations consistent with those recorded in Greenland and Antarctic ice cores, but does not provide any explanation of the cause of the D/O events. The water forcing for the D/O events is here relatively small and could be related to some fairly regional changes in the precipitation–evaporation balance, sea-ice cover changes, etc.
Here, we aim at evaluating this scenario against the data and at showing the efficiency of an approach based on modelling an isotopic proxy in a climate model to better understand the sediment core record and to suggest improvements to the model. Therefore, we are using the same model of intermediate complexity, called CLIMBER-2 [12], in a version [15] including the 18O isotope to compare directly the model output and the isotopic data. The freshwater input scenario used here is shown in the first panel of Fig. 1. As in [4], the freshwater input is set in the Atlantic Basin, centred at 60°N. This is where the thermohaline circulation is most sensitive to changes in surface salinity, hence to the applied freshwater – or salt – signal. As we are also modelling the oxygen-18 isotope, we need an additional parameter in this scenario, namely the oxygen-18 content of the freshwater input. As we do not know the process that leads to the D/O events, we decided not to give a specific 18O signature to the flux associated with these events. One would need to understand the process correctly to apply the appropriate value. Besides, the D/O events are recognized to be mainly a temperature signal both from ice cores and sediment cores. If it is indeed the case, then we should be able to reproduce correctly the temperature and the oxygen-18 signal without any specific isotopic content for the additional freshwater flux. As for the HEs, we already stated that the mechanism involved is the melting of numerous icebergs in the North Atlantic. The ice-sheets of the last glacial period are known to have a much depleted content in the oxygen-18 of the ice. This means that the water associated with the melting of icebergs should have also a much depleted content. We are using here a value of , typical of low-altitude Greenland ice cores (e.g., in [7]).
3 Model results
Results of the model integration are shown in Fig. 1 for the Atlantic basin at 40°N. The oxygen-18 for calcite of the surface layer and at depth (3000 meters deep) is shown on panels (b) and (e), respectively. Results are expressed in standard delta notation defined as follows:
4 Model to data comparison
Comparison between the results of our simulation and the data of the core MD95-2042 [19] is shown in Fig. 2. The sediment core record is on its own depth scale. At first glance, and apart from some variability in the record that we do not reproduce, our results agree fairly well with the sediment record. One feature we miss to reproduce here is the correct absolute value at depth (benthics). Where our model produces a calcite signal between 3.5 and 4.2‰, the benthic record exhibits values between 4.25 and 4.75‰. There are potentially two reasons for this mismatch: (1) as was already noted by [15], the model might not be cold enough in the deep during glacial times that translate into too light isotopic values for the simulated calcite; (2) we did not add a global 18O shift to account for ice-sheet build-up with low oxygen-18 content. At the Last Glacial Maximum (LGM), this enrichment is of 1.2‰ [3]. It is however difficult to assess what was the value of this enrichment in the time frame we are looking at here (40-kyr BP). Northern hemisphere ice-sheets were about half the size of the LGM ones, but there is no obvious reason for this enrichment to be linear with the size of ice-sheets [9]. Therefore, the shift here could be anything between 0.3 and 0.8‰. When thinking in terms of relative values, the amplitudes simulated here are in very good agreement with data for the planktic signal and somewhat overestimated for the benthics, this latter both for the D/O events and HE (by at least 0.2‰). This mismatch at depth suggests that we miss or represent incorrectly some process(es). Looking back at the relative importance of the temperature and signals, it seems plausible that the diffusion of warmer waters to the deep when the THC slows down is over-estimated and that the effect on temperature should be smaller (by 1 °C to match the data record). Some data are also suggesting that the temperature could actually be colder during HE [20]. An interesting feature seen in Fig. 2 is the relative maximum seen in the record of planktonic foraminifera during the HE. The modelled signal also presents such a relative maximum, although weaker than in the sediment record. As was discussed in Section 3, this relative maximum is, in the model, the imprint of the melting signal of North Atlantic, advected to the site. It is tempting to interpret the sediment record as such. To try to match the amplitude of the relative maximum of the data record, we tried some experiments with a stronger freshwater flux during HE (not shown). However, this does not modify the obtained result, since much of the added freshwater goes northward in the Arctic. To obtain better amplitude of this signal, one would then need to apply the meltwater signal more to the south, around the IRD belt. The mapping of the surface anomaly during the HE4 [2] shows indeed that a low 18O anomaly – logically associated with the melting of icebergs – exists in this region. This implies in turn that the melting of icebergs did occur around 45 to 55°N and that applying the freshwater flux more to the north (e.g., 60°N in the scenario used here) is inconsistent with the data.
5 Conclusions
Comparing data from a sediment core and the output of a coupled climate model including the oxygen-18 for a period of time covering the HE4 and the surrounding D/O events provide insights into the interpretation of the sediment core record and the setting of the model experiment. We showed here that (1) assuming that there was no additional 18O flux to the ocean at the time of D/O events enables a favourable comparison with the data record, suggesting that the planktic record is showing essentially a temperature signal – the cause of these events remains unclear, but the implication of this absence of strong 18O signal seems to rule out considerable melting from ice-sheets – and (2) that using a meltwater flux for Heinrich Events in another location than the IRD belt leads to a mismatch with the palaeorecord we compared to. The interpretation of the relative maximum in the planktic record at time of HE4 needs also to be confirmed by looking for this signal in other sediment cores in the North Atlantic. There is also indication that the model in its current setting might overestimate the vertical diffusivity in the deep ocean, leading to a mismatch with the benthic data record. This would need to be tested by comparing with other benthic records to assure that we indeed capture the correct mechanism. This first study demonstrates the validity of the method for improving both model scenarios and comprehension of the sediment core records. It will need to be pursued by extensive comparison to other sediment core records to draw better conclusions for the whole North Atlantic.