

Version française abrégée
1 Introduction
Avec le récent carottage de NGRIP, ce sont maintenant vingt-cinq événements climatiques de type Dansgaard/Oeschger (D/O) qui sont dénombrés clairement dans les carottes de glace du Groenland [36]. Plusieurs d'entre eux ont atteint des amplitudes thermiques de plus de 10 °C au Groenland [25,30,31] et ont été clairement enregistrés dans les carottes marines de l'Atlantique et de la Méditerranée, démontrant un couplage important entre l'atmosphère et l'océan, au moins pour l'hémisphère nord [5–7]. La conséquence de ces événements sur le continent est, en revanche, beaucoup moins bien connue, du fait de la rareté d'archives bien datées avec un signal climatique bien préservé. Ce que l'on sait, grâce à l'analyse palynologique de plusieurs lacs du Massif central et d'Italie, est que l'influence de ces variations climatiques millénaires a été ressentie par la végétation jusqu'en Méditerranée centrale [1,16]. Les D/O ont aussi eu un impact important sur la circulation atmosphérique et la mousson d'Asie du Sud-Est en particulier, comme l'a montré le remarquable enregistrement des spéléothèmes de la grotte de Hulu (Chine) [51]. Les enregistrements montrant clairement l'impact des D/O sur l'environnement (climat, végétation) en Europe au cours de la dernière période glaciaire sont rares. Nous présentons ici les résultats de l'analyse de trois types d'archives paléoenvironnementales, qui apportent des informations complémentaires sur l'impact des D/O en Europe de l'Ouest : (1) l'enregistrement palynologique de la carotte ODP 976 en mer l'Alboran, qui nous renseigne directement sur la végétation du Sud de l'Espagne et de l'Afrique du Nord ; (2) un enregistrement isotopique (C) de quatre stalagmites de la grotte de Villars (Sud-Ouest de la France), qui montre la variation de l'activité végétale et biopédologique liée aux D/O et qui donne une chronologie absolue précise pour plusieurs de ces événements, avec toutefois quatre hiatus liés à des seuils climatiques ; (3) la séquence de lœss de Nußloch (Ouest de l'Allemagne), où une modélisation inverse utilisant BIOME4 et le C de la matière organique (MO) a permis une reconstruction des paléoprécipitations, mais qui a malheureusement une résolution temporelle inégale.
2 Sites et chronologies
Les trois sites s'alignent selon une direction SW–NE depuis le Sud de l'Espagne pour la carotte marine ODP 976 (36°12′N, 4°18′W, 1,108 m sous le niveau de la mer [8]) jusqu'à l'Allemagne de l'Ouest, où se situe la séquence de lœss de Nußloch (49°19′N, 8°43′E, alt.=221 m ; [20]) ; la grotte de Villars (Dordogne : 45°30′N, 0°50′E, altitude 175 m ; [11]) se situant entre ces deux sites.
La chronologie du carottage ODP 976 est basée sur 13 analyses 14C (AMS) [8]. Les âges 14C, corrigés de l'effet réservoir et calibrés, concernent la partie récente de l'enregistrement ; la partie plus ancienne est calée, d'une part, avec les stades isotopiques du site ODP 976 et, d'autre part, avec la chronologie de la carotte MD 95–2042, située au large du Portugal [8,14,43–45]. Enfin, les âges ont été ajustés en comparant les courbes palynologiques avec les stades isotopiques de NGRIP [36].
Soixante-neuf datations par U/Th par thermo-ionisation par spectrométrie de masse (TIMS) ont été effectuées sur les quatre stalagmites de la grotte de Villars ([12] et données non publiées ; points datés en bas de la Fig. 2d). Pour la plupart des échantillons, l'erreur sur l'âge à est inférieure à 2 %, donnant ainsi une des meilleures chronologies absolues sur le continent européen pour cette période.
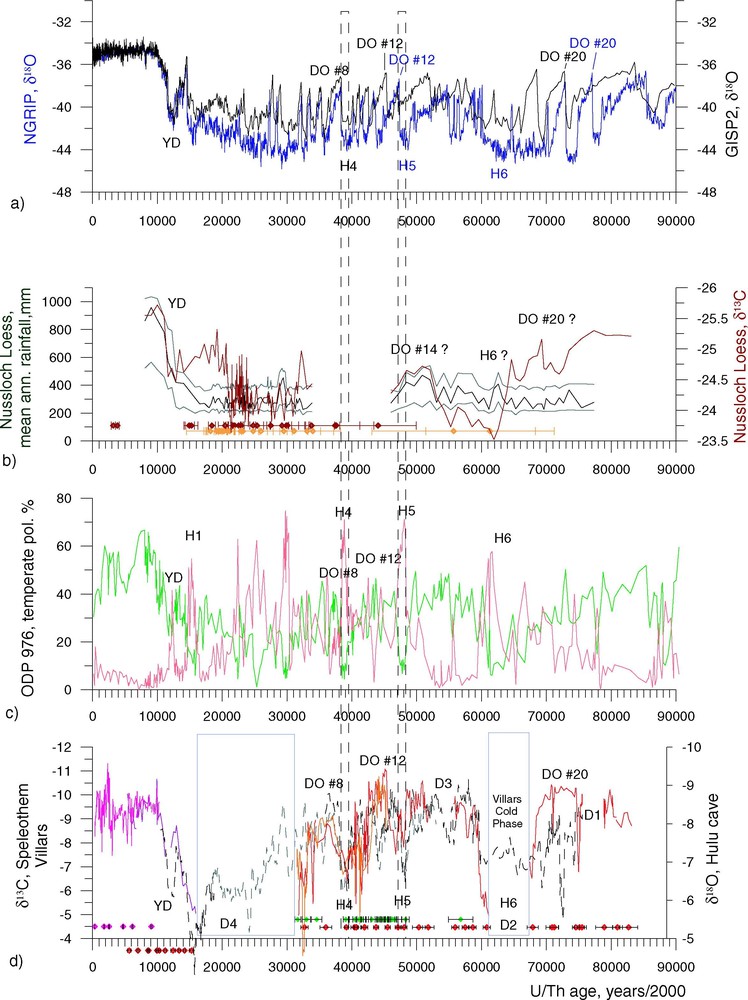
Palaeoclimatic records of the last 90 kyr in western Europe. (a) Blue: NGRIP ice core O with the ss09sea chronology [24,36], black: GISP2 O [15]. (b) Nußloch loess sequence: red, C of the OM; black: mean annual rainfall with 2 σ errors (grey curves); at the bottom of the curve: 14C and OSL dated points with 2 σ and 1 σ error bars, respectively. (c) Pollen records of the ODP 976 marine core; green: temperate taxa (see text); red: semi-desertic taxa. (d) Villars stalagmite C record with dated points at the bottom with 2 σ error bars. Hulu cave speleothem O record [51] (black dashed line).
Enregistrements paléoclimatiques des derniers 90 ka en Europe de l'Ouest. (a) En bleu : O de la glace de NGRIP [36], avec la chronologie ss09sea [24] ; en noir : O de GISP2 [15]. (b) Séquence loessique de Nußloch. En rouge : C de la MO ; en noir : précipitations moyennes annuelles (en mm), avec les erreurs à 2 σ (gris clair) ; en bas, points datés par 14C et OSL, avec les erreurs à 2 σ pour 14C et 1 σ pour OSL. (c) Enregistrement palynologique de la carotte ODP 976 de la mer d'Alboran. En vert : assemblage des taxons tempérés (arbres etc., voir texte), en rouge: assemblage des taxons semi-désertiques. (d) C des stalagmites de la grotte de Villars avec, en bas, points datés en UTh (TIMS) avec leur incertitude à 2 σ. O des spéléothèmes de la grotte de Hulu, Chine [51] (courbe noire).
La chronologie de la séquence loessique de Nußloch est basée sur 22 datations 14C sur matière organique lœssique (15), bois (4), os (1), carbonate de coquille de gastéropodes (1), conchioline (1) de 3 à 42 kyr BP et 21 datations IRSL/OSL de 19 à 122 kyr [21,32]. Les ages 14C postérieurs à 20 kyr BP sont calibrés selon Calib 4.3 [47], et les plus anciens sont corrigés selon la proposition de Kitagawa et Van der Plicht [29]. La chronologie utilisée ici est obtenue par extrapolation linéaire entre les valeurs médianes des intervalles de datation.
3 Résultats
Les proxy présentés ici sont les suivants :
- – pour le site ODP 976 : assemblages polliniques : (1) de taxons tempérés composés d'arbres tels que Quercus, Fagus, Carpinus, Corylus, Alnus, Betula, Tilia, Ulmus... , associés avec Ericaceae, qui reflètent des conditions relativement chaudes et humides, typiques d'un interstade ; (2) de taxons semi-désertiques composés de Artemisia, Amaranthaceae–Chenopodiaceae et Ephedra, indicateurs de conditions froides et sèches, typiques des stadiaires ;
- – pour le site de Villars : le C de la calcite des stalagmites, qui est lié à la densité de végétation et à l'activité biopédologique, elles-mêmes dépendantes du climat ; ainsi, un C faible (env. ) est caractéristique de conditions tempérées relativement chaudes et humides, alors qu'un C élevé (env. ) est lié à des épisodes froids où l'activité végétale est fortement ralentie [12] ;
- – pour la séquence de Nußloch : le C de la MO, qui reflète la signature isotopique originale de la végétation. L'amplitude de variation des C, de −23 à , montre que la végétation est restée de type photosynthétique C3 [20]. Aussi, les variations de C observées sont-elles interprétées en termes de changement environnemental faisant intervenir la composition isotopique et la concentration du CO2 de l'atmosphère, la disponibilité en eau, la température, le type de sol et l'insolation. Une modélisation inverse avec Biome4 [19,22,26] permet de déconvoluer le signal, d'éliminer les composantes globales et, ainsi, de simuler les conditions climatiques ayant généré de tels C et donc de reconstituer les paléoprécipitations [19].
Grâce à la nature différente de ces trois enregistrements paléoclimatiques, on obtient un ensemble cohérent et complémentaire des conditions environnementales qui prévalaient en Europe occidentale au cours des derniers 90 ka (Fig. 2). Alors que les assemblages polliniques du site ODP 976 montrent de façon remarquable les événements froids (Heinrich H1 à H6) grâce aux taxons semi-désertiques, les événements chauds et humides sont clairement enregistrés dans les taxons tempérés de la même carotte, mais aussi dans le C et les phases de croissance des stalagmites de Villars (D/O #7 à D/O #20 ; Fig. 2). Pendant les épisodes de froid extrême, qui correspondent globalement aux stades MIS 4 et MIS 2, la croissance des stalagmites de Villars s'est arrêtée (hiatus D2 et D4 ; car l'activité végétale s'est fortement ralentie ainsi que l'écoulement), alors que la sédimentation s'est poursuivie à Nußloch (MIS 2) et au site ODP 976 permettant un enregistrement clair des variations climatiques pendant ces périodes.
3.1 Assemblages polliniques de ODP 976
Au cours des derniers 90 000 ans, les courbes polliniques obtenues sur le site ODP 976 montrent une rythmicité de grande amplitude, qui traduit des modifications cycliques de la végétation entre des forêts tempérées décidues à Quercus (chêne) et des semi-déserts à Artemisia (armoise) (Fig. 2c). Ces changements de végétation évoquent des variations climatiques entre des conditions chaudes/humides et froides/sèches. Ils sont corrélés avec les oscillations de Dansgaard/Oeschger répertoriées dans les carottes de glace du Groenland. Ainsi, les interstades correspondent au développement de la forêt tempérée, tandis que les stadiaires sont exprimés par l'extension du semi-désert. Six stadiaires sont particulièrement drastiques, avec un semi-désert très développé et une forêt réduite à son minimum. Ils traduisent une intense aridification de l'Ouest méditerranéen et sont associés, dans les environnements marins, à des périodes de refroidissement des eaux de surface qui sont corrélées avec les événements de Heinrich 1 à 6 [8,27].
3.2 Isotopes des spéléothèmes de Villars
Le profil en C de Villars, fait à partir de quatre stalagmites, possède quatre hiatus, qui correspondent à des arrêts de croissance liés à des conditions froides (D2, D4 ; Fig. 2) ou à d'autres causes toujours incertaines (froid, inondations, D1, D3). Les périodes d'arrêt (67,4–61,2 ka et 31,6–15,9 ka) sont cernées par une dérive progressive du C, démontrant le changement graduel des conditions climatiques à leurs abords. La phase froide correspondant au hiatus D2 (ou Villars cold phase) est un élément majeur de cette séquence, qui montre qu'un climat froid a empêché l'infiltration et la croissance des stalagmites pendant plus de six mille ans. On peut l'associer au MIS 4 et au H6, lui aussi bien enregistré, d'une part, dans la carotte ODP 976 par un pic important (en amplitude et en durée) de taxons semi-désertiques (Fig. 2c) et, d'autre part, dans le O de NGRIP, avec des valeurs minimales proches de (Fig. 2a). Dans la séquence de Villars, les D/O montrent une variation typique de dans le C (Fig. 2d), qui peuvent être mises en correspondance avec les O élevés des carottes de glace (Fig. 2a). Le D/O #8 apparaît comme le dernier événement chaud majeur avant le maximum glaciaire ; il s'inscrit dans une tendance générale au refroidissement qui semble avoir débuté dès l'optimum du D/O #12 il y a environ 45 ka et s'est terminé avec les arrêts synchrones des deux stalagmite Vil-stm9 et Vil-stm27 il y a (Fig. 2d). Les phases froides qui entourent les D/O sont en accord avec les pics des taxons semi-désertiques de ODP 976 et correspondent aux événements de Heinrich : H4 et H5 sont bien visibles, avec des valeurs de C élevées (attention à l'échelle inversée sur la Fig. 2d), H6 correspondant au hiatus D2, H2 et H3 au hiatus D4. Mais l'événement chaud le plus marqué est certainement le D/O #12, qui a atteint son maximum il y a et dont les valeurs de C sont proches de celles des dépôts de calcite moderne ( à ), ce qui suggère des conditions climatiques voisines de l'Actuel. Enfin, la partie la plus récente de la séquence de Villars montre clairement la déglaciation : le réchauffement, marqué par la diminution du C et par la reprise du concrétionnement, est daté de ; le C diminue alors de plus de , jusqu'à un optimum daté à .
3.3 Séquence de Nußloch
La modélisation en mode inverse utilisant le C de la séquence lœssique de Nußloch simule des précipitations variant de à tout au long de la dernière glaciation, bien en dessous de la valeur actuelle de . Cette aridité est en accord avec les études pédologiques et malacologiques [2,35].
Avant 28 kyr BP, les paléoprécipitations présentent de grandes oscillations de 150 à . Ces fluctuations sont similaires et contemporaines des événements de D/O. Aussi, l'événement proche du D/O 14, associé à une augmentation de température de 10 à 12 °C au centre de la calotte du Groenland [9,30,33], semble correspondre à une augmentation des précipitations de (). Cette similarité entre l'enregistrement climatique de Nußloch et celui des glaces du Groenland souligne le lien étroit entre le régime de précipitation en Europe du Nord-Ouest, la taille des calottes de glace polaire et continentales, le niveau marin et par conséquent, la position du front polaire. Toutefois, de par les incertitudes sur la chronologie ancienne de la séquence de loess, la mise en coïncidence des évènements de D/O entre les lœss et les enregistrements glaciaires doit rester prudente.
Alors que le niveau marin est au plus bas ( sous le niveau actuel) entre 28 000 et 17 000 ans [49], le régime des précipitations est relativement constant, autour de 280 mm an−1. Dans ces conditions particulières où la Manche est émergée, l'influence des flux d'air océaniques sur Nußloch est considérablement réduite. Nußloch est donc moins sensible aux changements de position du front polaire pendant cette période de temps.
La déglaciation est caractérisée par des valeurs de précipitation plus importantes, autour de 9000 ans BP, décroissant jusqu'à vers 8000 ans BP puis rejoignant le niveau actuel de 800 mm an−1.
1 Introduction
Thanks to the recent NGRIP core completing the GRIP and GISP2 cores, 25 Dansgaard/Oeschger (D/O) events have now been enumerated in Greenland records [36]. Several of these millennial-scale climatic events have reached air-temperature changes greater than 10 °C in the Greenland sites [25,30,31]; they are also detectable in the water temperature and sediments of North-Atlantic and Mediterranean marine cores, demonstrating their great link between the atmosphere and the ocean, at least in the Northern Hemisphere [5–7]. However, their consequences on the continent are still not well known, because of the scarcity of well-preserved and well-dated records. What we know is that the ocean–atmosphere system was closely coupled as far as in the central Mediterranean region, where the vegetation, reconstructed thanks to pollen lake records, reacted very quickly and sensitively to these abrupt climate changes [1,16]. The D/O events had also a large impact on the atmospheric circulation, and on the monsoon intensity specifically, as far as eastern China, as the remarkable Hulu Cave O records have shown [50]. But up to now, there has been very little information about their impact on the European continent. Here we present results from three kinds of palaeoenvironmental records that give an initial pattern of the D/O impact on western Europe: (1) a pollen assemblage record from the ODP 976 marine core, in the Alboran Sea, that is directly controlled by the nearby continental vegetation of Southern Spain and North Africa; (2) a C record of stalagmites from the Villars Cave, southwestern France, that recorded past vegetation and soil activity and gives an accurate chronology of several of these events with four hiatuses; (3) a loess-deposit sequence whose C inverse modelling brings a useful rainfall reconstruction around the Nußloch area, in western Germany, with an irregular temporal resolution.
2 Studied sites
The three studied records are located along a SW–NE profile from southern Spain (core ODP 976) to western Germany (Nußloch loess sequence), the Villars Cave in South-France being situated between theses two sites (Fig. 1).
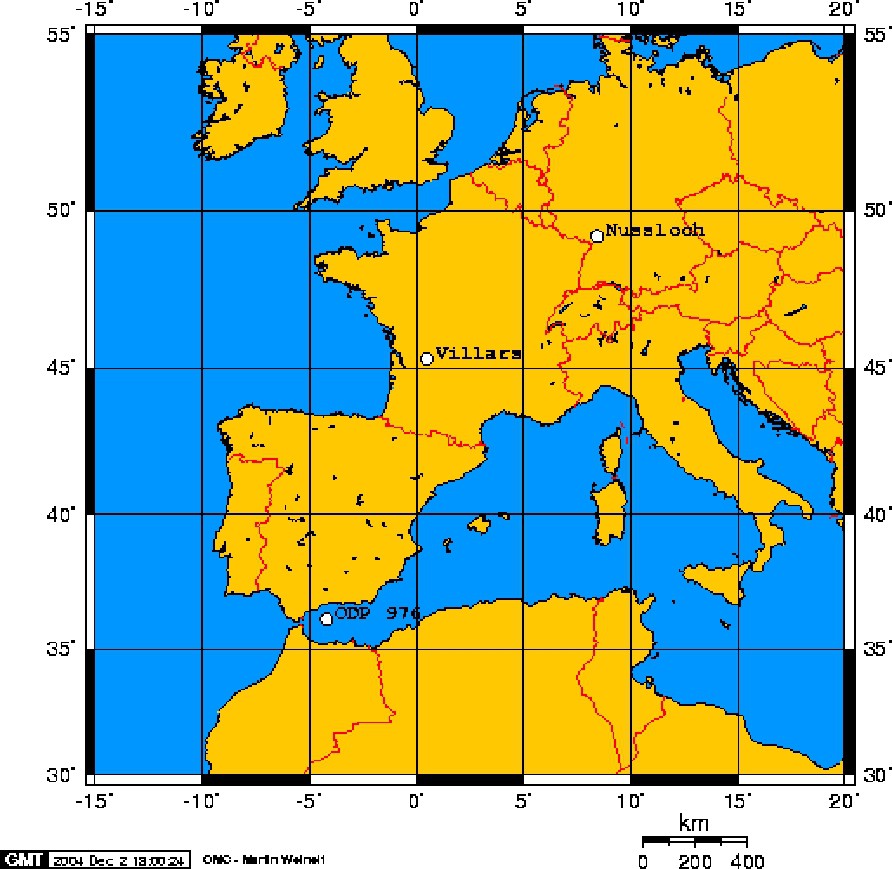
Localisation of the studied sites: Alboran Sea marine core ODP 976 (36°12′N, 4°18′W, 1108 m water depth), Villars Cave (southwestern France; 45°30′N, 0°50′E, elevation 175 m), Nußloch loess section (49°19′N, 8°43′E, 221 m asl).
Position des sites étudiés, du sud au nord : carotte marine ODP 976 de la mer d'Alboran (36°12′N, 4°18′W, 1,108 m profondeur), grotte de Villars (Sud-Ouest de la France; 45°30′N, 0°50′E, altitude 175 m), Nußloch loess section (49°19′N, 8°43′E, altitude 221 m).
Ocean Drilling Program (ODP) Site 976 has been drilled in the Alboran Sea, the westernmost section of the Mediterranean Sea (36°12N, 4°18W, 1108-m water depth), close to the Strait of Gibraltar. This record provides new insight into the evolution of terrestrial palaeoenvironments during the past 90 000 years, which enables a direct correlation with climates in the larger northern-Europe area.
The Villars Cave (southwestern France; 45°30′N, 0°50′E, elevation: 175 m), developed in Bajocian limestone at depths from 10 to 40 m from the surface. Its environmental setting is detailed in [3,11]. The four stalagmites studied here (Vil-stm9, Vil-stm10, Vil-stm11, Vil-stm27) developed in the deepest part of the cave, about 30 to 40 m below the surface. They were all dated by uranium–thorium method by thermal ionisation mass spectrometry (TIMS UTh), and stable isotope profiles were performed along their axis with sampling spaced at about 3 mm, giving a high-resolution continental record of the last 82 kyr [12].
The Nußloch loess section is located on the right bank of the Upper Rhine graben in southern Germany (49°19′N, 8°43′E, 221 m asl, 800 mm yr−1 of mean annual precipitation). The geomorphological setting is characterized by a wide alluvial plain and an abrupt increase in elevation to the east. During the Weichselian Pleniglacial, loess accumulated on the slope and the adjacent hill country, producing a series of large loess dunes. The last interglacial/glacial climatic cycle is represented by the uppermost 20 m of loess, with a temporal resolution higher than 1 m for 1000 years for the typical loess of the pleniglacial Weichselian. An erosion hiatus eliminates the BP phase out of the deposit. This sequence constitutes the key-section of western Europe [19,20,40].
3 Methods and chronologies
3.1 Dating methods
The chronology is a key point in the interpretation and the comparison of several palaeoclimatic records. The three records that are presented here have great differences in their timescale accuracy and in their palaeoclimate signals. Taken alone, none of these archive types possesses all the best ‘qualities’ (i.e., best chronology, best climatic signal); they are however complementary: while speleothems, thanks to UTh ages, have the most accurate chronology, they do not have the easiest interpretable palaeoclimate signal, which is the opposite for the pollen record. At the same time, hiatuses due to too cold and dry periods that are marked in the speleothems by a thin brown layer, are extensively recorded in the loess deposits.
3.1.1 ODP 976 chronology
The chronology of the ODP site 976 is first based on 13 accelerator mass spectrometry (AMS) radiocarbon ages [8]. This chronology has been completed by other control points obtained according to the correlation between the Oxygen Isotope curve of ODP site 976 [8,14] and the reference curve of the core MD 95-2042 off Portugal [43–45], especially for the older part of the series. Because of the similarity in the pollen curves and the Greenland records [15,36], after being established by linear interpolation between the dates and oxygen isotope control points, the age model has been refined by correlation between pollen and North Grip records down to 120 000 yr [36].
3.1.2 Villars cave speleothems chronology
Sixty-nine UTh ages by thermal ionization mass spectrometry (TIMS) have been performed on the four studied stalagmites from the Villars Cave ([12] and unpublished data; Fig. 2). Details of the method are explained in Genty et al. [12,13]. When necessary, a 232Th correction has been performed in order to take into account the detrital origin of the 230Th. Final error is given at , which is, for most samples, lower than 2% of the age (see error bars at the bottom of Fig. 2) generating among the best-dated continental sequence.
3.1.3 Nußloch loess deposit chronology
The chronology of the Nußloch loess sequence is based on 22 14C datings performed on bulk organic matter (15), wood (4), bones (1), carbonate gastropod shells (1), conchioline (1) ranging from 3 to 42 kyrs BP and on 21 IRSL/OSL datings ranging from 19 to 122 kyr [21,32]. Ages younger than 20 kyr BP were calibrated using the Calib 4.18 program [47] and older ages were ‘corrected’ according to the Kitagawa and van der Plicht study [29]. The chronology used here was established by linear interpolation between median values of the dating ranges.
3.2 Measurement methods and proxy significance
3.2.1 ODP 976 palynological method
Pollen process follow a standard protocol already described in Combourieu Nebout et al. [8]. Palaeoenvironmental interpretation of the down-core pollen assemblage fluctuations is based on the assumption that the primary pollen contribution to Alboran-Sea sediments comes from west-Mediterranean borderlands. Modern environments range from a thermo-Mediterranean belt with Olea, Pistacia and some semi-desert representatives (Artemisia, Chenopodiaceae, Ephedra) to a meso-Mediterranean belt, represented by a sclerophyllous oak forest then a humid-temperate oak forest (Euro-Siberian trees as Quercus, Betula... , and Ericaceae), and a supra-Mediterranean belt, with a cold-temperate coniferous forest (Pinus, Abies, Cedrus) at the higher altitudes [37,39] (Fig. 1). Today, the area experiences long dry summers and mild rainy winters. The pollen spectrum, based on 120 pollen taxa, ranges from semi-desert to mountain deciduous and coniferous forest.
Interpretation of the pollen spectrum follows the modern climatic-plant relationships in Eurasia and northern Africa [38,52]. Here, we present the variations of pollen percentages of two main associations (Fig. 2):
- – the temperate association composed of Euro-Siberian trees like Quercus, Fagus, Carpinus, Corylus, Alnus, Betula, Tilia, Ulmus... , associated with Ericaceae, which reflects warmer and moist climate characteristic of interstadials;
- – the steppe to semi-desert association, composed of Artemisia, Amaranthaceae-Chenopodiaceae and Ephedra, whose high representations in pollen spectrum indicate dry and cold climatic conditions of stadials.
3.2.2 Stable isotope measurements on Villars cave speleothems
Samples have been taken every 1 to 3 mm, along the centre of the growth axis and analysed with the standard procedures on a VG OPTIMA leading to analytical error [12]. The isotopic equilibrium, checked in two ways [23], leads to the conclusion that great kinetic fractionation is not likely, and, at places where it may have occurred ( and slight enrichment toward the edges), the overall C signal goes in the same direction as the climate changes.
Speleothem calcite O is controlled by several environmental factors that can act in opposite ways, leading to complex interpretations where rainfall amount or temperature intervene [4,28,46]. On the other hand, the speleothem C changes can be interpreted as evidence of vegetation density and soil activity changes for the following reasons: (1) the main sources of the carbon in speleothem calcite is the soil CO2 as demonstrated in former studies [13]; (2) C decreases when the soil activity and the vegetation respiration is efficient and increases when the climate degradation has slowed down this soil and vegetation activity. Changes in the C4/C3 plant ratio suggested in other studies [10] cannot be invoked here as, until now, no evidence of C4 plants has been found in this area during the last Glacial.
3.2.3 Nußloch Loess deposit isotope measurements and BIOME 4 modelling methods
For the isotopic study, the Nußloch sequence was sampled by taking 1 to 2 g of sediments at intervals of and analysing bulk carbon isotopic composition. The C values vary from −25.72 to . The absence of pedogenesis and the dry glacial environment inducing the degradation of organic matter without distortion of the isotopic signal make typical loess suitable for an organic geochemical study. The carbon isotopic composition (C) of loess organic matter reflects nicely the original isotopic signature of vegetation and informs about palaeoenvironmental conditions. In western Europe, C values ranging from −23 to indicate that, during the last climatic cycle, the vegetation maintained a unique presence of plants following the C3 photosynthetic pathway [20]. Thus C variations were interpreted as changes in environmental conditions, related, firstly, to concentration and isotopic composition of atmospheric CO2 and water availability and, secondly, to temperature, soil type and texture, and insolation.
Vegetation models introduce such great complexity by considering first- and second-order parameters. Recently, one of them, Biome3 [22] has been modified into Biome4, including a carbon isotopes routine [19,26]. This model simulates the biome that would growth in the given climatic conditions, some production parameters (net and growth primary production, leaf area index, etc.) and the mean C of the plant community. This version of Biome4 is used in an inverse mode to reconstruct the most probable climate, i.e., starting from the outputs, to infer some of the inputs of the model. We follow the procedure of Guiot et al. [17] based on a Monte-Carlo sampling of monthly precipitation, and monthly temperature in a pre-defined range (Metropolis–Hastings algorithm, [18]). The output biome and the plant NPP (Net primary Production) are constrained by temperature (annual distribution and absolute value) as well as by precipitation regime. The carbon isotopic composition, greatly dependent on precipitation, narrows the precipitation-variation range.
4 Results and discussion
Thanks to the different nature of the three studied records, we obtain a coherent and complementary pattern of the western-Europe continental environment variations of the last 90 kyr (Fig. 2). While pollen assemblages from the ODP 976 core display obviously well the cold episodes (Heinrich events H1 to H6) thanks to semi-desert taxa, the warm and more humid periods are clearly recorded in the temperate taxa of the same core and also in the Villars stalagmite growth periods and C (D/O #7 to D/O #20). During extremely cold episodes, which broadly coincide with MIS 4 and MIS 2, speleothem deposition stopped because of vegetation and soil activity slowing down and/or a stop in the seepage, which is not the case for the loess deposit at Nußloch nor for the ODP 976 core, where climate variations are still visible during these stages. Finally, thanks to inverse modelling, the Nußloch loess deposit data show by taking off global components (CO2 and C), the high variability of the rainfalls during this period.
4.1 ODP 976 palynological record
High-amplitude shifts during the last 90 000 years are displayed in the pollen record, which indicates quasi-cyclic oscillations of environmental conditions in the westernmost Mediterranean (Fig. 2). High down-core variability of pollen assemblages reflects rhythmic alterations from temperate forest (mainly Quercus) very similar to today's vegetation in the mountain ranges of the western Mediterranean borderlands to semi-desert vegetation as observed today in North Africa and southwestern Europe [50]. These vegetation changes are indicative of repetitive and abrupt climatic changes in the Alboran Sea's borderlands between warm/moist and cold/dry conditions. The pattern of temperate taxa oscillations mirrors the D/O climatic oscillations seen in the Greenland ice core records [1,34] in that 20 increases in temperate vegetation taxa abundance are correlated with the D/O interstadials 1 through 21 (Fig. 2). The colder stadials are characterized by abundant increases in semi-desert taxa. Six of them are particularly extreme, with the lowest occurrences of temperate taxa and the highest representation of semi-desert represented by Artemisia, Ephedra and Chenopodiaceae. Such associations, characteristic of cool steppe to cool desert [48], suggest enhanced aridity on the adjacent westernmost Mediterranean borderlands. Combined marine-terrestrial records at Site 976 [8] and in other cores in the western Mediterranean and off Portugal [42] and results obtained in continental sites [52] have already shown that during the last glacial, aridity increased noticeably in the westernmost Mediterranean borderlands far beyond its present state, in association with a clear cooling of the sea surface waters associated to Heinrich events. Then, the six dry terrestrial episodes recorded in ODP Site 976 seem tightly linked to Heinrich cold events H1 to H6 [8,27].
4.2 Villars Cave C record
The Villars C record, made by the stack of four stalagmites, possesses four hiatuses, which correspond to extreme climatic events that crossed thresholds and prevented stalagmite growth (Fig. 2). Hiatuses D2 and D4 that occurred at 67.4–61.2 kyr (‘Villars cold phase’) and 31.6–15.9 kyr, respectively, are the consequence of a very cold climate that progressively occurred at Villars, as the regular C towards these hiatuses and also the steady increase that is observed just after show. They coincide with extremely low temperatures in the NGRIP record (low O values; Fig. 2), and to cold marine stages MIS 4 and MIS 2. Because D1 (78.8–75.5 kyr) and D3 (55.7–51.8 kyr) hiatuses occurred during stable or low C and O levels, their cause is possibly due to flooding in the Villars Cave, due to very humid periods or, like former hiatuses, to cold periods that seem to correlate with NGRIP O and OPD 976 pollen record; in this case, the transition toward the cold episode was too rapid to have been recorded in the C record.
In the Villars Cave's C record, D/O events #8, #12, #16, #17, #18 and #19 are particularly visible with typically variations (Fig. 2; [12]). A comparison with O Greenland records allows their identification, low C values corresponding to high ice O and thus to warmer conditions and, at least in Greenland, to higher precipitation (Fig. 2). Most D/O ages from Greenland records are within the error limits of our chronology. However, the best fit occurs with the older GISP2 chronology [15] and significant differences are observed for D/O #12, #19 and #20 with the new ss09sea Greenland chronology [24]. The fact that we made double measurements of all the UTh ages on a second stalagmite for the 52–31-kyr period, and that we found similar growth curve and similar C signal, strengthen our UTh-based chronology, at least for this period (orange and red curves, Fig. 2d). D/O #8 displays a regular C decrease from 39.4 to 36.2 ka, whose shape is very similar to another speleothem record from China (Hulu Cave record; [51]). It is the last important warm event before the pleniglacial period recorded in Villars stalagmites, but is already part of a climatic decline trend that started about 45 kyr ago up to the stop of the stalagmites Vil-stm9 and Vil-stm27 about ago (Fig. 2d). Cold phases surrounding the D/O events are in agreement with the semi-desert pollen taxa peaks found in the ODP 976 record, and likely correspond to the Heinrich events: H4 and H5 are well visible with high C values (isotope reversed scale on the figure), H6 corresponds to the D2 hiatus and H2 and H3 to the D4 hiatus. The most pronounced warm event of the studied period is certainly the D/O #12, which reached its optimum (lower C: −10.5 to ), close to present-day values, at . The very high growth rate observed during this stage demonstrates also the high humidity of this period. Finally, the H5-D/O#12 transition, marked by a C decrease by more than 4‰, appears to have occurred in less than 1 kyr.
The most recent part of the Villars record displays clearly the last deglaciation: the beginning of the warming is dated to and the Vil-stm11 C decreased by more than until a climatic optimum dated at . The Younger–Dryas cooling is well marked by a C increase and a growth rate slowing down.
4.3 Nußloch Loess deposit isotope record and rainfall modelling
The inverse modelling simulates palaeoprecipitation ranging from to along the glaciation well below the modern value of about 800 mm yr−1. This aridity is in agreement with pedological and malacological bio-indicators [2,35]. The palaeoprecipitation reconstruction obtained by inverse modelling can be divided into three parts. Prior to 28 kyr BP, the precipitation varies from to , and is relatively constant in the ca 28–15-kyr BP interval. It finally increases during the deglaciation.
The period before 28 kyr BP presents large oscillations of about 150–200 mm yr−1. These are very similar and contemporaneous to some D/O events, as recorded by Greenland ice-cores (NGRIP). The D/O 14, 15, 16, 18 as well as 3 or 4 are particularly well recognizable. The D/O 14, which is associated with a temperature shift of 10 to 12 °C in Greenland [9,30,33], seems to be characterized by a precipitation increase of 200 mm yr−1, i.e. + ca 70%.
The similarity expressed in both ice cores and Nußloch underlines a narrow link between precipitation regime, polar and continental ice-sheets size, sea level and consequently the polar front position. At the first order, ice O changes in ice are linked to those of the atmospheric temperature and depend on the ice-sheet size: the smaller the ice sheet, the more positive the O and the higher the temperature. This pulls the polar front to the North Atlantic high latitudes, favouring a mild oceanic regime over western Europe and over the Nußloch site. Alternatively, during stadials, the polar front moved southwards [41], limiting the entrance of wet air over Europe.
A nearly constant level of precipitation at around 280 mm yr−1 is observed between 28 and 17 kyr BP during full glacial conditions. At this time, the English Channel was mostly emerged (sea level ca 90 m below present conditions, [49]). Such a geographical configuration is consistent with a great reduction in the entrance of the wet oceanic air fluxes. Nußloch is thus less sensitive to the changes of the polar front position during this time interval.
The deglaciation and Holocene onset are characterized by higher precipitation, reaching at ca 9000 years BP and decreasing to around 8000 yr BP, framing the present 800 mm yr−1 (Fig. 2b). The steady increase of the precipitation associated with the deglaciation is interrupted between 14 and 12.5 kyr BP, which it is tempting to relate to the Younger Dryas.
5 Conclusion
This study is an example of a multi-proxy approach to better describe and understand the abrupt millennial scale events that occurred in western Europe during the last 90 kyr. It shows the limits and complementarities of the proxy, each one bringing independent information that can be confirmed or specified by another one. For example, palaeoprecipitations have been reconstructed over western Germany thanks to loess deposits and to modelling; pollen assemblages of a marine core and especially semi-desert and arboreal assemblages have allowed the identification of cold and warm stages, leading to hypotheses on the past vegetation and on the past atmospheric circulation; finally, thanks to speleothems, an accurate absolute chronology on the past vegetation and temperature changes can be established, which is the indispensable step toward any lead and lag comparison with very distant records. These three records show that, during a transition toward a D/O event, the precipitation increases, semi-desert plants are replaced by trees, and vegetation and soil activity increase. From UTh age interpolations, all these changes appear to have been rapid, i.e. from a few decades to a few hundred years. As an example, ago, one of the most important transitions toward a warm climatic event occurred (D/O event #12). It is characterized by a rainfall increase of about 200 mm yr−1 (from 250 to 450 mm yr−1) in the Rhine Valley, by a drastic drop in semi-desert taxa in the Western Mediterranean basin, demonstrating the disappearance of the steppe and by a clear decrease in the C of the speleothem calcite and by a high calcite growth rate, giving evidence of a return to an efficient plant and soil activity in southwestern France. The whole transition, which almost reached the amplitude of a full glacial–interglacial transition, occurred in less than 1.2 kyr between and ; moreover, its last part, whose amplitude covers almost half of the total variation, occurred extremely rapidly in less than the age error (i.e. ) between 45.5 and 45.2 kyr (Fig. 2c and d). Most of the other D/O transitions show a similar rapidity (D/O 9, 10, 19 and 20) and the future challenge will be, first, to get a better accuracy for these climate transitions, thanks, for example, to annual laminae in speleothems in Villars cave and others, and also to get a more complete climate quantification (), in a larger spatial cover, thanks to loess and pollen assemblages. Further analyses of other similar records will permit to obtain a global idea of the timing and amplitude of the D/O events during the last glacial period, to check any time lag between distant records (i.e. south/north, coastal/continental) and then to test hypothetical mechanisms with climatic models.
Acknowledgements
We thank CNRS (France) programs ECLIPSE, PNEDC, the French–Italian Galilee project and EC programs for their financial support. D.G. thanks Hubert Versaveau for access to the Villars Cave, and T. Baritaud for his help in sampling and caving. Vil-stm10 U/Th dates were performed by M. Bar-Matthews (Geological Survey of Israel). Vil-stm9 U/Th analyses were performed by Mabs Gilmour; all other U/Th were performed by B. Ghaleb and L. Isabello at the GEOTOP. N.C.N. thanks the Ocean Drilling Program for giving us the samples for the study. The 14C AMS dates have been measured at the Leibniz Laboratory at Kiel University under the supervision of M. Nadeau and P. Grootes. We acknowledge M.H. Castera and J.-P. Cazet for their efficient technical assistance. C.H. would like to thank Denis-Didier Rousseau and Pierre Antoine, leaders of the EC Program (BIMACEL), and Joël Guiot, who opened the door of the inverse modelling world.