

Version française abrégée
Même si l'existence de variations climatiques rapides est désormais bien documentée dans les glaces du Groenland [14,17,41], dans les sédiments marins, en particulier de l'Atlantique nord [2,6] et à partir de nombreuses séries continentales (par exemple, [16,52]), il reste difficile d'établir de façon précise la séquence des événements dans chacun des différents sites concernés et la rapidité avec laquelle ils surviennent. Dans cet article, nous présentons une méthode qui permet de lever cette difficulté, en s'appuyant sur des mesures obtenues sur un même carottage, ce qui évite les problèmes soulevés par la corrélation d'enregistrements d'origines différentes. Illustrée à partir d'une étude multiparamétrique de la carotte GRIP [14] forée au centre du Groenland (Fig. 1), elle s'appuie, en premier lieu, sur l'analyse conjointe des teneurs en deutérium et oxygène 18 de la glace.
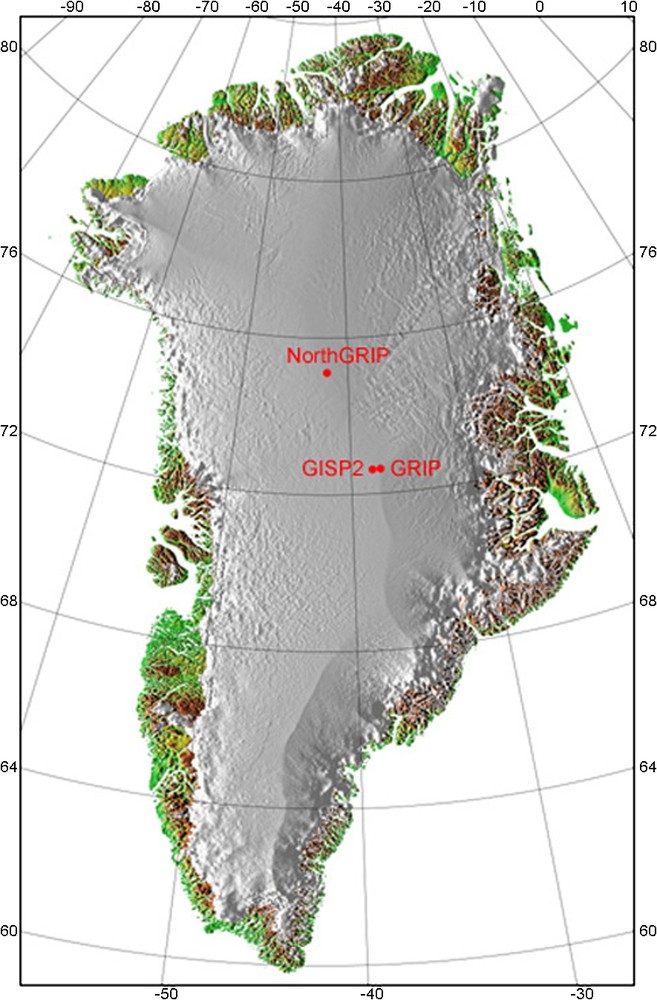
Location of Greenland deep ice core drillings.
Les sites de forages profonds au Groenland.
Cette approche, dont la mise en oeuvre était jusqu'ici limitée aux grands forages de l'Antarctique [25,44–48] repose largement sur les résultats de modèles isotopiques [1,21,40] qui montrent que la teneur isotopique de la glace (deutérium, δD, ou oxygène 18,
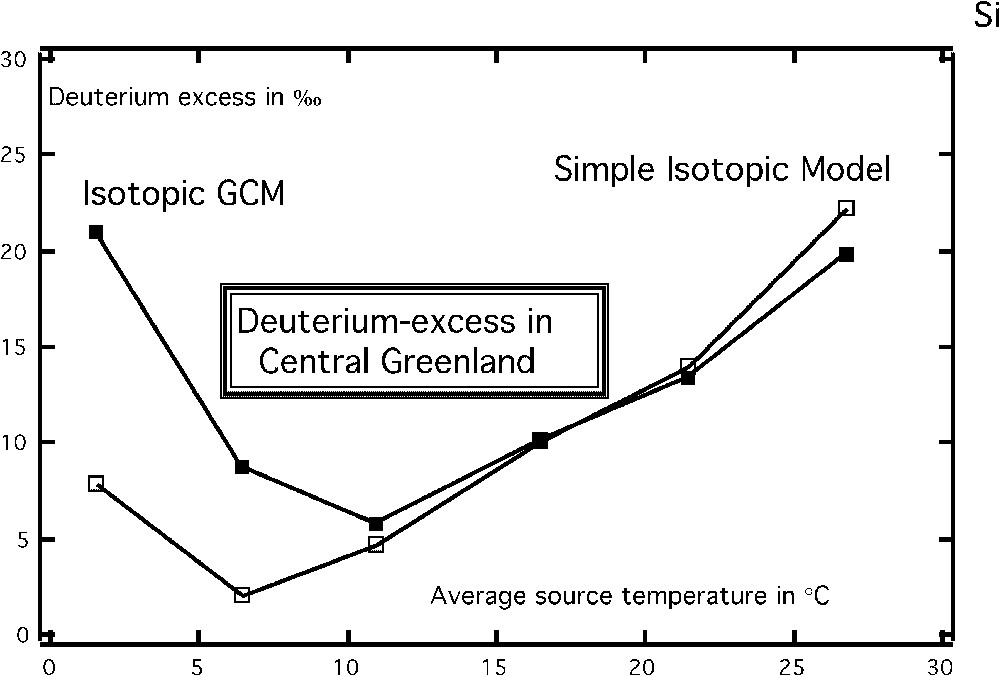
Variation of the deuterium excess in central Greenland precipitation with respect to the temperature of the evaporative source,
Variation de l'excès en deutérium dans les précipitations du centre du Groenland en fonction de la température de la source océanique,
À partir d'une série continue et détaillée (tous les 55 cm) d'analyses conjointes (δD et
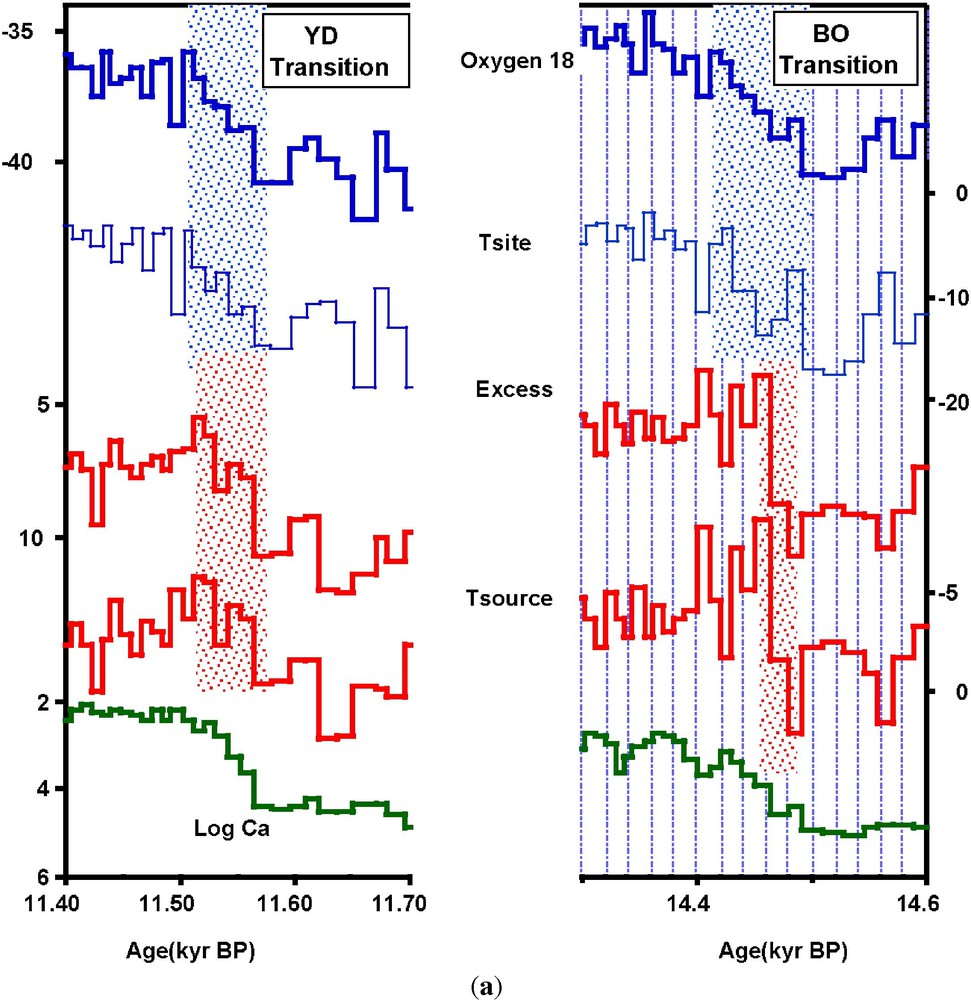
(a) This figure shows, for the transition at the end of the Younger Dryas (on the left) and for the transition leading to the Bölling–Allerod (on the right), a series of five parameters w.r.t. time with; from the top to the bottom: the oxygen-18 content of the ice, the estimated temperature of the site, the excess, the estimated temperature of the oceanic source and the logarithm of the calcium concentration (the three bottom curves are reported using an inverted scale). We have indicated by a shading the period of change of these properties during rapid transitions. This figure is adapted from Masson-Delmotte et al. [39] using data measured on 55-cm samples. Masquer
(a) This figure shows, for the transition at the end of the Younger Dryas (on the left) and for the transition leading to the Bölling–Allerod (on the right), a series of five parameters w.r.t. time with; from the top to ... Lire la suite
(a) Cette figure montre, pour les transitions rapides qui ont pris place à la fin du Younger Dryas (à gauche) et vers le Bölling–Allerod (à droite), une série de cinq paramètres en fonction de l'âge avec, de haut en bas : la teneur en oxygène 18 de la glace, la température du site, l'excès en deutérium de la glace, la température de la source et le logarithme de la concentration en calcium (les trois dernières courbes,
(a) Cette figure montre, pour les transitions rapides qui ont pris place à la fin du Younger Dryas (à gauche) et vers le Bölling–Allerod (à droite), une série de cinq paramètres en fonction de l'âge avec, de haut en bas ... Lire la suite
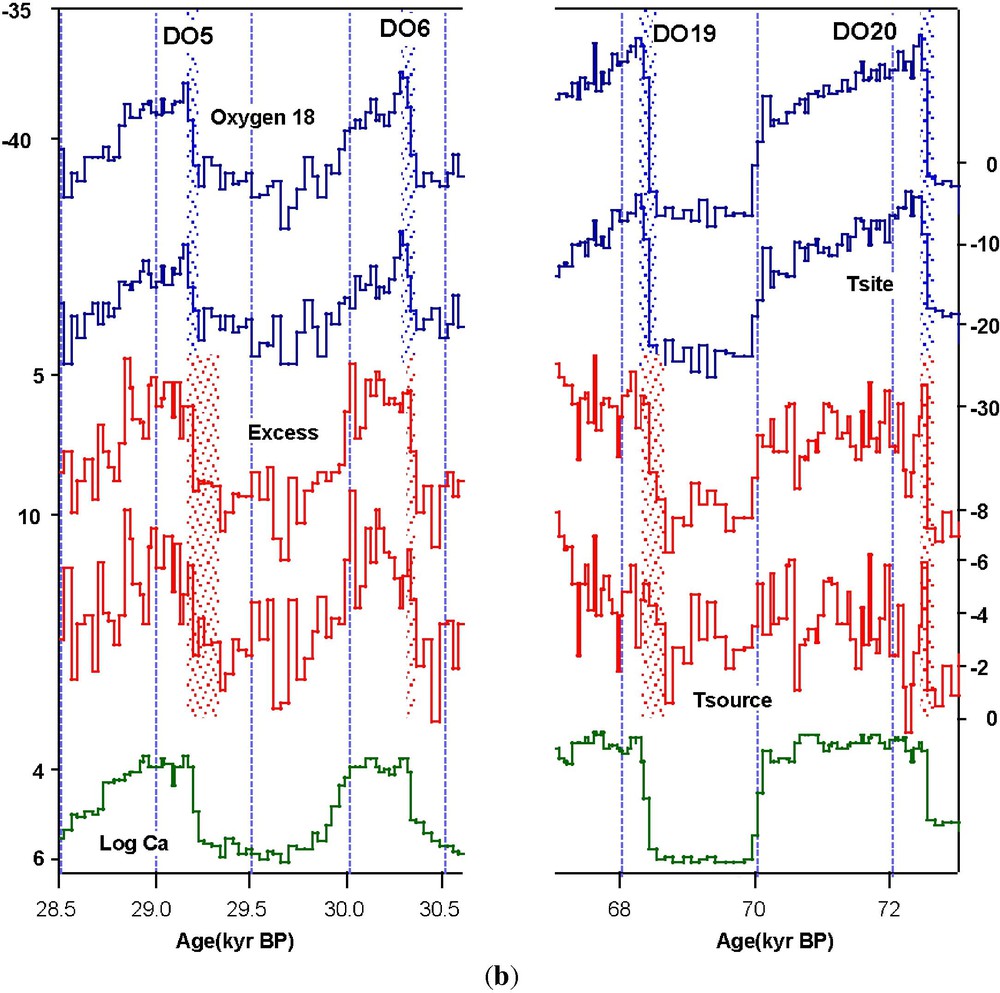
(b) The same as in Fig. 3a for Dansgaard–Oeschger events 5 and 6 (left) and 19 and 20 (right).
(b) Identique à la Fig. 3a pour les périodes correspondant aux événements Dansgaard–Oeschger 5 et 6 (à gauche) et 19 et 20 (à droite).
L'exploitation quantitative des résultats proposée par Masson-Delmotte et al. [39] rend bien compte des nombreuses observations qui, de façon concordante, indiquent qu'une interprétation conventionnelle du profil de teneur en oxygène 18 (basée sur les observations actuelles) sous-estime, dans certains cas d'un facteur deux, les variations de température au Groenland. Les variations de
Le résultat le plus surprenant concerne le comportement, lors des variations rapides, de la source océanique des précipitations du Groenland (avec l'Atlantique nord comme contributeur principal). En cas de réchauffement abrupt du Groenland (lors des événements de Dansgaard–Oeschger ou durant la dernière déglaciation), cette source se refroidit, alors qu'en un site donné de l'Atlantique nord, la température augmente. L'explication tient probablement au fait que cette source océanique se déplace de façon rapide et importante au moment des variations climatiques rapides, auxquelles sont donc associées des modifications drastiques du cycle hydrologique dans l'Atlantique nord. Cette idée est confortée par l'enregistrement de la teneur en calcium (indicateur des apports de poussière d'origine continentale), qui témoigne de variations tout aussi rapides, et généralement en phase, de la circulation atmosphérique.
1 Introduction
The existence of rapid and large changes in the oxygen-18 concentration of Greenland ice cores (Fig. 1) first suggested by measurements performed on the Camp Century and Dye 3 records [11,12], has now been fully documented thanks to the detailed profiles measured along the GRIP [14], GISP2 [17] and North GRIP [41] cores. These rapid isotopic changes occurred under different climate conditions, e.g., at the onset and during the last glacial period (Dansgaard–Oeschger events, hereafter DO), during the last deglaciation (the transition leading to the Bölling–Allerod, BO transition, and the end of the Younger Dryas, YD), and in the Early Holocene (8.2-kyr event). Even if we face difficulties with temperature calibration [8,9,22,23], these isotopic changes correspond, without any doubt, to atmospheric temperature changes as independently demonstrated from measurements of nitrogen and argon isotopes in entrapped air bubbles [32,42,43]. Unlike water isotopes affected by seasonal changes in precipitation [30,53], highly accurate measurements of the isotopic composition of these two permanent gases allow precise estimates of temperature changes at the ice core site, showing warming events of up to 16 °C (DO 19 and DO 24) in probably a few decades [33–36].
As amply illustrated in this volume, these Greenland temperature changes have clear counterparts in the North Atlantic deep sea-cores records [2,6], as well as in numerous records from continental areas (e.g., [16,52]) and from the deep-sea records outside the North Atlantic. However, due to the lack of accurate absolute dating (both for Greenland and oceanic records), the link between records from Greenland and from the North Atlantic (also interpreted as temperature changes with a strong link with the oceanic circulation prevailing in these regions) is still largely based on visual stratigraphy [2,6,49]. Additional information allowing us to tie the Greenland and North Atlantic records come either from common time markers and/or from the comparison of magnetic properties of oceanic sediments with cosmogenic isotopes fallout recorded in the Greenland ice [31,51]. As a result, the correspondence between oceanic and ice core rapid events can, in most cases, be established without any ambiguity. Still, it is difficult to directly assess their exact timing with a precision better than a few centuries. In addition, the rapidity of abrupt oceanic changes cannot be determined with a very high precision, due to the limited resolution of oceanic records, except in special settings such as for laminated sediments from the Cariaco Basin [20]. Ice cores offer a way to circumvent this difficulty. Combining deuterium (the deuterium, denoted D, is the hydrogen stable isotope of mass 2) and oxygen-18 measurements on the same ice sample opens the possibility to access to conditions prevailing in the oceanic regions providing moisture at the corresponding precipitation site. The existence of such a link was first demonstrated applying a simple Rayleigh-type isotopic model, which shows that the deuterium excess parameter (hereafter the excess),
In this article, we present and discuss recently available GRIP deuterium-excess data [28] focusing on rapid changes from the last glacial period and from the last climatic transition. Our purpose is twofold. First, we show how combining deuterium and oxygen-18 measurements allow to link rapid changes occurring in the North Atlantic and in central Greenland and to assess their timing. Second, based on a recent work conducted by Masson-Delmotte and co-authors [39], we describe how the use of both isotopes can lead to improved estimates of temperature changes in central Greenland and give information on concurrent conditions prevailing in the evaporative oceanic source regions.
2 Water isotopes and moisture-source conditions
The deuterium-excess parameter characterizes the isotopic composition of a precipitation in a
Instead, the relatively subtle differences with respect to the MWL are largely governed by the kinetic effect. More important, on the global scale, is the kinetic effect associated with water–vapour evaporation at the oceanic surface. As a result, sea-surface conditions [40] such as relative humidity, temperature and, to a lesser degree, wind speed are key parameters for determining the excess of atmospheric water vapour and precipitation. However, relative humidity shows only small variations under different climatic conditions, at least once averaged over large oceanic regions, as shown from General Circulation Model (GCM) experiments. This implies that relative humidity at the oceanic surface has only little influence on the excess of polar snow, the same reasoning applying for wind speed. In turn, among these three parameters linked with the ocean/atmosphere interface, we are left with the temperature of the evaporative source (hereafter
The fact that this relationship does not hold true for temperatures below 10 °C is attributed to the difficulty of accounting for the effect of seasonal sea ice (there is, in the GCM, coexistence of sea ice and of open ocean in these grid cells). Also, we should point out to the influence of parameters other than
3 The GRIP deuterium-excess record
GRIP is a more than 3-km-long ice core drilled in the frame of a European project: the Greenland Ice core Project. The bedrock was reached in 1992 in this central Greenland site and the continuous
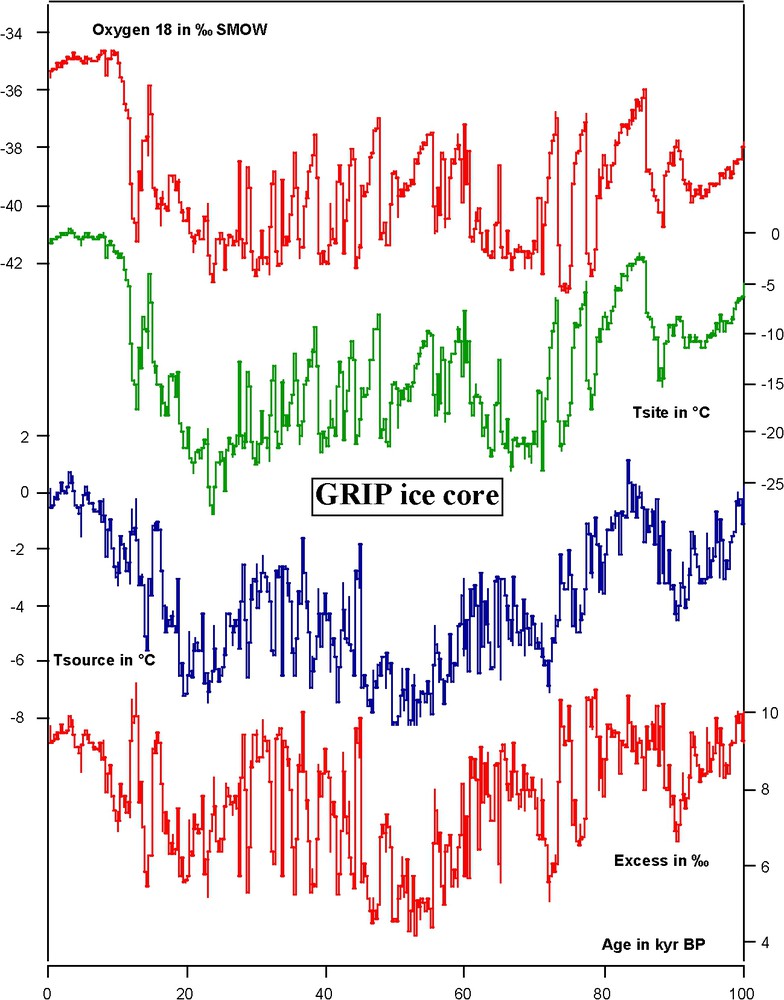
Variation during the last 100 000 years (200-year time step) of the GRIP ice core oxygen-18 (top curve) and of its deuterium excess (bottom curve). Estimations of the changes in the temperature of the site (
Variations au cours des 100 000 dernières années (pas de 200 ans) de la teneur en oxygène 18 de la glace de GRIP (courbe du haut) et de l'excès en deutérium. Les courbes de la variation de la température du site (
In order to illustrate how GRIP co-isotopic data can, by themselves, give a clue on the timing between central Greenland and North Atlantic events, we first focus on data concerning specific time periods. We have selected the rapid warming events during the last climatic transition (Fig. 3a) and two sequences of Dansgaard–Oeschger events (Fig. 3b), DO 5 and 6, chosen because they include the time span over which excess data are available on the Dye-3 core [13,21], and DO 19 and 20 (around 70 kyr BP). Here, we use original data, e.g., measurements performed on 55 cm sample, which corresponds to an average time resolution of
Each of the rapid warming events recorded by the oxygen-18 record (end of the YD, transition to BO, rapid warming events associated with DO events) is characterized by a rapid change in deuterium excess. As in Dye 3 [13], the end of the YD event is, at GRIP, marked by a rapid and large deuterium-excess decrease (∼5% change in both ice cores), interpreted by Dansgaard et al. [13] as reflecting a rapid retreat of the sea-ice cover). These authors noted that the change in excess (e.g., in oceanic conditions) was more rapid (20 years) than the temperature change in central Greenland (50 years). The GRIP results do not reflect however this differential behaviour, as it appears that GRIP oxygen-18 and excess changes are both completed in 50 years or so. Instead, such behaviour is observed for the BO transition (for which the results are not available at Dye 3). The excess decrease is quite rapid (20 years or less), whereas it takes about 100 years to see the associated warming completed in central Greenland.
The excess records of GRIP and Dye 3 are remarkably similar over the period covered by DO 5, 6 and 7. At both sites, the excess is in antiphase with the oxygen-18 record with a similar shift between cold and mild periods. Our time resolution is however too low to identify small phase shifts between the two records, as suggested for Dye 3 [21]. At last, we note that the excess change (presumably ocean driven) can be more or less rapid from one event to the next. This is further illustrated by DO 19 and 20 – both oxygen-18 and excess changes are quite rapid for DO 20, whereas, for DO 19, this only applies for oxygen-18, the excess change being slower – and, indeed, such a variability in the oxygen-18 excess behaviour holds true over the entire GRIP record. Still, these various examples illustrate how useful can be ice core isotopic records to shed light on the strength of the link between atmospheric (as seen in central Greenland) and oceanic rapid changes.
We should keep cautious in our interpretation because the coefficient of 8 used to calculate the excess is somewhat arbitrary. Indeed, when calculated along the core (using 50 successive samples), the
Still, one could suspect that part of the excess changes associated with rapid warming events is due to the particularly large local temperature change rather than to remote moisture-source effects. Would we adopt the slope of 7.5 observed during the glacial period instead of 8 that the above mentioned rapid changes would become less conspicuous. On the other hand, plotting d versus
4 Towards a quantitative interpretation of δD and
Although isotopic GCMs are now extensively used to simulate water isotope distribution, there are only a limited number of experiments specifically dealing with the relationship between the excess of a precipitation and the conditions prevailing at its oceanic source. For example, the results shown in Fig. 2, which correspond to present-day conditions, have not been repeated for glacial conditions and more generally for different climates. Although very promising, the GCM approach is not yet helpful to interpret excess changes recorded in ice cores.
Instead, despite obvious limitations, Rayleigh-type models are perfectly adapted to this context, because a large part of the δD and
In these equations, the subscript corr means that the oceanic correction is taken into account and Δ refers to the difference with respect to modern conditions. This dual approach is now extensively used for interpreting measurements performed on Antarctic cores, where it provides quite consistent results. It has also been applied for the last millennium and the Holocene in Greenland, again quite satisfyingly, but the situation clearly deteriorates there if this inversion method is applied for the last glacial period and the following transition, providing quite unrealistic results (estimated
Instead, large topographic and atmospheric circulation changes during glacial (presence of the Laurentide ice sheet, larger extension of sea-ice, which makes central Greenland a true continental site) are at the root of concurrent large seasonality changes, with a shift toward a much larger proportion of summer precipitation under glacial conditions. This seasonality shift convincingly explains why the conventional interpretation of water estimates temperature changes in central Greenland by up to a factor of 2 [8,9,22,35]. In their study, which accounts both for the seasonality of the precipitation fallout and of its δD and
The last glacial maximum (LGM) to Holocene warming is estimated to
5 Conclusion
That
Obviously, we deal with different variables,
Not surprisingly (given the linear relationships used in the inversion), the timing and morphology of
Such a large-scale hydrological cycle reorganisation is indirectly confirmed by the calcium composition of GRIP ice, a parameter reflecting first the strength of GRIP dust sources mainly provided by Chinese loess areas and second the efficiency of dust transport to Greenland [15]. The strong correlation between ln(Ca) and
In conclusion, such an interpretation of the
Acknowledgements
This work is a contribution to the Greenland Ice Core Project (GRIP) organized by the European Science Foundation. We thank the GRIP scientists, logistics support and core processors. We also thank the science foundations in Belgium, Denmark, France, Germany, Iceland, Italy, Switzerland, and in the United Kingdom, as well as the CEC programme.