

Version française abrégée
1 Introduction
La Guyane française, située en Amérique du Sud, en milieu tropical humide, à 500 km au nord-ouest de l'embouchure de l'Amazone et à 1200 km au sud-est de l'estuaire de l'Orénoque, présente une façade océanique longue de 350 km environ. Ce littoral est soumis à des évolutions rapides, qui sont liées aux sédiments rejetés par le fleuve Amazone et transportés par le courant des Guyanes.
Le suivi du littoral en faisant de la cartographie classique, en utilisant l'imagerie spatiale optique ou des photographies aériennes à l'échelle du pays est rendu difficile par l'importante couverture nuageuse. Dans cet article, nous proposons une technique basée sur l'analyse d'images radar multidates, permettant de suivre l'évolution du littoral en milieu tropical humide.
La masse des sédiments transportés le long du littoral est évaluée par [1,2,5,6,8,10] et se dépose en partie le long du trait de côte guyanais sous la forme de bancs de vase larges d'environ 30 km. Ces bancs de vase se déplacent le long du littoral, avec une vitesse comprise entre 900 m an−1 et 1,5 km an−1 [4,9].
La présence de cette charge sédimentaire, d'un courant général SE → NW et d'une houle régulière du nord-est engendre sur le littoral guyanais une succession de phénomènes d'érosion, accompagnés de la destruction de la mangrove côtière, et de phénomènes de sédimentation, accompagnés de la formation de bancs de vase. Il résulte de cette alternance « érosion–sédimentation » des évolutions rapides du paysage littoral, qui concernent aussi bien le trait de côte (phénomènes d'érosion et de sédimentation), que la bathymétrie proche côtière et l'apparition et la disparition d'obstacles à la navigation. Il est important de noter que les chenaux d'accès aux deux ports principaux (Dégrad des Cannes et Kourou), situés dans des estuaires, sont périodiquement envasés lors du « passage » d'un banc de vase. Il est alors difficile aux autorités portuaires de maintenir les profondeurs minimales pour une navigation sécurisée.
L'ampleur de ces phénomènes montre l'utilité de mieux gérer la surveillance de ces phénomènes côtiers. Compte tenu des surfaces à surveiller, nous avons basé notre approche sur l'utilisation des images de télédétection. La présence d'une couverture nuageuse quasi permanente rend souvent l'interprétation des données optiques inadaptée ; c'est pourquoi nous utiliserons dans cet article les données des satellites radar à synthèse d'ouverture (RSO), données pouvant être exploitées indépendamment de la nébulosité.
Le but de cette note est de promouvoir l'utilisation des images RSO pour la quantification de l'évolution littorale. Nous ne discuterons ici, ni l'évolution des végétations de mangrove, ni une comparaison qualitative entre les cartographies existantes.
Après une rapide présentation des techniques et de la méthodologie mise en œuvre dans le cadre de cette étude, nous détaillerons deux sites tests avant de généraliser un bilan préliminaire érosion/sédimentation à l'ensemble du littoral guyanais.
2 Données, méthodes
Quarante scènes RSO acquises par les satellites ERS-1 ERS-2 et Envisat ont été utilisées pour cette étude. Les caractéristiques principales des satellites ERS sont une longueur d'onde de 5,6 cm (Bande C), un angle d'incidence moyen de 23° et une polarisation VV. L'instrument ASAR d'Envisat, comme ERS, permet d'acquérir des images en bande C et propose plusieurs modes d'acquisition (incidence variable de 15 à 45° et différentes polarisations). Les caractéristiques des scènes utilisées sont renseignées dans le Tableau 1.
Test sites 1 and 2 (cf. §§3.1 and 3.2), available spatial images studied and acquisition time associated with their tide level predicted through © SHOM Tide level predictor software. M = mode: D = descending pass, A = ascending pass, HT = high tide, LT = low tide)
Caractéristiques des scènes RSO disponibles sur les sites test 1 et 2 (cf. §§3.1 et 3.2). Les données marégraphiques ont été fournies par le © SHOM, M = mode : D = orbite descendante, A = orbite ascendante, HT = marée haute, LT = marée basse)
| Site | Satellite | Orbit | M | Date | Acquisition time (UT) | Tide level (zero hydrographic reference) (m) |
| Kourou | ERS1 | 12 193 | D | 14/11/1993 | 1.2 (HT 3.4 LT 1.0) descending | |
| ERS2 | 22 924 | 08/09/1999 | 13h52 | 0.9 (HT 3.2 LT 0.8) rising | ||
| Envisat (IS2 (23°)) | 3585 | 06/11/2002 | 0.69 m (HT 3.1 LT 1.2) rising | |||
| Iracoubo | ERS1 | 4449 | D | 22/05/1992 | 2.2 (HT 2.8 LT 1.4) descending | |
| 20 825 | 09/07/1995 | 1.8 (HT 2.8 LT 1.1) rising | ||||
| 24 833* | 14/04/1996 | 1.9 (HT 3.1 LT 1.2) rising | ||||
| ERS2 | 5160* | 15/04/1996 | 13h50 | 1.5 (HT 3.2 LT 1.1) rising | ||
| 23 196 | 27/09/1999 | 1.0 (HT 3.2 LT 0.8) descending | ||||
| 18 523 | 05/11/1998 | 0.9 (HT 3.4 LT 0.8) descending |
Les scènes RSO ont été filtrées par traitement multidate, puis géoréférencées par modélisation physique du capteur RSO.
Le chatoiement est un bruit multiplicatif qui affecte la résolution radiométrique des images RSO. Il est produit par l'addition d'un grand nombre d'échos élémentaires à l'intérieur d'un même pixel. Le filtrage multidate peut être effectué quand un minimum de trois scènes RSO est acquis sur la même zone et dans les mêmes conditions (même angle d'incidence, même polarisation). L'intérêt principal de ce filtre réside dans sa capacité à réduire le chatoiement sur les zones invariables, tout en détectant les changements intervenus localement aux différentes dates d'acquisition [12].
Afin de positionner les images RSO, nous avons développé un utilitaire de géoréférencement. Ce dernier fonctionne grâce à l'orbitographie précise des satellites ERS [11], des paramètres d'acquisition et d'un modèle de géoïde. Des points de contrôle GPS ont permis d'estimer la précision de ce calage à 25 m en écart-type pour des points dont l'altitude est connue. Ce traitement a été généralisé à l'ensemble de la Guyane sans points d'appui au sol [13].
3 Sites test
Nous avons choisi deux sites test, afin de décrire les évolutions littorales guyanaises : (1) déplacement des bancs de vase sur le site du port et du chenal de Kourou et (2) phénomènes côtiers d'érosion et de sédimentation sur le littoral autour du village d'Iracoubo.
3.1 Déplacement de bancs de vase
La Fig. 2 présente deux extraits d'images ERS (Fig. 2a et b) et un d'Envisat (Fig. 2c) autour du chenal d'accès au port de Kourou. Les bancs de vase lisse découvrant à marée basse sont identifiables de manière évidente. Ce sont des zones de très faibles radiométries, dans un environnement de radiométries peu élevées : mer et mangroves littorales. Sur ce type de surfaces lisses, l'onde radar est quasi entièrement réfléchie de manière spéculaire.
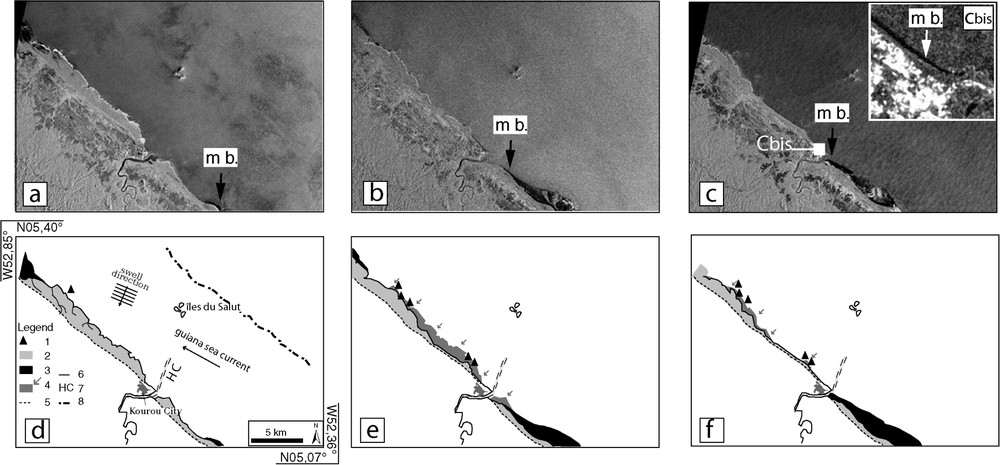
Mud banks displacement around Kourou City. (a, b, c) Three extracts of ERS1, ERS2 and Envisat respectively images at low tide from 1993, 1999 and 2002 on the same site. (d, e, f) Their respective interpretations. 1: Rocks, 2: mangrove vegetation, 3: mud banks, 4: erosion zone, 5: Quaternary offshore bar, 6: shoreline, 7: harbour channel (extracted from SHOM nautical chart), 8: isobath 10 m.
Déplacement d'un banc de vase autour de l'estuaire de Kourou. (a, b, c) Extraits des images ERS1, ERS2 et Envisat de 1993, 1999 et 2002, respectivement, acquises à marée basse, et (d, e, f) leur interprétation. 1 : Rocher, obstacle à la navigation, 2 : mangroves, 3 : banc de vase, 4 : zone en érosion, 5 : cordon sableux du Quaternaire, 6 : trait de côte, 7 : chenal d'accès (carte marine SHOM), 8 : isobathe 10 m.
En novembre 1993 (Fig. 2a et d), deux bancs de vase sont identifiables sur les images, le premier à 6 km à l'est de l'embouchure de la rivière Kourou et le second 15 km à l'ouest. Six années plus tard, en septembre 1999 (Fig. 2b et e), le premier banc de vase est maintenant situé à proximité immédiate du chenal d'entrée au port de Kourou et le second toujours à 15 km. En novembre 2002 (Fig. 2c et f), le premier banc de vase est maintenant de part et d'autre du chenal, tandis que le second s'est déplacé à l'ouest et a quitté l'emprise de la scène.
3.2 Phénomènes côtiers d'érosion et de sédimentation
Le second site est situé autour de l'estuaire de la rivière Iracoubo. Les types de végétation que l'on rencontre sur cette plaine côtière sont, d'une part, au-delà du cordon littoral du Quaternaire et vers le nord, des végétations de mangrove sur des sols constitués de vases et de sables et, d'autre part, au sud de ce même cordon, des savanes sèches et humides, ainsi que des forêts galeries.
La Fig. 3 montre les variations temporelles des traits de côte de 1937 à 1999. En 1937, le trait de côte était situé à moins d'1 km de la ville d'Iracoubo, tandis qu'à la fin des années 1950, des témoignages oraux nous ont appris que la route principale établie en partie sur l'ancien cordon littoral quaternaire longeait la plage au niveau du village de Trou-Caïman ; ainsi, nous pouvons raisonnablement penser qu'entre 1937 et le début des années 1960, un phénomène d'érosion côtière a eu lieu à cet endroit. Plus tard, en 1976, sur l'image d'archive Landsat (Fig. 3A), nous observons, par rapport au trait de côte de 1937, une avancée globale vers la mer des végétations de mangrove. Sur l'image RSO de 1992, cette avancée continue autour des embouchures des rivières Iracoubo et Counamana, tandis qu'à l'est du site, nous observons un recul des végétations côtières. Enfin, la scène de 1999 confirme ces deux observations ; nous remarquerons que, sur cette dernière image, des radiométries élevées sont observées sur le site en érosion (région 2, Fig. 3D). Il s'agit des végétations dégradées encore sur pied ou tombées sur la vase, qui constituent alors de forts réflecteurs de l'onde radar.
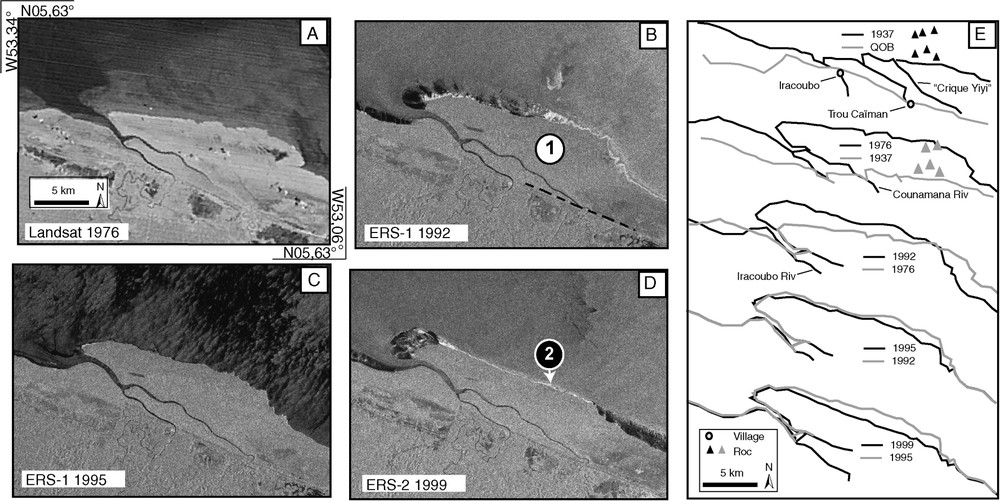
Coastline evolution and mangrove swamp dynamics in the Iracoubo site (central west French Guiana). (A) 1976 Landsat image that emphasizes the turbidity plume offshore; (B–D) ERS 1992, 1995 and 1999 images. The latter show a unique erosional straight shoreline feature, region 2, dead trunks appear with higher radiometry; (E) image interpretation, coastline comparison (QOB: Quaternary Offshore Bar).
Évolution du trait de côte et des mangroves littorales dans la région d'Iracoubo (centre ouest de la Guyane Française). (A) Image Landsat de 1976 ; (B–D) extraits des scènes ERS de 1992, 1995 et 1999. L'image de 1999 montre un exemple intéressant de zone en érosion région 2, les troncs couchés sur la vase apparaissant sur l'image RSO avec des radiométries élevées ; (E) interprétation et comparaison des traits de côte (QOB : cordon sableux du Quaternaire).
4 Suivi des évolutions à l'échelle de la Guyane française
Plusieurs études ont tenté de quantifier ces phénomènes d'érosion et de sédimentation côtière sur la Guyane. Effectuées à partir de données de terrain, elles ont souvent été complétées par (1) des couvertures aériennes partielles ou hétérogènes temporellement, (2) des données satellitaires optiques, dont la lecture est souvent affectée par la couverture nuageuse [3], ou (3) des cartes topographiques anciennes, pour lesquelles la comparaison avec d'autres données plus récentes est souvent rendue difficile par la méconnaissance des systèmes géodésiques. Ces différents travaux donnent alors une approche qualitative du problème d'évolution côtière de la Guyane. Seule la comparaison entre les cartes géologiques, la carte marine de l'ensemble de la Guyane de 1937, une unique mosaïque des scènes Landsat (1976) et deux mosaïques des images ERS (1992 et 1998) nous permet d'établir la balance surfacique des phénomènes d'érosion et de sédimentation côtières. Le Tableau 2 présente, pour chaque zone du littoral guyanais de la Fig. 4 et pour chaque période identifiée, les surfaces côtières perdues (−) ou gagnées (+) sur la mer. De plus, nous donnons une vitesse moyenne d'évolution exprimée en km2 an−1. Cette vitesse n'est qu'un indicateur et ne prend pas en compte les éventuelles « catastrophes » naturelles, tempêtes océaniques par exemple, qui peuvent entraîner une destruction rapide des végétations de mangroves [9]. Nous avons choisi, comme trait de côte de référence, le cordon littoral du Quaternaire, qui a été extrait de la carte géologique ; il est évident que cet « ancien » trait de côte est difficile dater, mais sa représentation linéaire sur les cartes montre qu'il s'agit d'un point de départ intéressant à prendre en compte. Le Tableau 2 montre clairement la grande dynamique du processus sédimentaire côtier. La balance globale du processus sur ces soixante dernières années est positive (environ 160 km2). Cette tendance semble se confirmer par la lecture simple des cartes géologiques, qui montrent qu'au-delà du cordon littoral quaternaire vers le sud, les dépôts sédimentaires quaternaires s'étendent sur une largeur de 10 km. Sur la zone littorale proche du village Iracoubo (zone traitée au §3.2), une forte accrétion s'est déroulée entre 1937 et 1976 (plus de 130 km2 en 39 ans, zone 4), ce qui donne une vitesse de sédimentation de 2,3 km2 an−1 pour la période considérée. Parallèlement, si l'on se réfère à une période plus longue à partir des cartes géologiques, la vitesse moyenne tombe à environ 0,006 km2 an−1. Ces deux valeurs, prises sur le court, puis le long terme, montre qu'il existe au moins deux échelles temporelles pour l'observation des phénomènes d'érosion et de sédimentation côtière en Guyane.
Sedimentation (+)/erosion (−) areas evolution, Surface changes between 1937, 1976, 1992, and 1998; for the corresponding area numbers, see Fig. 4
Sédimentation (+)/érosion (−), évolutions surfaciques entre les dates 1937, 1976, 1992 et 1998 ; la localisation de chaque région est reportée sur la Fig. 4
| Period | Area | ||||||||||||||||||
| 1 | 2 | 3 | 4 | 5 | 6 | ||||||||||||||
| + | − | + | − | + | − | + | − | + | − | + | − | ||||||||
| From Precambrian terrain to Quaternary bar | km2 | n.d. | 212 | ||||||||||||||||
| km2 yr−1 | |||||||||||||||||||
| From the Quaternary onshore bar to 1937 | km2 | 42 | 119 | 47.4 | 48.5 | 120 | 12.3 | ||||||||||||
| km2 yr−1 | ? | ? | ? | ? | ? | ? | |||||||||||||
| Subtotal | km2 | n.d. | 224.3 | ||||||||||||||||
| km2 yr−1 | |||||||||||||||||||
| 1937–1976 | km2 | 6.4 | −8.5 | 0 | −37.2 | 0 | −9.7 | 130.7 | 0 | 32.2 | −36.2 | 0 | −7.5 | ||||||
| km2 yr−1 | 0.16 | −0.22 | 0 | −0.95 | 0 | −0.25 | 3.35 | 0 | 0.83 | −0.93 | 0 | −0.19 | |||||||
| km2 | −2.1 | −37.2 | −9.7 | 130.7 | −4 | −7.5 | |||||||||||||
| km2 yr−1 | −0.05 | −0.95 | −0.25 | 3.35 | −0.1 | −0.19 | |||||||||||||
| 1976–1992 | km2 | 0.3 | −12 | 4.9 | −1.3 | 10.5 | 0 | 37.4 | −7 | 7.5 | −36 | 42.5 | 0 | ||||||
| km2 yr−1 | 0.01 | −0.31 | 0.13 | −0.03 | 0.27 | 0 | 0.96 | −0.18 | 0.19 | −0.92 | 1.09 | 0 | |||||||
| km2 | −11.7 | 3.6 | 10.5 | 30.4 | −28.5 | 42.5 | |||||||||||||
| km2 yr−1 | −0.3 | 0.09 | 0.27 | 0.78 | −0.73 | 1.09 | |||||||||||||
| 1992–1998 | km2 | 1.4 | 0 | 2.8 | 0 | 2.7 | −7 | 5.1 | −23 | 26.3 | −1.6 | 2 | −24.8 | ||||||
| km2 yr−1 | 0.04 | 0 | 0.07 | 0 | 0.07 | −0.18 | 0.13 | −0.59 | 0.67 | −0.04 | 0.05 | −0.64 | |||||||
| km2 | 1.4 | 2.8 | −4.3 | −17.9 | 24.7 | −22.8 | |||||||||||||
| km2 yr−1 | 0.04 | 0.07 | −0.11 | −0.46 | 0.63 | −0.58 | |||||||||||||
| Balance per area (1937–1998) | km 2 | 8.1 | −20.5 | 7.7 | −38.5 | 13.2 | −16.7 | 173.2 | −30 | 66 | −73.8 | 44.5 | −32.3 | ||||||
| km2 yr−1 | 0.1 | −0.3 | 0.1 | −0.6 | 0.2 | −0.3 | 2.8 | −0.5 | 1.1 | −1.2 | 0.7 | −0.5 | |||||||
| km 2 | −12.4 | −30.8 | −3.5 | 143.2 | −7.8 | 12.2 | |||||||||||||
| km2 yr−1 | −0.2 | −0.5 | −0.1 | 2.3 | −0.1 | 0.2 | |||||||||||||
| Period | Area | Global Balance for areas 1 to 11 | |||||||||||||||||
| 7 | 8 | 9 | 10 | 11 | |||||||||||||||
| + | − | + | − | + | − | + | − | + | − | + | − | ||||||||
| From Precambrian terrain to Quaternary bar | km2 | 308 | 244 | 667 | 257 | 570 | 2258 | ||||||||||||
| km2 yr−1 | km2 yr−1 | ||||||||||||||||||
| From the Quaternary onshore bar to 1937 | km2 | 48.3 | 18.9 | 25 | 15.3 | 35.4 | |||||||||||||
| km2 yr−1 | ? | ? | ? | ? | ? | ? | |||||||||||||
| Subtotal | km2 | 356.3 | 262.9 | 692 | 272.3 | 605.4 | 2790.1 | ||||||||||||
| km2 yr−1 | |||||||||||||||||||
| 1937–1976 | km2 | 30 | 0 | 15.5 | 0 | 8 | 0 | 35 | 0 | 16.5 | −5.8 | 274.3 | −104.9 | ||||||
| km2 yr−1 | 0.77 | 0 | 0.4 | 0 | 0.21 | 0 | 0.9 | 0 | 0.42 | −0.15 | 7 | −2.7 | |||||||
| km2 | 30 | 15.5 | 8 | 35 | 10.7 | 169.4 | |||||||||||||
| km2 yr−1 | 0.77 | 0.4 | 0.21 | 0.9 | 0.27 | 4.3 | |||||||||||||
| 1976–1992 | km2 | 2.6 | −48.2 | 2.7 | −24.4 | 6.4 | −1 | 6.7 | −2.6 | 21.1 | −6 | 142.6 | −138.5 | ||||||
| km2 yr−1 | 0.07 | −1.24 | 0.07 | −0.62 | 0.16 | −0.03 | 0.17 | −0.1 | 0.54 | −0.15 | 3.7 | −3.6 | |||||||
| km2 | −45.6 | −21.7 | 5.4 | 4.1 | 15.1 | 4.1 | |||||||||||||
| km2 yr−1 | −1.17 | −0.56 | 0.14 | 0.11 | 0.39 | 0.1 | |||||||||||||
| 1992–1998 | km2 | 0 | −6.8 | 2 | −3.4 | 8 | 0 | 6.3 | −1.6 | 3.7 | −4.2 | 60.3 | −72.4 | ||||||
| km2 yr−1 | 0 | −0.17 | 0.05 | −0.09 | 0.21 | 0 | 0.16 | −0.04 | 0.09 | −0.11 | 1.5 | −1.9 | |||||||
| km2 | −6.8 | −1.4 | 8 | 4.7 | −0.5 | −12.1 | |||||||||||||
| km2 yr−1 | −0.17 | −0.04 | 0.21 | 0.12 | −0.01 | −0.3 | |||||||||||||
| Balance per area (1937–1998) | km 2 | 32.6 | −55 | 20.2 | −27.8 | 22.4 | −1 | 48 | −4.2 | 41.3 | −16 | 477.2 | −315.8 | ||||||
| km2 yr−1 | 0.5 | −0.9 | 0.3 | −0.5 | 0.4 | 0 | 0.8 | −0.1 | 0.7 | −0.3 | 7.8 | −5.2 | |||||||
| km 2 | −22.4 | −7.6 | 21.4 | 43.8 | 25.3 | 161.4 | |||||||||||||
| km2 yr−1 | −0.4 | −0.1 | 0.4 | 0.7 | 0.4 | 2.6 |
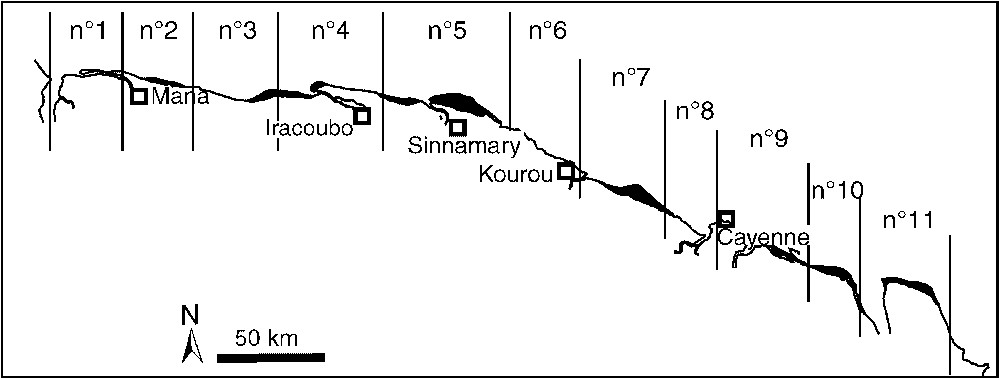
Whole French Guiana coast, location of the areas mentioned in Table 2.
Sectorisation de la côte guyanaise pour le calcul surfacique des évolutions.
5 Conclusions et perspectives
L'utilisation des données des satellites radar à synthèse d'ouverture (RSO) nous a permis, en Guyane française en milieu tropical humide, de cartographier et de suivre les déplacements des bancs de vase côtiers, ainsi que de quantifier les surfaces gagnées ou perdues récemment sur la mer.
Les résultats thématiques ont été obtenus par traitement radiométrique, puis géométrique des images par filtrage multitemporel, puis par rectification géométrique.
Deux cartes marines ont pu ainsi être actualisées en partie grâce aux traits de côte et limite de basse mer déduits par photo-interprétation des images radar, fournis aux cartographes du SHOM [abords de Cayenne (1:50 000, n○ 7379) et abords de Kourou (échelle : 1:50 000, n○ 7380)].
La comparaison entre données RSO et les cartes existantes et une couverture globale Landsat nous a permis d'estimer que la côte guyanaise est soumise à un phénomène d'accrétion de 160 km2 sur 61 années. Cette vitesse contraste avec celle, très faible, déduite sur le long terme grâce aux cartes géologiques.
La capacité des images à permettre le suivi des évolutions temporelles et les délais élevés de réactualisation des cartes marines « classiques » nous amènnt à proposer la génération de documents de type « spatiocarte » pouvant répondre en tout ou partie aux besoins des utilisateurs. Ces documents, dont la génération serait plus rapide et moins coûteuse que les cartes classiques, comporteraient à leurs dates de création l'incrustation des informations issues des cartes marines plus anciennes (sondes, isobathes, délimitation de la zone intertidale, trait de côte, formations végétales à terre) sur un fond d'image radar récent. Une telle association d'informations quantitatives (sur la position et la profondeur des hauts fonds par exemple) et qualitatives (sur la nature des paysages, la position ancienne du trait de côte...) apportées par les cartes, avec celles qui découleraient de l'interprétation des images, permettrait aux navigateurs de prendre connaissance des changements intervenus entre les dates de création des cartes marines utilisées et d'acquisition des images.
1 Introduction
French Guiana is located in northeastern South America, 500 km northwest of the Amazon Delta and 1200 km southeast of the Estuary of the Orinoco River. Morphological changes along French Guiana's coastline are striking and rapid. Directly linked with the huge Amazon discharge, these changes are also under the strong influence of the Guiana sea current. The suspended matter moves northwestward and is estimated by [1,2,5,6,8,10] at about , and creates along the 350 km of the Guiana coasts large mud-banks (30 km along the shoreline). This alongshore mud-bank displacement (around 900 m yr−1 to 1.5 km yr−1 [4,9]) takes place annually, usually between December and February, when the sea is rough, the trade-wind speed is higher, and the North Brazil Current flows closer along the coast [7]. This northwestward displacement is also disturbed by the numerous estuaries of rivers along the coast. One of the major consequences is the rapid change of the coastline (accretion and erosion) and the coastal bathymetry. Two types of zones may be distinguished: (1) erosional coasts and (2) sedimentary coasts. Erosional coasts mainly face or are exposed to ocean waves. Therefore, mangrove vegetation, which is growing on muddy/sandy soils, is usually destroyed by the high energy of these waves. In contrast, sedimentary coasts are characterised by large mud intertidal zones where the mangrove swamp vegetation expanded quite quickly. This vegetation represents a coastal band large as 1 to 10 km wide and soils 0 to high. Furthermore, mud banks migration fills in harbour channel. As a consequence, it is a major problem for harbour authorities to maintain sea-level navigation by managing local dredgers efforts. This is one of the reasons why it is of prime importance to better monitor coastal evolution in such tropical areas.
Our approach is based on the use of remote sensing data. Surface to monitor (more than 350 km), strong evolutions and difficulties of accessibility (tropical forest and swampy areas) give to the French Guiana shoreline an interesting test site for such approach. Only Synthetic Aperture Radar images can provide quality spatial images on tropical humid areas independently of nebulosity contrasting with optical images. Other data like maps, nautical charts, remote sensing and in-situ data were combined into a GIS system in order (1) to establish reference RADAR image maps at different scales; from regional to local one, and (2) to compare all the acquired documents for monitoring purposes. One key point of this study is to acquire regular images in any seasons (rainy and dry) and at low tide in order to compare the different images.
The aim of this paper is not to deal with the mangrove evolution, or to look at various qualitative onshore cartography of the shoreline, but to promote radar satellite images in order to propose a quantification of the shoreline evolution and a new precise cartographic tool for applied geology.
After a short presentation of the technique and of the methodology used for this study, two of major erosional and sedimentary cases existing in French Guiana will be illustrated. To conclude, we will try to establish a global mass balance through 50 years for the longitudinal mass drift along the French Guiana shoreline and show the discrepancies of short- and long-term sedimentation/erosion rates along the shoreline. And last, we will introduce the improvements in coastal zone management for official cartography and littoral sites by site management.
2 Data, technique and methodology used
2.1 Data
2.1.1 Remote sensing data
Forty Synthetic Aperture Radar images constitute our database of recent European Remote Sensing Satellite (ERS1 ERS2 and Envisat) images of the whole French Guiana shoreline. The major characteristics of ERS sensor are: (1) a ground pixel size of 12.5 m, (2) a mean incident angle of 23°, (3) a radar wavelength of 5.6 cm and VV polarisation; Envisat SAR sensor is a multi-incidence and multi-polarisation one, the only one image of this sensor used for this study presents the same characteristics as ERS. Table 1 presents remote sensing data used for test sites 1 and 2 (i.e. §§3.1 and 3.2).
2.1.2 Maps
We used first several nautical charts from the French Hydrographic Survey (SHOM). Most of them were constructed several years after 1937, when an extensive hydrographic mission took place in French Guiana. Scales vary between 1:15 000 (harbour approach) to 1:500 000 (regional maps). For a better comprehension of the evolution process, we also used geological maps.
2.1.3 In-situ data
Several field trips onshore and offshore were made in French Guiana in particularly in the autumn of 1998 with the French Oceanographic Vessel D'Entrecasteaux. First, some geodetic measurements were acquired (GPS ground points and GPS trajectographic flights) in order to validate our image georeferencing step. Some oblique aerial photos on intertidal zones, coastal vegetations, harbour channels and various rocks were also acquired.
2.2 Technique and methodology used
2.2.1 Speckle reduction
First of all, we highlighted the radiometric information of each amplitude image by reducing the speckle effect. The speckle is a multiplicative noise caused by micro-relief reflections. It reduces seriously the image legibility. The filter used is a multitemporal one and is based on radiometric comparison between images on the same site and the same acquisition parameters (radar wavelength, incidence angle and polarisation). As the speckle does not appear in the same conditions on the different images, on the same site, an internal coefficient leads us to keep the original information contained in the reference scene, this reference scene being chosen by the user [12].
2.2.2 Geometric processing
The aim of this geometric process is to locate as precisely as possible the coastline (zero high) without any ground data (coastal accessibility, evolutions). This process is simply based on ERS precise orbitographic data [11] and on the distance between satellite and ground target. Height difference between the ellipsoid, linked to the geodetic system used, and the geoid (Geoid models, EGM96 by example) is also necessary. The careful checking of results of this tool was made with different references: topographic maps (if available and geodetic system well known), GPS points, GPS trajectography and by ascending and descending orbit superposition (even if the same features are quite difficult to find on these two images). This method tested (60 ERS images used) on various sites – French Guiana, Mauritania, Cameroon and Terre Adelie (Antarctic) – gave us geocoded products with a planimetric precision, between images and reference, of 25 m [13].
Geodetic systems used on the old nautical chart are issued from astrogeodetic measurements, so transformation parameters from geographic coordinates to coordinates of a world geodetic system (WGS84 by example) are not well known. A simple method using common points between maps and georeferenced ERS images then polynomial rectification was chosen; the same method was used for the 1976 Landsat image.
2.2.3 Interpretation methodology
Tide in French Guiana is semi diurnal and ranges between 1.5 and 2.8 m and tide effects are up to 20 km upstream the estuary of coastal rivers. In order to get rid of the tide effects, we decided to only consider the limit between the vegetation and the shore deposits that we call ‘shoreline’. It corresponds to the external boundary of the mangrove (boundary mangrove/sea water (for C Band: high tide) or mangrove/mud bank (low tide)). Of course, this boundary does not correspond exactly to the shoreline from the International Hydrographic Organisation's definition; indeed the mangrove roots are periodically covered and submerged by seawaters, but this boundary is also an excellent radar indicator of the shoreline evolution.
3 Test sites
Two sites will be described below to illustrate in detail different aspects of the coastal evolutions in French Guiana through detailed observations of different radar images and existing maps. On the first site, we will focus on mud banks displacements around Kourou City, which is one of the major cities within the area, where the western alongshore drift (mud transportation) perturbs the sea navigation, specifically on the access of the channel of the space launch centre: the Kourou harbour, situated in the estuary of the Kourou River. The second site is located around the Iracoubo Estuary, where SAR images highlight the strong sedimentation and the erosional processes that cause real problems for coastal management.
3.1 Mud banks displacement
In order to understand the major reasons of the rapid shoreline evolution in French Guiana, we will first focus on the Kourou City area.
3.1.1 Site description
The Kourou city is established on a rocky overhang surrounded by the Kourou River. Its river bed stretches away northward to the sea. In relation with the Kourou launch space centre, a harbour was built along Kourou Estuary and a swash channel was excavated from the wharf to deep sounds in a NNE direction (see location in Fig. 1B).
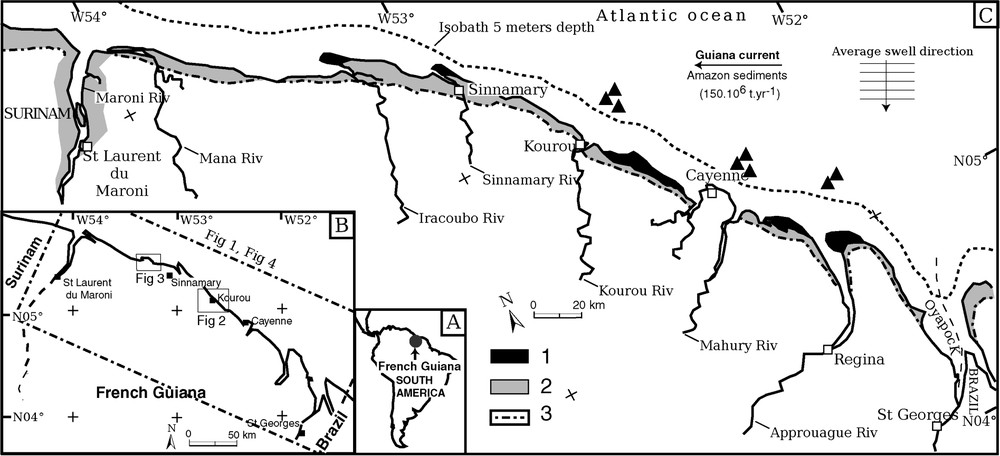
Overview of the French Guiana coast. Insert A: Location of French Guiana in South America. Insert B: Location of the different studied test sites and figures. C: Global overview of the present sedimentary context of the French Guiana shoreline. 1: Mud banks; 2: mangrove swamp; 3: Quaternary offshore bar.
Vue générale de la Guyane française. Encart A : localisation du département en Amérique du Sud. Encart B : situation des différents sites tests et figures. C : Vue générale du contexte sédimentaire actuel. 1 : Bancs de vase ; 2 : mangroves ; 3 : Cordon sableux du Quaternaire.
3.1.2 Figure description
Two extracts of ERS and one extract of ENVISAT images (Fig. 2a–c) were acquired and then chosen at the lower tide as possible (see Table 1). Mud banks at low tide are easily recognisable with a low radiometry (black pixels); in fact, radar signals are almost entirely reflected by smooth surface of mud banks, so they can be easily distinguished from the vegetation and the ocean characterised by a rough surface (grey tones radiometry) caused by swells on ERS images.
In November 1993 (Fig. 2a and d), we observed two mud banks on the ERS images: the first one is situated 6 km east of the Kourou estuary and the second one 15 km west. In September 1999 (six years later, Fig. 2b and e), the first mud bank is situated near on the right bank of the Kourou channel and the second one is 15 km farther west of the Larivot estuary. In November 2002 (Fig. 2c and f), the first mud bank went through the Kourou River and is now situated on both sides of it, and the second one moved farther west and consequently is not seen. One may note that the erosion caused by swells to the east of the Kourou Channel (dark grey region in Fig. 2e and f) makes appear (hidden by mangrove vegetation in Fig. 2d) rocks or temporary small vegetation islands (dead mangrove vegetation), which disturb coastal navigation.
Mud-bank displacements must be seen at regional and temporal scale: in 1999, the two main harbours, Degrad des Cannes (Cayenne City) and Kourou, were faced with mud-bank problems and had to swash the channel depth to maintain it for navigation. Only one dredger moved to anchor in Cayenne City, so Kourou harbour authorities decided to have a second dredger come from Guyana. In fact, in 1999 and 2000, front of Mahury River estuary (Cayenne), mud banks were at the end of their displacement, whereas in Kourou, they begun to fill in the Kourou harbour swash channel.
ERS images interpretation had been integrated in the updated nautical chart of Cayenne City (SHOM International Nautical Chart No. 7379, scale 1:50 000) and Kourou City (No. 7380, scale 1:50 000). These cartographic documents should be helpful for harbour authorities to manage dredger efforts. Furthermore, the financial dredger efforts may be foreseen from this approach as next mud banks might be monitored carefully.
3.2 Coastline evolution around Iracoubo
The second test site is located near Iracoubo Estuary (see location in Fig. 1B) and presents one of major contrasts within the shoreline due to erosion and sedimentation of mud banks.
3.2.1 Site description
The Iracoubo region represents a typical coastal plain morphology in French Guiana. From the coastline to the Quaternary offshore bar mangrove swamp vegetation grows on mud and sand soils whose height does not exceed three meters. South of this zone, savannah and tropical forests grow on soils with greater height (five to ten meters high). Three rivers run northwestward: Iracoubo, Counamana and Yiyi.
3.2.2 Figure description
Fig. 3 show documents with various coastlines. In 1937 (nautical chart, coastline in Fig. 3E), the City of Iracoubo was situated close to the sea. Note that Iracoubo and Counamana Rivers flow into the Atlantic Ocean separately.
At the end of the fifties, numerous people living there said that the main road kept close to the beach of Trou-Caïman. As the road was built partially on the old Quaternary offshore bar, this implies that extensive erosion took place between 1937 and 1960. Later, in 1976, on the Landsat image, we observed a general sedimentation process front of the three rivers. The estuary of Iracoubo and Counamana Rivers are merged, showing a westward accretion of the mud banks fixed by the mangrove swamp. Note the sea currents revealed by the high-turbidity plumes offshore. Then, in the 1992 SAR image, the sedimentation is still prograding (see Iracoubo River estuary), whereas the eastern part is under erosional process. One may note that the 1937 isolated offshore rocks are included in 1992 within the mangrove swamp. At least, in 1999, the Iracoubo River estuary is still prograding. At the easternmost part of the studied area, where the shoreline is perpendicular to the Guiana sea current, an erosional process was developed. On the 1999 SAR image, we observed a thin area with high radar backscatter (Fig. 3E, region 2) close to the shoreline; this region corresponds to the dead-tree white pixels, led on mud banks by ocean waves.
Interpretations of coastline on spatial images and nautical charts show coastline evolution by erosion and sedimentation between 1937 and 1999. We tried to quantify the spatial evolution where, from 1976 to 1999, the western part is accreting (average 1 km2 yr−1) and the eastern one is eroding more quickly that the accretion (between 1.2 to 1.75 km2 yr−1). A rapid erosion balance between 1937 and 1999 shows a global positive accretion of more than 37 km2, which is coherent with the geological Quaternary data. Indeed, Pleistocene and Holocene sandy and muddy deposits are in accretion (1 to 10 km large) all along the shoreline.
4 Monitoring of whole French Guiana shoreline
Numerous authors already tried to establish global qualitative erosion balances of the Guiana shoreline [3,5] using (1) partial aerial photograph covers that do not give a compulsory instant stage of the whole French Guiana shoreline, or (2) multitemporal incomplete optical SPOT or Landsat cover [3], or (3) old mapping works without precise projections, coordinates, unknown and low resolution and precision and finally without a uniform validity; or (4) onshore mapping, despite only the French SHOM is responsible and in charge for the precise shoreline mapping... All these existing approaches only gave qualitative information and cannot argue clearly for a positive or a negative mass balance of the French Guiana shoreline [5].
Only a global overview given for instance by the mosaicking of radar images that cover a large area ( per scene) whatever the weather forecast or the day/night ratio may give a quantitative short term period erosion balance. Furthermore, only a detailed georeferenced approach through a GIS, with regularly acquired images and data, may solve that approach.
With the available georeferenced data we got (geological maps, nautical charts established in 1937, complete radar and optic mosaic of the Guiana shoreline at different period in 1976, 1992, 1998), it is possible to establish a raw surfacic balance corresponding to erosion and sedimentation along the Guiana shoreline since 60 years. We may compare the locations of the shoreline at three dates, and highlight in black (Fig. 4) the location of mud banks. Table 2 describes the different sub-homogenous zones (presenting the same behaviour) identified along the shoreline (see location of the zones in Fig. 4). Each one was then quantified in terms of erosion (−) or/and sedimentation (+) with the amount of modified surface; an average rate of evolution of the surface per year is given. This ratio is only an indicator, as the erosional processes are discontinuous through time and are mainly linked to punctual catastrophic storms and waves created by trade winds [9].
The resulting table shows how active are the coastal processes from Amazonia estuary to Orinoco delta, illustrated along the 350 km of French Guiana by a superimposition of the shorelines at the different studied periods with an isolated representation. The Quaternary offshore bar has been taken into account as a reference, even if of course, it is uneasy to date. The southwestern boundary of the Quaternary deposits (extracted from the geological maps) is taken into account in order to quantify the long-time evolution of the shoreline, even if it is submitted to erosion and may be not representative of the long-time accretion rate of the shoreline.
The final erosional balance for the last 60 years is positive (about 160 km2), which means a global accretion of the shoreline. This was already seen by geological observations, as the Quaternary deposits (geological maps) represent a trip of more than 10-km large all along the Guiana shoreline. It is difficult to evidence the average rate deduced from the Quaternary deposits as it depends on the climate, the erosion, the tide, the sea currents... The time factor is well illustrated in Table 2, as each zone of the shoreline presents both erosional and accretional periods through time.
Looking into detail, one may note in Table 2 that a strong accretion occurred between 1937 and 1976 in the Iracoubo area (more than 130 km2 in 39 years, zone 4), which gave an average ratio of 2.3 km2 yr−1, the highest value. In contrast, the accretion rate issued from the geological maps gave a very small value of accretion (<0.006). These two different values taken at a short- and long-term evolution of this shoreline evidence both scale and time discrepancies of the sedimentation/erosion balance of the northern South American shoreline.
In other words, the short-term important accretion rate (60 years) due to the very active westward migration of mud banks all along the French Guiana shoreline due to the high sediment supply of the Amazon River gave a very small long-term accretion rate.
5 Conclusion and perspective
Precise mapping and monitoring of coastal zones in Guiana are now possible with spatial radar images in such humid tropical areas as soon as the specific radar geometry is taken into careful account. Therefore numerous nautical charts had been updated, taking into consideration recent georeferenced radar images within a GIS. The multitemporal analysis of these images combined with existing maps permit us to get a better insight into the sediment migration alongshore and constitutes a first step towards the forecasting of the future evolution of the harbour channel submitted to rapid fill-in. A raw quantification of the accretion of the Guiana shoreline is locally estimated to 160 km2/61 years, contrasting with the so small long-term accretion rate deduced from the geological deposits. Therefore, the French Guiana shoreline, which is presently a rapid accretionary littoral, shows a small geological long-term accretionary rate.
We also have to develop our reflections to imagine new cartographic documents including navigation information and coastal monitoring because updates are not so frequent. Combination of a georeferenced radar image with bathymetry data issued from nautical charts can be helpful for studying these phenomena. In fact, this is a superposition of a quite old quantitative information (bathymetry) and recent interpretation (ERS images). With the ERS images, it is possible to interpret and to follow coastal evolutions; so we apply our methodology for updating operational nautical charts, in accordance with the attributes of the French Hydrographic Office (SHOM). The Cartographic Section of SHOM includes radar image map into the updating processes. More specifically, this radar mosaic gave the exact position of the mud banks and may give information for their short-term and future evolution.
The new generation of sensors – e.g., Envisat (ESA) and Alos (NASDA) – is about to be launched and to be operational. These data, available in 2003, will provide much more coastal applications because of sensors characteristics: multi-angle incidence (13° to 60°) favourable for flat intertidal zone and shoreline approach. The multi-polarisation (HH, VV, HV) will be interesting for a better characterisation of the coastal vegetation (mangrove growth step) and the multi swath from 30 km (12.5-m resolution) to 500 km (100 000-m resolution) will lead to a better operational cover acquisition and multi-scale mapping, taking into account natural phenomena.
Acknowledgements
The authors would like to thanks ESA (project ID539: ‘Mise à jour cartographique et élaboration de produits cartographiques nouveaux’) and the French Hydrographic Survey (SHOM). This is contribution of ‘Laboratoire G2I’ No. A-05-18.