

1 Introduction
In the current context of growing debates on extreme events, global changes and conservation policies, studies of the dynamics of metacommunities and metaecosystems (i.e., regionally organized systems of functional and integrated local communities and ecosystems, respectively) have recently offered significant advances [42,45]. Such advances indicate that these regional scale structures are ecologically meaningful and functional organizations [61]. During the last decade, the scientific interest in metacommunity has resulted in a significant improvement in the understanding of their functional dynamics. Nevertheless, the understanding of their evolutionary dynamics has not progressed at the same rhythm. Indeed, time scales at which metacommunities and metaecosystems evolve, ranging from thousands to millions of years [2,61,74], require a deep-time historical approach based on palaeobiological data, searching for the drivers of the observed long-term changes [11,13,48].
The present paper deals with the evolution of the mammalian metacommunity of the Quercy and Limagne area (Massif Central, France) from the late Middle Eocene (∼38 Myr) to the Early Miocene (∼22 Myr). The quality and density of information unearthed over the last 40 years by vertebrate palaeontologists in this region offers the scientific opportunity to characterize the long-term evolution of a regional mammalian metacommunity in a fluctuating metaecosystem. The aim of our study is to contrast the changes experienced by the mammalian guild at the community and metacommunity levels over a ∼16-Myr time interval spanning a major climatic, biogeographical and evolutionary global event: the Grande Coupure de Stehlin (GCS), at the Eocene/Oligocene boundary [56,69]. In western Europe, the GCS is characterized in mammal faunas as a marked extinction event (about 60% of the phyletic lineages existing at that time disappear [40]), associated with a major migrational phase from North America and Asia [33,34]. The local-level dynamic is investigated by means of cenogram analysis [29,33], while taxonomical evolutionary rate and poly-cohort matrix analyses [16] allow the study of the regional-level dynamics. Our results show that features of the mammalian guild deep-time dynamics at the community and metacommunity levels cannot be simply deduced from each other. This indicates that these two, local and regional, ecological integration levels have their own, at least partially independent, set of controlling parameters; those driving the metacommunity still remain largely to be further studied.
N.B.: for convenience, we will use hereafter the terms ‘origination’ and ‘extinction’ instead of ‘origination/immigration’ and ‘extinction/emigration’, respectively.
2 Data and methods
The analyzed data set is derived from a wider, taxonomically homogenized incidence (i.e., presence/absence) data set for the Cenozoic mammals of western Europe, which has been developed by the second author for more than 20 years [16,17,29–38,40,41]. For the studied area and time interval, 331 mammalian (marsupialian and placentalian, excluding bats) phyletic lineages have been recorded within ∼170 local faunas (Fig. 1; detailed lists available on request). All the Eocene and Early Oligocene fossil localities are located in the Quercy phosphorites palaeokarstic area, whereas the Late Oligocene and Early Miocene localities are located in the Quercy and Limagne areas [25,41,60].
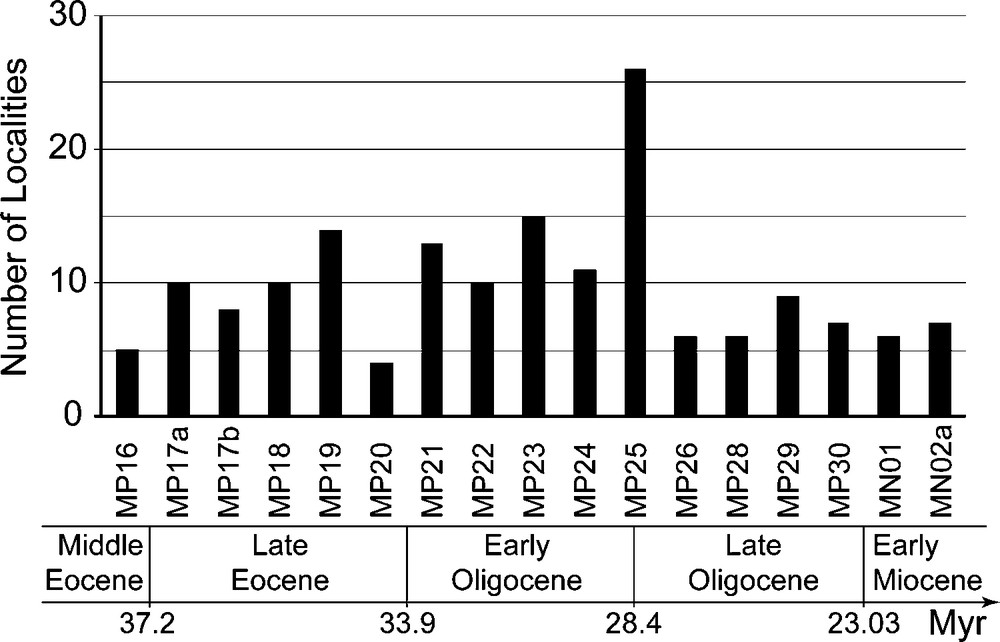
Biochronological distribution of the ∼170 studied fossil-bearing localities, ranging from the late Middle Eocene (MP16 reference level, ∼38 Myr) to the Early Miocene (MN02a zone, ∼22 Myr).
Fig. 1. Distribution biochronologique des ∼170 localités fossilifères étudiées, depuis la fin de l’Eocène moyen (niveau-repère MP16, ∼38 Ma) jusqu’au Miocène inférieur (zone MN02a, ∼22 Ma).
By ‘phyletic lineage’, we mean one or more morphological species forming a time series of interbreeding individual organisms, locally interacting for space, food, sexual partnership, and so on, and regionally evolving as the result of the dual mechanisms of genetic variations vs. development and natural selective demands [16,70]. Hence, the analyzed data set is a collection of 331 distinct evolutionary hypotheses, each one partially or totally interacting upon each other, providing mutual tests of time consistency of the underlying biochronological framework [35,65,72].
By ‘local fauna’, we mean a fossil assemblage of morphological species found in a single, spatially constrained, sedimentologically and palaeontologically homogeneous unitary deposit (even if embedded in a polyphased karst infilling) usually representing no more than a few hundreds of years [3,41,65,72]. In most well-sampled cases, such a set of fossil species randomly covers the full mammalian taxonomical and ecological spectra known at that time in western Europe [41,60]. In addition, taphonomical evidences (e.g., the occurrence in most localities of small and delicate post-cranial bones of microvertebrates) indicate that the fossil remains usually did not experience long-distance transports within the karstic system. These elements strongly suggest that these local faunas are random samples of the community living in the close neighbourhood of the locality at the time of the karst infilling.
From this data set of local faunas, we drew up synthetic regional lists for 17 successive biochronological units (15 MP reference levels, excluding MP27, and two MN zones [5]) calibrated according to their ‘bioage’ [17,35]. The time resolution thus achieved is about 1 Myr. Due to the way the biochronological units are constructed [65], each taxonomical assemblage can reasonably be considered as a stable pool of species coexisting regionally, but not necessary locally, through the corresponding time span. In the resulting synthetic incidence table, 36% of the 331 phyletic lineages show discontinuous time ranges, which can be made continuous by adding 258 inferred occurrences, leading to a ‘total’ incidence table with 1206 observed (79%) and inferred (21%) occurrences. Relations between the number of sampled localities per biochronological unit and the observed, inferred and total phyletic richness strongly support the working hypothesis that most if not all the gaps are mere sampling artefacts and not genuine absences corresponding to regional extinctions and subsequent immigrations from adjacent areas [16]. In addition, there is a close correspondence of this total (observed + inferred) richness with the Chao-2 nonparametric estimator of total (observed + unobserved) richness for each biochronological unit [8,10]. This suggests that most units have qualitatively similar structures of observed local incidences resulting from comparable sampling efforts (Fig. 2). For these reasons, we will only describe and discuss hereafter results obtained with the total (observed + inferred) incidence table.
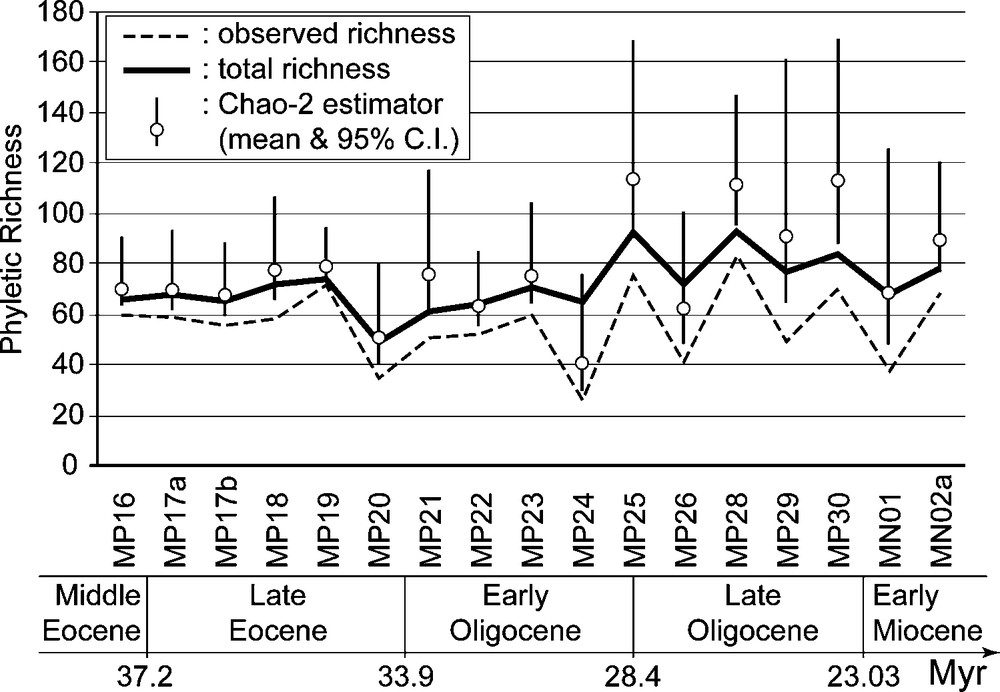
Observed, total (observed + inferred) and estimated (Chao-2) mammalian phyletic richness for the 17 analyzed biochronological units.
Fig. 2. Richesse phylétique mammalienne observée, totale (observée + inférée) et estimée (Chao-2) pour les 17 unités biochronologiques analysées.
At the local community level, we constructed cenograms of the best-sampled localities [29,33]. A cenogram is a synthetic picture of the body-size structure and diversity of a community; it is obtained by plotting on the Y-axis (in log-unit) the mean body weight of each species ranked in a decreasing order of size on the X-axis. The body weight estimates are inferred from body weight–tooth area allometric relations observed for extant mammals. Independently of the detailed biogeographical history and taxonomical content of the community, the comparison of numerous extant local faunas [33] indicates that: (i) a gap in the body-size distribution is frequently observed between 0.5 and 10 kg, corresponding to medium-sized species [37], and (ii) the shape of the cenogram is primarily driven by the surrounding climate (arid or humid, cold or warm) and environment (open or closed vegetation) (Fig. 3). Three empirical relations are thus evidenced:
- • in closed, forest environments, the diversity in medium-sized species is high (the gap between 0.5 and 10 kg is weak or nil), whereas the diversity in large- (> 10 kg) and above all in very large-sized (> 250 kg) species is low;
- • in humid environments, the overall diversity is high, especially for medium to large-sized species;
- • in warm climates, the diversity in small- (< 500 g) and very small-sized (< 12.5 g) species is particularly high.
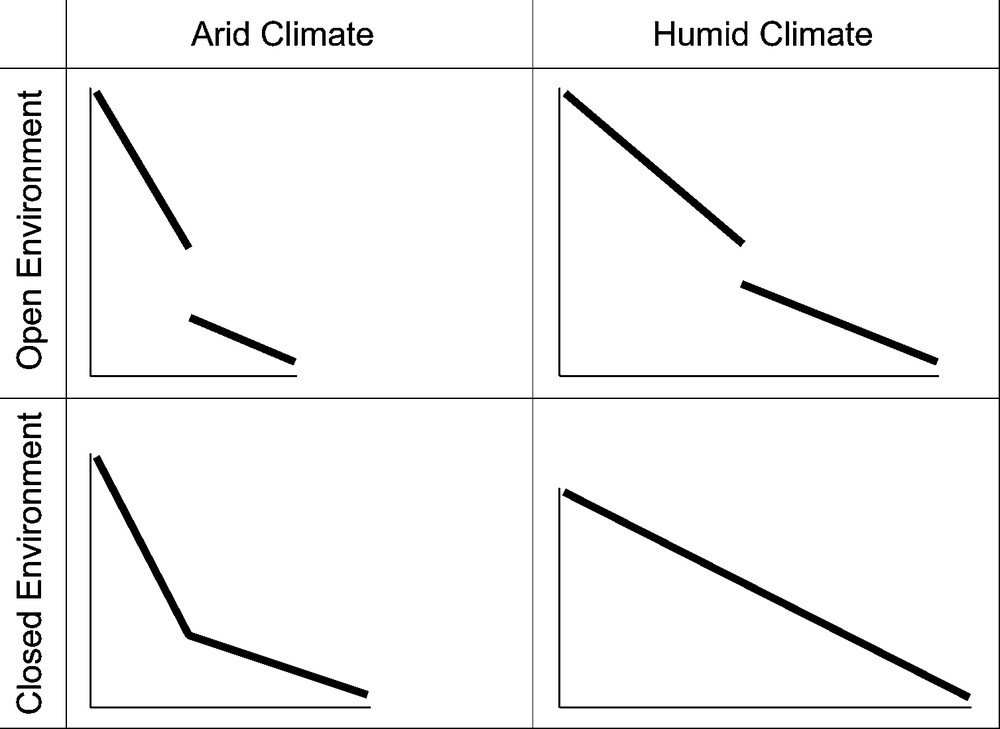
Schematic drawings of the four main categories of cenograms [33] depending on the surrounding climate (humid or arid) and environment (open or closed vegetation).
Fig. 3. Schémas des quatre types principaux de cénogrammes [33] en fonction du climat (humide ou aride) et de l’environnement végétal (ouvert ou fermé).
When applied to a time series of fossil local assemblages from the same region, these taxon-free relations give insights into the environmental and climatic changes experienced in that area during the analyzed time span [29,33].
At the regional metacommunity level, we performed taxonomical evolutionary rate and poly-cohort matrix analyses [16]. First, the computation of taxonomical evolutionary rates is aimed at capturing a time-scaled global picture of the diversity (here, phyletic richness) dynamics. In the great play of the evolution of life, the metacommunity is the company where the rates of morphological evolution measure actor dynamics, whereas the rates of taxonomical evolution measure role dynamics through time. Here we measure the rate of phyletic richness change as a proportional volatility index, expressed in darwin unit (e.Myr−1):
As with any rate of evolution, it is inversely related to the time span over which it is calculated [6,21,62], thus requiring temporal scaling prior to any comparison. We performed such temporal scaling using Gingerich's Log Rate vs. Log Interval (LRI) method [22,23], which allows the robust estimation of two basic quantities:
- • the coefficient of temporal scaling (CTS) of rate on time interval, which is the slope of the LRI linear relation, and ranges between – 1 (constrained stasis) and 0 (directional evolution), the intermediate – 0.5 value corresponding to a perfect random walk;
- • the intrinsic rate of evolution (IR), i.e., the expected evolutionary rate on a standard, 1 time unit interval (e.g., generation, year or Myr). Based on the definition of D, any IR value estimated for a time interval dt (e.g., dt = 1 year = 10−6 Myr) can easily be translated into a more intuitive (absolute) proportion of phyletic richness change (named IPC for intrinsic proportion of change), given that:
While evolutionary rates from data sets with distinct time durations and resolutions are incommensurate, CTS, IR and IPC values of different time series are time-scaled estimates (i.e., time duration- and resolution-free quantities) that can be directly compared with each other.
Second, the analysis of the poly-cohort matrix (PCM) associated with the total data set allows the disentangling of originations and extinctions in the overall species richness dynamics. A PCM is a set of N nested prenascence (backward analysis) and survivorship (forward analysis) poly-cohorts [18,19,57,58] stored in a N × N non-symmetrical matrix of similarity [16]. In this matrix, the ith column records the i – 1 prenascence and N – i survivorship percentages associated with the ith taxonomical assemblage of a time series of N. The graphic display of this matrix using a contour graph allows the localization of time breakpoints in the dynamics of origination or extinction of the analyzed data set – since the prenascence (upper triangle) and survivorship (lower triangle) contour lines are expected to be parallel to the matrix's diagonal only if the extinction and origination rates are constant through time.
In addition, additive cluster analysis and spectral ordering of observed and bootstrapped PCMs are performed in order to detect statistically time intervals of significant changes in the metacommunity's origination and/or extinction dynamics. Additive cluster analysis (e.g., using Neighbour-Joining [63]), yielding an unrooted tree with unconstrained branch lengths, is preferred to ultrametric clustering techniques (e.g., UPGMA) for the reason that it does not involve any evolutionary clock hypothesis [15]. Spectral ordering is a spectral graph theory-based algorithm for the seriation problem [4,9]; it relies on the computation of the Fiedler vector of the Laplacian of the similarity matrix to be ordered. Given a symmetric N × N similarity matrix S = [sij] with null diagonal entries, the Laplacian matrix L = [lij] associated with S is defined as L = TS – S, where TS = [tij] is a diagonal matrix with . The Fiedler vector x = (x1, …, xN) is the eigenvector associated with the smallest nonzero eigenvalue of L; the entries xi of x (hereafter called ‘Fiedler coordinates’) give an optimal sorting of the N compared objects along a continuous axis [4].
3 Results
3.1 Cenogram analysis
Cenograms of 20 of the best-sampled fossil localities were constructed and parallelized to the global deep-sea oxygen isotope record (δ18O) as a first-order proxy of global climate conditions (Fig. 4). The comparison of these cenograms to extant ones (fide [33]) indicates a five-step sequence (‘cenogrammic phases’ 1 to 5), involving:
- • before ∼37 Myr (early Late Eocene), cenograms show high phyletic richness levels with weak or nil medium-size gap and a log-uniform distribution of body weights, typical of mammal communities inhabiting a tropical evergreen forest under warm and humid conditions;
- • from ∼37 Myr to the Eocene/Oligocene boundary (33.9 Myr), cenograms show slightly lower richness levels and weakly concave distributions of body weights, indicating relatively more arid climates (appearance of a dry season?) and more open vegetations, corresponding to wooded savannah;
- • from the Eocene/Oligocene boundary to ∼26.5 Myr (mid Late Oligocene), cenograms illustrate relatively low richness level communities, with a marked medium-size gap and two distinct slopes in the body weight distribution for species >10 kg and <500 g, typical of arid conditions with relatively low mean annual temperatures, associated with (sub)desert to light forest environments;
- • from ∼26.5 Myr to ∼24.5 Myr (Latest Oligocene), cenograms show medium to high richness levels, especially concerning species >10 kg, and a marked medium-size gap, indicating rather temperate, but relatively humid climates, and temperate deciduous forest environments;
- • from ∼24.5 Myr onward, species-rich cenograms show almost log-uniform size distributions, indicating rather closed and warm, sub-tropical conditions possibly less humid than during phase 1.
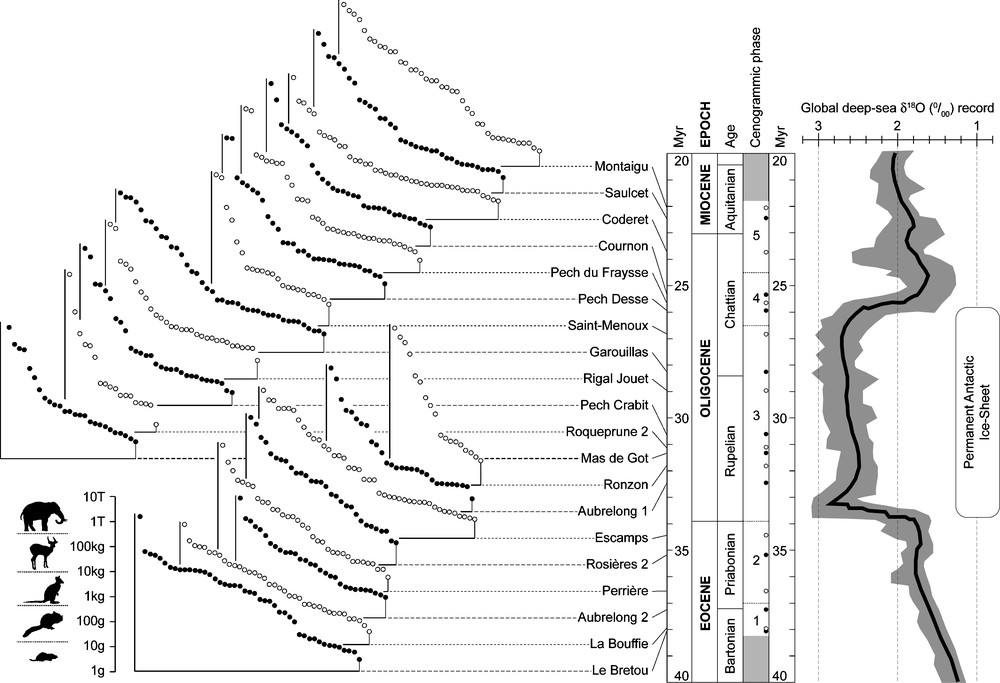
Cenograms of 20 local assemblages from the best sampled fossil localities parallelized to the global deep-sea oxygen isotope record (δ18O) [75]; numerical ages according to [17] (unpublished ages for Miocene cenograms); body-size categories after [37].
Fig. 4. Cénogrammes de 20 assemblages locaux parmi les localités les plus échantillonnées, mis en parallèle avec l’enregistrement isotopique global profond de l’oxygène (δ18O) [75] ; âges numériques d’après [17] (âges inédits pour les cénogrammes miocènes) ; catégories de taille corporelle d’après [37].
Independent of the detailed taxonomical composition of each local fauna, the climatic and environmental implications of this sequence closely fit the global and central Europe climate evolution assumed for this period [52,75]. It particularly emphasizes the climatic deterioration (greenhouse to icehouse transition) of the Upper Eocene, followed by an abrupt change around the Eocene/Oligocene boundary, and then the return to more temperate to subtropical conditions at the end of the Oligocene/beginning of the Miocene. The Eocene/Oligocene transition, corresponding to the rapid onset of a large-scale Antarctic permanent ice-sheet [12,14], thus manifests itself as a major global event deeply affecting the body-size structure of the mammal communities of the Quercy area by way of a drastic habitat perturbation [29,33,34].
3.2 Taxonomical evolutionary rate analysis
We performed LRI-analyses of the whole (marsupialian + placentalian mammals) total data set as well as of three main eutherian guilds (including 259 of the 331 recorded phyletic lineages): predatory mammals (Ferae = Carnivora + Creodonta), primary consumer small mammals (Glires = Rodentia + Lagomorpha), and primary consumer large mammals (Ungulata = Artiodactyla + Perissodactyla) (Table 1). Due to their relatively weak diversity in the data set, we did not separately analyse the insect-feeding mammalian guild (including marsupialians, lipotyphlans, and primates pro parte).
Results of the LRI analyses for all marsupialian and placentalian mammals and for three major eutherian guilds (predators [Ferae], small primary consumers [Glires] and large primary consumers [Ungulata]); see text for the definition of CTS, IR and IPC
Tableau 1 Résultats des analyses LRI pour l’ensemble des mammifères (marsupiaux et placentaires) et pour trois guildes d’euthériens : prédateurs (Ferae), petits consommateurs primaires (Glires) et grands consommateurs primaires (Ungulata) ; voir texte pour la définition de CTS, IR et IPC
| Number of phyletic lineages | CTS | IR (1 year) | IPC (1 year) | |
| Mammalia | 331 | − 0.83 | 9,400 D | 0.94% |
| Ferae | 73 | − 0.69 | 1,930 D | 0.19% |
| Glires | 85 | − 0.72 | 1,680 D | 0.17% |
| Ungulata | 101 | − 0.53 | 224 D | 0.022% |
Analysis at the ‘all-mammal’ level indicates an evolution of the phyletic richness closer to a dynamic equilibrium (CTS = –1) than to a random walk (CTS = – 0.5), whereas separate analyses of the three eutherian guilds suggest time series close to a random walk. Ferae and Glires appear to have had very similar dynamics, both in terms of CTS and IR-values. On the contrary, ungulates, in spite of a rather high taxonomical richness [59,60], show a lower CTS-value (close to a perfect random walk) and an intrinsic rate ∼10 times lower than that of Glires and Ferae. When converted into Intrinsic Proportion of Change, these estimated IR-values return percentages of species richness change in the metacommunity lower than 1% per year, with guild estimates one to two orders of magnitude lower, compatible with the ‘all-mammal’ result.
3.3 Poly-cohort matrix analysis
The contour graph of the ‘all-mammal’ PCM (Fig. 5) allows the visualization of a remarkable feature of the origination and extinction dynamics of the metacommunity. Indeed, Oligocene poly-cohorts show Oligocene prenascence and survivorship contour lines mostly parallel to the matrix's diagonal. However, the Eocene poly-cohorts show sub-horizontalized Oligocene survivorship contour lines, and the Oligocene poly-cohorts show sub-verticalized Eocene prenascence contour lines. These changes of direction create the funnel narrowing observed around the matrix's diagonal at the Eocene/Oligocene limit: the Grande Coupure de Stehlin (GCS), between MP 20 and MP 21 reference levels [34,69]. This indicates that the Oligocene extinction rates of the Eocene poly-cohorts and the Eocene origination rates of the Oligocene poly-cohorts were noticeably lower than their time counterparts. In other words, during Oligocene times, the phyletic lineages that appeared in the metacommunity during the Eocene and survived the GCS experienced simultaneously slower origination and extinction rates than their coeval Oligocene lineages. Thus, the post-GCS metacommunity appears as a mix of two geographically coexisting and ecologically interacting sets of phyletic lineages with rather distinct evolutionary rates.
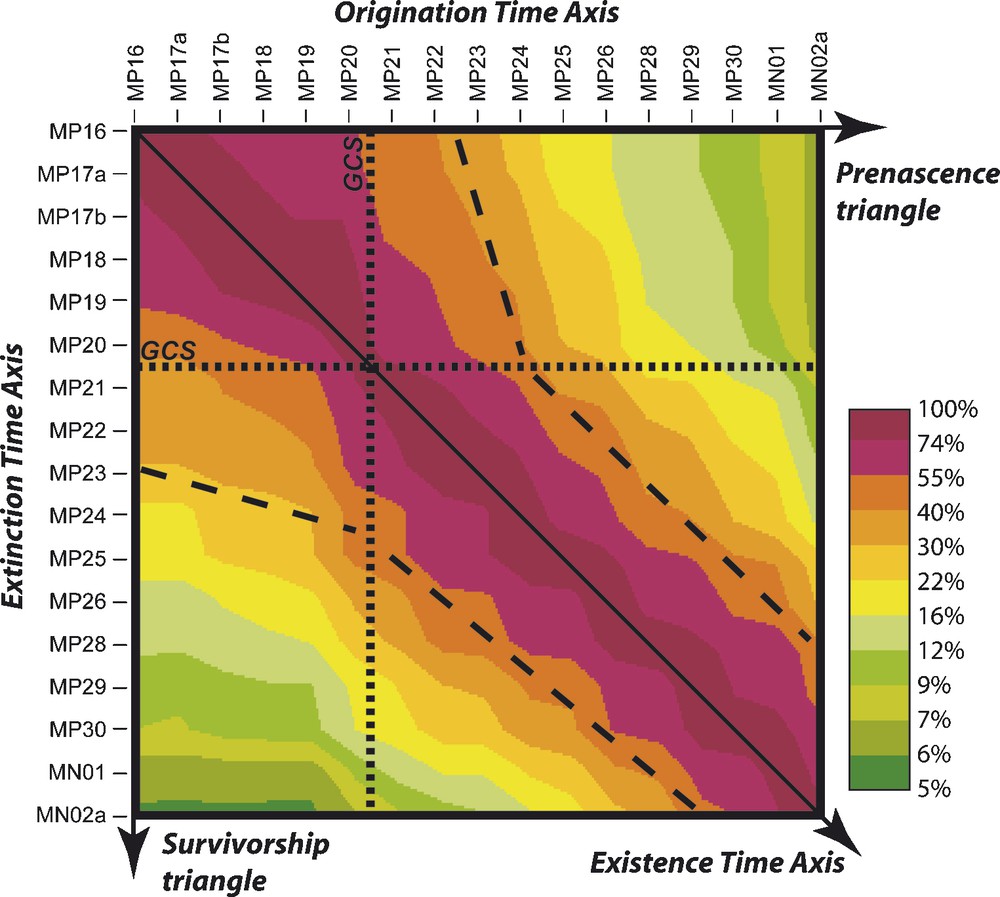
Contour graph of the Poly-Cohort Matrix of the total incidence table. The contour lines (color limits) are log-regularly spaced between 100% (matrix's diagonal) and ∼5%; the bold dashed lines highlight the overall direction change of prenascence and survivorship contour lines around the Grande Coupure de Stehlin (GCS, bold dotted lines). See text and [16] for details – please note that this figure rectifies the one published in [16], which had been erroneously reflected along the matrix's diagonal. For interpretation of references to colours, see the web version of this article.
Fig. 5. Graphe de contour de la matrice de Poly-Cohortes du tableau d’incidence totale. Les lignes de contours (limites de couleurs) sont log-régulièrement espacées entre 100% (diagonale de la matrice) et ∼5% ; les tirets épais soulignent le changement global de direction des contours de pré-naissance et de survie lors de la Grande Coupure de Stehlin (GCS, pointillés épais). Voir texte et [16] pour les détails – notez que cette figure corrige celle, transposée par erreur, publiée dans [16]. Pour l’interprétation des couleurs, voir la version électronique de cet article.
Spectral ordering and additive cluster analysis give further insights into the post-GCS metacommunity dynamics (Fig. 6). Both analyses evidence a regular alternating structure between couples of biochronological units, from the GCS onward. We do not believe that this temporal structuring is a spurious methodological output: prenascence and survivorship percentages are not computationally linked quantities. Moreover, the Eocene biochronological units do not show this structure. Rather, we think that it indicates that the post-GCS metacommunity was subjected to a periodic oscillation between an extinction-dominated phase and a following origination-dominated phase [16,40]. In this case, following the initial GCS origination phase (between MP 20 and MP 21), the analyzed data set would record five such ‘cycles’, each of them representing ∼2 Myr: {MP 21–MP 23}, {MP 23–MP 25}, {MP 25–MP 28}, {MP 28–MP 30}, and {MP30–MN 02a}.
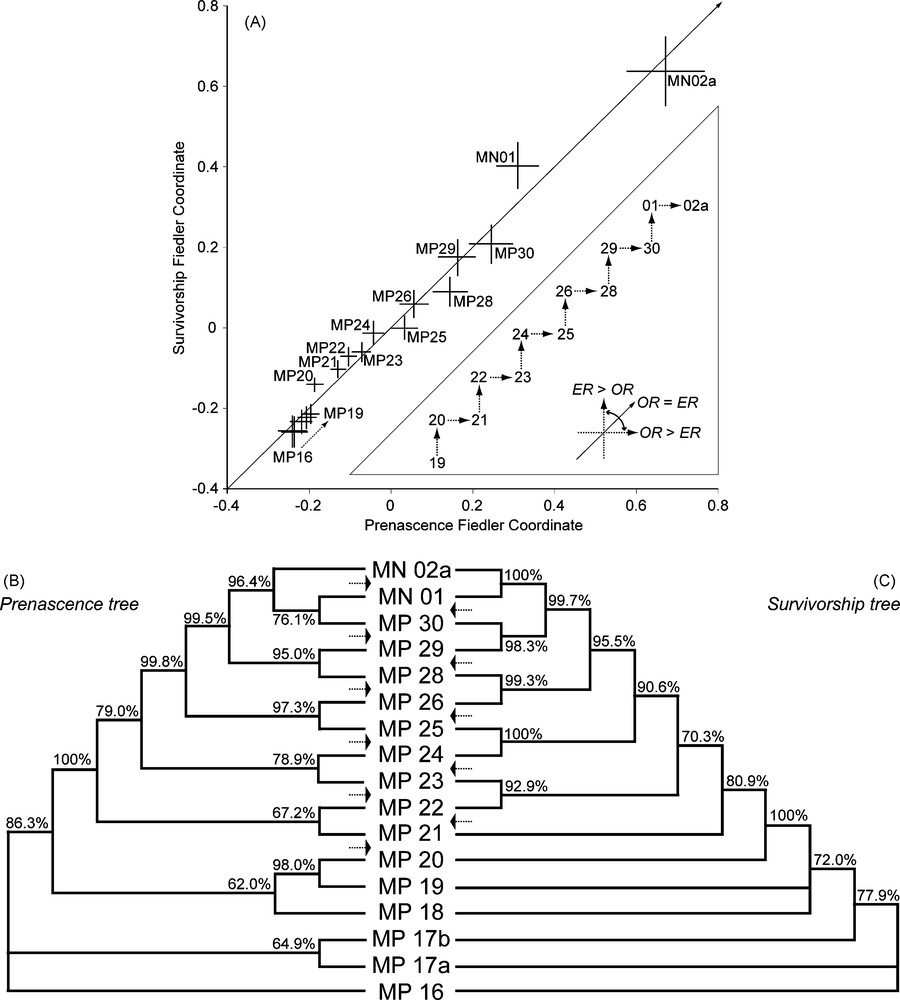
Spectral ordering (A) and additive cluster analysis (B, C) of the poly-cohort's prenascence and survivorship triangular matrices (upper and lower triangles of the PCM; Fig. 5); confidence intervals and support values estimated by nonparametric bootstrap (1000 replicates) of the total incidence table. (A) Fiedler coordinates (bootstrapped μ ± 1 σ) of the 17 successive assemblages based on the spectral ordering of the prenascence (abscissa) and survivorship (ordinate) matrices S = [sij] with , where pij ∈ [0; 1], is the proportion corresponding to the prenascence or survivorship percentage between assemblages i and j, the correction factor 2/π making sij vary between 0 and 1; inset triangle: schematic drawing depicting the regular alternation of origination- (OR > ER) and extinction-dominated (ER > OR) time intervals from MP20 onward (OR = origination rate, ER = extinction rate). (B, C) Neighbour-Joining majority rule consensus trees corresponding to the separate analysis of the prenascence (B) and survivorship (C) distance triangular matrices ; branch lengths are for graphic convenience only; the arrows highlight the alternating origination- and extinction-dominated time intervals.
Fig. 6. Ordination spectrale (A) et analyse de groupement additif (B, C) des matrices triangulaires de pré-naissance et de survie des poly-cohortes (Fig. 5) ; les intervalles de confiance et valeurs de support sont estimés par bootstrap non paramétrique (1000 réplicats) du tableau d’incidence totale. (A) Coordonnées de Fiedler (μ ± 1 σ bootstrap) des 17 assemblages successifs, basées sur l’ordination spectrale des matrices de pré-naissance (abscisse) et de survie (ordonnée) S = [sij] avec où pij ∈ [0; 1] est la proportion correspondant au pourcentage de pré-naissance ou de survie entre les assemblages i et j, le facteur correcteur 2/π faisant varier sij entre 0 et 1 ; en encart : schéma illustrant l’alternance, à partir de MP20, d’intervalles temporels dominés par les apparitions (OR > ER) ou les disparitions (ER > OR ; OR = taux d’apparition, ER = taux d’extinction). (B, C) Arbres Neighbour-Joining de consensus majoritaire associés aux matrices de pré-naissance (B) et de survie (C) ; les longueurs de branches sont arbitraires ; les flèches soulignent l’alternance d’intervalles temporels dominés par les apparitions ou les disparitions.
4 Discussion
The results presented above raise many topics and questions, among which we focus here on two of them: (i) the phyletic richness dynamics at the local and regional scales, and (ii) the evolutionary meaning of the post-GCS metacommunity dynamics.
4.1 Phyletic richness dynamics at the community and metacommunity levels
Cenogram analysis indicates that the phyletic richness and body-size structure of the mammalian communities inhabiting the Quercy and Limagne area strongly fluctuated through the analyzed time span (Fig. 4), revealing a consistent picture compatible with the Palaeogene global and central Europe climate record [52,75]. At the same time, the regional phyletic richness did not noticeably evolve (Fig. 2): the LRI-analysis of the whole (marsupialian + placentalian mammals) total data set indicates a phyletic richness dynamics closer to a dynamic equilibrium (i.e., random fluctuations around a constant value) than to a random walk (Table 1). At the same regional level, this result contrasts with the variations observed in origination and extinction rates as well as in intra-family phyletic richness [16,30,34,36,40]. Hence, comparison between these two spatial levels of ecological integration strongly suggests that the inter-community (β) mammalian diversity was inversely correlated to the intra-community (α) diversity so that the metacommunity (γ) diversity was stabilized through time. In other words, when local richness was high, coeval communities showed rather homogeneous taxonomical compositions (low β-diversity ⇒ γ-diversity close to average α-diversity), whereas when local richness was low, coeval communities showed rather heterogeneous taxonomical compositions (high β-diversity ⇒ γ-diversity higher than average α-diversity). Given the inferred climatic and environmental evolution, such relationships between α-, β- and γ-diversities imply that the forest communities observed at the beginning and at the end of the analyzed time series had rather homogeneous mammalian taxonomic compositions. Conversely, the taxonomic compositions of the open-environment communities corresponding to cenogrammic phase 3 were noticeably more heterogeneous. Such a result makes sense, and strongly suggests that the first-order control parameter stabilizing the metacommunity richness was landscape heterogeneity: even though high energy-level ecosystems supporting high local diversities, closed environments such as temperate and tropical forests are rather monotonous landscapes when compared to mosaics associated with more open environments such as sub-deserts, wooded savannahs and light forests.
Concerning the three eutherian guilds analyzed separately, the observed differences in their intrinsic dynamics of phyletic richness change (Table 1) deserve some comments.
On the one hand, allometric scaling of most life history traits to adult body size (e.g., metabolic, growth, and fecundity rates, lifespan, etc.), combined with distinct demographic tactics, clearly opposes Glires and Ungulata along an axis of iteroparity [20,55]: Glires show higher body weight-standardized fecundity and age at first reproduction than ungulates. Hence, ungulate populations experience slower demographic turnovers, and then comparatively more stable population dynamics than Glires. Thus, they can logically be expected to show a lower intrinsic rate of phyletic richness variation through time. This hypothesis is strongly supported by independent evidence on the stronger dependence and sensitivity of species richness to local environmental conditions (e.g., temperatures and precipitations) for three groups of murid rodents [1,39,51] than for ungulates [24].
On the other hand, all body weights being equal, predatory mammals show significantly wider home ranges and lower individual densities and biomass per unit area than ungulates [26,53]. These differences are mostly due to energetic reasons linked to the high mean trophic positions of predators in food webs. When combined with the various and intricate ‘bottom-up’ and ‘top-down’ forces that make up and regulate the functioning of any ecosystem [54,64], the hypothesis that regional assemblages of predatory mammals are more diversification prone than large primary consumer ones appears straightforward and strongly echoes the inferred higher intrinsic rate for Ferae [7]. At that point, based on the differences inferred between phyletic richness dynamics of small and large primary consumers, it would be interesting to analyse separately Glires-feeding and Ungulata-feeding predator guilds in order to detect potential coupling in predator/prey guilds long-term dynamics. Unfortunately, this critical information on food-web structuring is still wanting and will require further works. Actually, such specialized guilds could be rather difficult to untangle, as most mammal predators feeds on a body size-spectrum of prey that depends on their own body size, but usually includes Glires and Ungulata species.
4.2 The post-Grande Coupure de Stehlin metacommunity evolutionary dynamics
The overall picture of the post-GCS evolution of the mammalian metacommunity of the Quercy and Limagne area suggests a rather regular dynamic of origination and extinction (Fig. 5), with an average lineage duration of ∼2.5 Myr [16]. Nevertheless, a closer look at the prenascence and survivorship time series shows a regular alternating structure indicating that the post-GCS evolving mammalian metacommunity was subjected to a periodic oscillation between an extinction- and an origination-dominated phase (Fig. 6). At this time, the very nature of the mechanisms underlying this periodic signal, if real, remains to be elucidated. Among various possibilities, two working hypotheses appear worthy of attention.
On the one hand, it could be related to the periodic evolution of some ‘extrinsic’ driving parameter(s). Among them, a good candidate could be the low-frequency modulations of Milankovitch oscillations. Indeed, three such low-frequency cycles are known: 2.37- and 0.97 Myr eccentricity cycles, and 1.2-Myr obliquity cycle [28]. Stable isotope proxies (δ13C and δ18O) of these long-period astronomical cycles are recorded in worldwide deep-sea sediments from the Earliest Oligocene onward [12,73]; as far as we know, they have not yet been identified for greenhouse Palaeocene and Eocene times [75]. These cycles modulate the amplitude of their corresponding high-frequency cycles (with periods of ∼405 and ∼110 kyr for eccentricity, and ∼40 kyr for obliquity). In this way, they have a global climatic influence via an enhanced sensitivity of the cryosphere to low variations in high-latitudes seasonality due to the lack of warm summers under low obliquity amplitude conditions [73,76]. By inhibiting summer ice melt, obliquity amplitude minima under icehouse conditions may induce ice-sheet expansion, ultimately leading to continental cooling and aridification, and affecting community and metacommunity structure and dynamics through reduced energy availability.
These low-frequency cycles have been recently suggested as primary drivers of the long-term periodic oscillation of rodent species turnover recorded in a 22-Myr-long Neogene time series from central Spain [71]. Interestingly, these authors report statistically significant spectral frequencies in per-taxon extinction rates (two main peaks at ∼0.5 and ∼1 Myr−1) and origination rates (a group of three peaks at ∼0.5 Myr−1) that closely echo the ∼2-Myr period observed here from the Eocene/Oligocene boundary onward. Nevertheless, this hypothesis contrasts with the Cenozoic climate evolution of Central Europe as recorded by fossil megafloras, indicating a relative stability of annual precipitations and summer temperatures through the Cenozoic, whereas winter temperatures closely fit the global marine oxygen isotope record [52]. Hence, the long-term Cenozoic cooling trend as observed in Central Europe appears to be associated with a winter temperature-driven increasing seasonality, possibly due to the weakening of oceanic poleward energy transport. How these Northern hemisphere observations relate (or not) to the above-described astronomical hypothesis clearly falls outside the scopes of this paper; further analytical and modelling works are needed here to better understand the causal dynamics of the onset of permanent polar ice-sheets and its regional and global climate consequences in terms of both temperature and humidity.
On the other hand, the observed periodic oscillation could also be ‘intrinsic’ to the metacommunity, which would behave as a complex adaptive system exhibiting a periodic self-organized dynamic around an equilibrium state initially perturbed by the GCS [27,43,44,66–68]. In this latter, conceptually exciting case, the GCS would have acted on the metacommunity as a breakpoint in interspecies connectivity (as the metacommunity phyletic richness did not markedly change around and after the GCS), making it move from an Eocene to an Oligocene dynamics with two very distinct evolutionary regimes – by inter-species connectivity, we mean trophic and competitive interactions between species. This hypothesis is in line with the above-discussed result, making taxonomically homogeneous Eocene local communities contrast with more heterogeneous Early Oligocene ones. Indeed, an increase in β-diversity under constant γ-diversity logically corresponds to a decrease in inter-species connectivity within the metacommunity. It is well known that decreasing connectivity without changing the richness of a complex system necessarily increases its stability and predictability through positive and negative feedbacks regulating origination and extinction rates [50,67].
Alternatively, it is also possible that these two ‘extrinsic’ and ‘intrinsic’ mechanisms actually occurred together. In this mixed solution, the ‘extrinsic’ driver would have initiated an evolutionary regime then reinforced by the ‘intrinsic’ one. At this time, it seems premature to reach any firm conclusion on that point: more analytical, theoretical and modelling work is clearly needed here to understand better the physical and biological causes and mechanisms underlying this evolutionary pattern.
5 Conclusion and perspectives
The main results presented and discussed above can be summarized as follows:
- • the taxonomic richness and body size structure of the local assemblages (communities) closely responds to the global climatic conditions (Fig. 4);
- • at the metacommunity level, the mammalian phyletic richness evolutionary dynamics appears closer to a dynamic equilibrium than to a perfect random walk, whereas the three eutherian guilds (Ferae, Glires and Ungulata) are characterized by distinct intrinsic dynamics of phyletic richness change, compatible with life history traits of these groups (Table 1);
- • at the Eocene/Oligocene boundary (33.9 Myr), the Grande Coupure de Stehlin (GCS) is a critical time in the origination/immigration and extinction/emigration dynamics of the metacommunity (Fig. 5);
- • from the GCS onward, the metacommunity shows a periodic evolutionary dynamic driven by a regular alternation of extinction- and origination-dominated phases (Fig. 6).
These initial results indicate that the analyzed data set constitutes a rather unique ‘deep-time key’ into major current macroecological debates, e.g.:
- • what are the modes, rates, and control parameters of the evolution of α, β and γ-diversities through time?
- • are local communities’ species assemblages randomly sorted from a common regional pool? – the ‘niche vs. dispersal-assembly’ debate;
- • how does phylogeny shape the structural and functional properties of communities and metacommunities and control their evolution through time?
In the specific context of ecosystem response to extreme events, the goal of such a deep-time approach to metacommunity dynamics is to give time-scaled very long-term reference series with which extant changes can be objectively compared. From this critical viewpoint, a final overall perspective thus comes to light: the necessity to maintain an intense activity and funding of the field and lab-work for fossil locality prospecting, data collecting and palaeontological systematics, which is the only way to improve the quality and quantity of data [3,46,47].
Acknowledgments
We are mostly indebted to the French Academy of Sciences, and most particularly to H. Décamps and P. Taquet, in giving us the opportunity to present this paper during the meeting EECE. We thank all of those workers who, by collecting and studying mammal fossils from the Quercy and Limagne areas over the last 40 years, have made this work possible. Among them, we dedicate this article to the late Louis Thaler (University of Montpellier). G. Stringer kindly improved the English spelling. This work was partly supported by the ‘Institut français de la biodiversité’. Contribution UMR5125-08.001.