

1 Introduction
Eutrophication of coastal zones has emerged as one of the most important current aquatic problems of the 21st century [23]. It is definitively known that such undesirable water quality changes are linked to anthropogenic nutrient loading into aquatic ecosystems [24]. Thus, the first stage in the study of eutrophication has to be the quantification of direct nutrient inputs into the ecosystem under study (i.e. [7,19,22,29]). The brackish Berre Lagoon (Mediterranean coast, France) is one of the largest Mediterranean coastal lagoons (155 km2). It has been characterized by a heavy freshwater discharge from a hydroelectric power plant since 1966. Initially, freshwater inputs could reach 6630 × 106 m3 yr−1 (more than seven times the lagoon's volume) and more than 1.6 × 10⁶ tons of suspended matter in 1977. Such inputs are dependent on electricity requirements, and thus present interannual and seasonal variations. Consequently, they led to a complete destabilization of the lagoon's ecology, with strong changes in structure and functioning [11,12,15], and the disappearance of various marine biological indicators (e.g., zoobenthos, and Zostera sp. seaweeds) [2,3,25]. The Berre Lagoon gradually became eutrophic, exhibiting highly coloured surface waters (>100 μg Chla l−1 in the 1990s [20]) and anoxia at the bottom.
In 2004, The European Court of Justice condemned the French State for not respecting the Athens Protocol (advocating Mediterranean protection against telluric pollution) and requested new managing strategies. Harsher annual restrictions were then imposed: a maximum freshwater discharge of 1.6 × 10⁹ m3 yr−1 for 2005, and 1.2 × 10⁹ m3 yr−1 for 2006, equivalent to 1.3 times the lagoon's volume, and a maximum suspended matter discharge of 60 000 tons yr−1.
Moreover, it was decided that the SM concentrations allowed into the plant's waters were to be reduced to 1 g l−1 at the most.
With the prospect of a progressive reduction of freshwater and suspended matter inputs by the power plant, the rivers inputs could become more significant in the matter budget entering the Berre Lagoon. In real terms, these rivers drain a catchment basin where the demographic population increased by approximately 114% from 1968 to 1999, with over 600,000 inhabitants [10].
Since the opening of the power plant in 1966, scientists have focused on the impact of the plant's inputs on the ecology of the Berre Lagoon (i.e. [16,18]). Few studies have been carried out on river loadings and contributions [1,6], and there is no recent data available for nutrient inputs by these natural tributaries.
This study aims at quantifying the annual and seasonal inputs of suspended matter, nitrogen, and phosphorus into the Berre Lagoon from the three natural tributaries, in order to assess their significance in the eutrophication of the lagoon; this will be compared to the decreasing power plant inputs. Direct measurements of both water flow and concentration were conducted from January 2005 to December 2006. The strategy used was particularly adapted to floods: these sudden rises of water level were found to be significant in annual discharge in the context of the Mediterranean climate [14].
2 Material and methods
2.1 Study area
The Berre Lagoon is located in southeastern France (43°30′N and 5°10′E) (Fig. 1). It is a shallow semi-confined ecosystem (mean depth 6.5 m) connected to the Mediterranean Sea via the Caronte channel in the southwest. It contains 980 million m3 of brackish water (salinity ranged from 20 to 30 in this study). It is also connected to a small pond (the Pond of Bolmon) to the southeast, via little apertures.
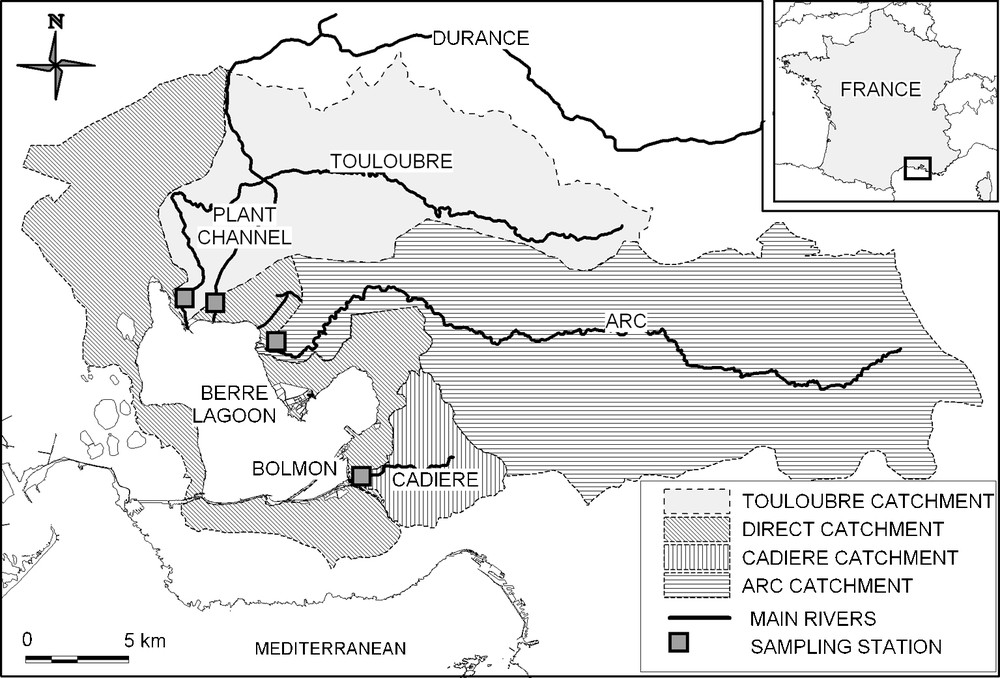
Location of the Berre Lagoon and its natural catchment basins.
Fig. 1. Localisation de l’étang de Berre et de ses bassins versants.
The channel of the hydroelectric power plant is situated to the north of the lagoon. The freshwater comes from the Durance mountain river, which flows in from the north (Fig. 1), and is partly diverted by a dug-out channel in order to drive plant turbines. The lagoon also receives freshwater from two natural tributaries in the North: the Arc (80 km long) and the Touloubre (60 km long). A third small river (the Cadière) flows into the Pond of Bolmon.
The catchment basins of the Arc, the Touloubre, and the Cadière cover a surface area of 1200 km2 (730, 400 and 73 km2 respectively), that is 76% of the Berre Lagoon's total catchment area. The remaining 24% represents the direct catchment basin of the lagoon (Fig. 1). This area has together 600,000 inhabitants and large industrial and commercial parks (oil refineries, petrochemistry, and aeronautics industries), supporting the main economic activities in this region. The catchment basin of the Cadière is the most-inhabited area [9], with one of the highest population densities of the region (1400 inhabitants km−2); a third of its surface is covered with artificial urbanized and industrialized areas.
2.2 Flow determination
On each river (Fig. 1), the water level was automatically monitored at 5-s intervals by means of radar (model Endress & Hauser Waterpilot M-FMR240) and a mean water level was calculated and supplied at 10-min intervals. Water flow was determined for every mean water level, thus every 10 min, by comparing current meter readings and water-level gauges. This latter information was provided by the DIREN PACA data base (‘DIrection Régionale de l’ENvironnement de la région Provence – Alpes - Côte d’Azur’). This organization has monitored the Arc and the Cadière Rivers at the same stations as this study and further upstream in the Touloubre River for over a decade, and provides a good database of water gauging during floods. On each river, the radar system was linked to a refrigerated automatic sampler (model ISCO). These were programmed to trigger in cases of sudden water level rise (i.e. flood events), so that the samplers pump water from the river at 10-min intervals. This water was collected into 24 polycarbonate bottles embedded in the refrigerated enclosure. Each bottle contained six samples of water, thus representing one hour of sampling. In a ‘non-flood’ period, one water sample was taken by manual release of the automatic sampler, every two weeks.
In the case where the plant turbines were activated, water sampling was achieved by the manual release of the automatic sampler installed in the power plant.
2.3 Concentration measurements
Fifty to 100 ml of water were filtered through Whatmann GF/C glass-fibre membranes and frozen at −20 °C, in order to determine subsequently suspended matter (SM) concentration. Nutrients (nitrate N–NO3, nitrite N–NO2, ammonium N–NH4, and phosphate P–PO4) and total matter concentrations (total nitrogen TN, and total phosphorus TP) were measured from water that had been poisoned with HgCl2 following sampling and stored in 40-ml polyethylene bottles and 40-ml SCHOTT glass bottles, respectively. Nutrients were measured by colorimetric methods [17,32] using an automated Technicon Autoanalyser III [28]. N–NH4 was determined separately using the fluorimetric method [8]. Total nitrogen and phosphorus were determined using the wet-oxidation technique [21].
2.4 Flux calculations
For each river, during the ‘non-flood period’, the daily water discharge Fwater was used for the daily total matter flux (FM) calculation and was obtained by totalling the 10-min discharge values.
FM was calculated using the following equation:
| (1) |
We then considered as a ‘flood event’ a variation in daily Fwater greater than 100,000 m3 d−1 overnight in the Arc and the Touloubre and greater than 50,000 m3 d−1 overnight in the Cadière. During floods, the hourly FM was calculated using the equation above using hourly M (measured in situ) and hourly Fwater values.
A total of 55 samples were taken on each river, during the ‘non-flood period’. Up to 10 flood events per year can be observed, but only half were sampled correctly, due to a problem that was encountered with the telecommunication between the radars and the ISCO samplers. Thus, in order to establish an annual budget, the matter discharged from these unsampled flood events was determined from similar flood events (similar flow and duration) that had been correctly sampled, in proportion to water volume.
Freshwater and suspended matter discharge data from power plant are provided by EDF. The manager determines, by a common method, the freshwater volume flowed into the lagoon that corresponds to the amount of electricity produced. Moreover, EDF measures the SM concentrations at the same station (after turbines), with the same technique (filtration and weighing) as in this study. Nitrogen and phosphorus discharges from the plant were calculated with the same method as for rivers in 2006 only. In 2005, the sampling in the plant channel was carried out only since April, and thus was deemed insufficient for the calculation of an annual budget. In 2005, we thus assessed an annual discharge from Eq. (1) using M, the mean concentration of the considered element in the whole study.
3 Results
3.1 Freshwater river discharges into the lagoon
The three rivers present different hydrological regimes (Fig. 2). The Arc and the Cadière Rivers are subject to rainfall conditions [6]: they are marked by two contrasting periods (September to April) when their mean Fwater values are high (0.17 and 0.05 × 10⁶ m3 d−1, respectively) and a dry summer period (May to August) when the mean Fwater value is very low (0.03 × 10⁶ m3 d−1 for both of them). On the contrary, the flow of the Touloubre is characterised by large, sudden variations due to drainage and irrigation channels and a small hydroelectric power plant, which is situated on the catchment basin. Due to the irrigation and drainage channels inputs, there is an abundant water supply from March to October (mean Fwater = 0.25 × 10⁶ m3 d−1), which is followed by a short winter period with low-flow discharges (mean Fwater = 0.12 × 10⁶ m3 d−1). Large floods mainly affect the three rivers during autumn and winter: the maximum daily flow reached 4.9 × 10⁶ m3 d−1 in the Arc in January 2006, 0.77 × 10⁶ m3 d−1 in the Touloubre in April 2005 and 0.44 × 10⁶ m3 d−1 in the Cadière in September 2006 (Fig. 2).
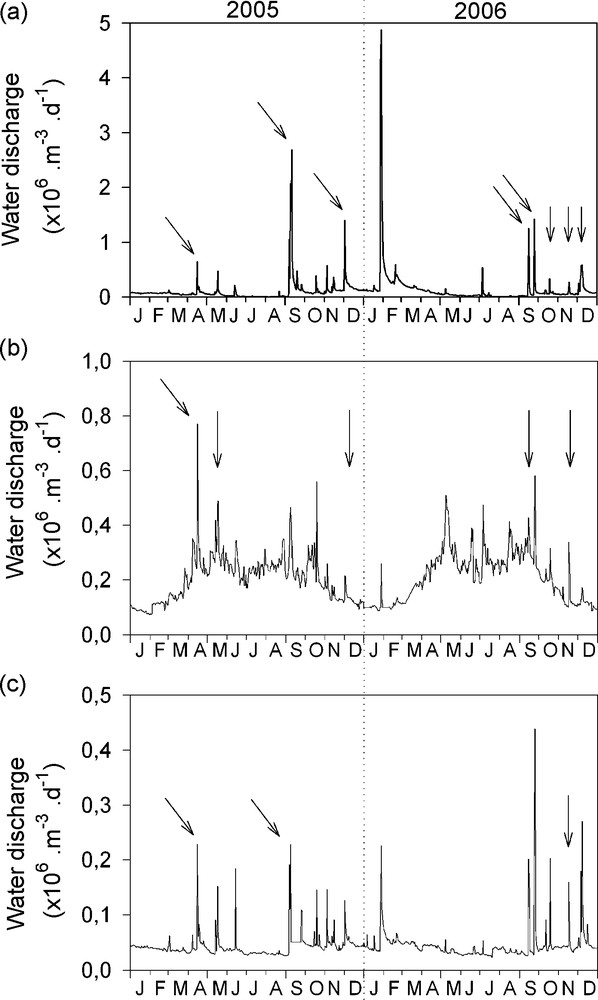
Hydrological regime of the Arc (a), the Touloubre (b), and the Cadière (c). Daily water discharge (×106 m3 d−1) in 2005 and 2006. Correctly sampled flood events are indicated by arrows.
Fig. 2. Régime hydrologique de l’Arc (a), de la Touloubre (b) et de la Cadière (c). Flux journalier d’eau (en millions de m3 j−1) en 2005 et 2006. Les crues correctement échantillonnées sont pointées d’une flèche.
We can therefore estimate an annual mean flow in the Arc, the Touloubre, and the Cadière of 1.44, 2.39, and 0.52 m3 s−1, respectively.
3.2 Particulate loads
In this study, the mean SM concentrations measured in the three rivers, during periods of low flow, were less than 60 mg l−1 (Table 1). Concentrations of suspended matter (SM) increased with increasing the water flow, which is typical for many river systems [4], SM concentrations increasing up to 170 times during flood events (Table 1). Plotting log values enabled us to determine significant relationships between SM concentrations (SM in mg l−1) and flow (Q in m3 s−1) over the 2-year study (Fig. 3):
| (2) |
| (3) |
| (4) |
Average (m), standard deviation (δ) and range of concentrations of various parameters in the tributaries of the Berre Lagoon during ‘no-flood’ periods
Tableau 1 Moyenne (m), écart-type (δ), et gamme de concentrations des différents paramètres dosés dans les tributaires de l’étang de Berre à l’étiage
| 2005/2006 | 1969 | 1977 | 1985 | |||||
| this study | [13] | [10.11.24] | [1] | |||||
| m | δ | range | C | m ± δ | m ± δ | m ± δ | ||
| SM (mg/l) | Arc | 24 | 26 | 3–110 | 4091 | |||
| Touloubre | 55 | 49 | 3–222 | 1327 | ||||
| Cadière | 17 | 13 | 3–67 | 1438 | ||||
| Plant channel | 263 | 253 | 7–672 | |||||
| N-NO3 (mg/l) | Arc | 2.6 | 0.9 | 0.3–4.6 | 3,8 | 2.6 ± 0.3 | 3.0 ± 2.1 | 5.4 ± 2.6 |
| Touloubre | 1.7 | 0.9 | 0.6–4.1 | 2,8 | 1.7 ± 1.9 | 1.5 ± 0.4 | 2.3 ± 0.9 | |
| Cadière | 2.1 | 0.8 | 0.2–4.0 | 2,6 | ||||
| Plant channel | 0.4 | 0.1 | 0.2–0.6 | 0.4 ± 0.1 | 0.5 ± 0.3 | 0.4 ± 0.1 | ||
| N-NO2 | Arc | 0.07 | 0.06 | 0.01–0.30 | 0,34 | 0.19 ± 0.20 | 0.25 ± 0.15 | |
| (mg/l) | Touloubre | 0.10 | 0.08 | 0.01–0.30 | 0,20 | 0.10 ± 0.10 | 0.10 ± 0.05 | |
| Cadière | 0.44 | 0.36 | 0.02–1.77 | 0,19 | ||||
| Plant channel | 0.04 | 0.04 | 0.00–0.10 | 0.01 ± 0.01 | 0.01 ± 0.01 | |||
| N-NH4 | Arc | 0.1 | 0.1 | 0.01–0.53 | 1 ± 1 | |||
| (mg/l) | Touloubre | 0.1 | 0.1 | 0.01–0.40 | 0.7 ± 0.9 | |||
| Cadière | 1.9 | 2.6 | 0.04–6.91 | |||||
| Plant channel | 0.03 | 0.01 | 0.02–0.04 | 0.04 ± 0.02 | ||||
| P-PO4 | Arc | 0.3 | 0.3 | 0.01–2.4 | 0,5 | 0.3 ± 0.1 | 0.4 ± 0.2 | 1.4 ± 0.7 |
| (mg/l) | Touloubre | 0.2 | 0.2 | 0.03–1.0 | 0,6 | 0.2 ± 0.2 | 0.1 ± 0.1 | 0.5 ± 0.3 |
| Cadière | 0.6 | 0.4 | 0.1–1.8 | 0,7 | ||||
| Plant channel | 0.06 | 0.05 | 0.00–0.20 | 0.08 ± 0.08 | 0.02 ± 0.02 | 0.02 ± 0.02 | ||
| TN | Arc | 4.2 | 2.1 | 0.9–12.5 | 10,7 | |||
| (mg/l) | Touloubre | 3.1 | 1.6 | 1.2–10.3 | 12,4 | |||
| Cadière | 8.9 | 4.5 | 2.1–19.9 | 14,7 | ||||
| Plant channel | 1.4 | 0.5 | 0.4–2.5 | |||||
| TP | Arc | 0.6 | 0.4 | 0.1–2.5 | 4,5 | |||
| (mg/l) | Touloubre | 0.5 | 0.4 | 0.1–1.9 | 3,0 | |||
| Cadière | 1.4 | 0.9 | 0.1–3.6 | 2,1 | ||||
| Plant channel | 0.3 | 0.3 | 0.1–1.0 |
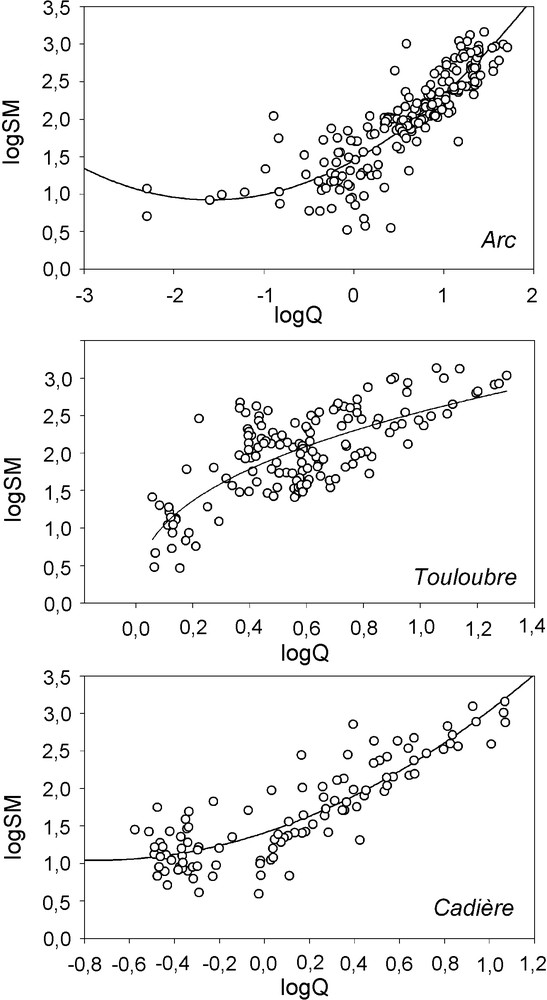
Relationship between suspended matter concentrations (SM) and flow in the Arc, the Touloubre and the Cadière.
Fig. 3. Relation entre concentrations en matière en suspension (SM) et les débits dans l’Arc, la Touloubre et la Cadière.
In the plant channel, the concentration of suspended matter was highly variable, ranging from 6 to 672 mg l−1). There was no correlation between the SM concentration and flow, thus with power plant activity
| (5) |
3.3 Nutrient loads
3.3.1 Dissolved inorganic nitrogen (DIN)
DIN concentrations in the plant channel were relatively constant during the year (Fig. 4 and Table 1). The major form of DIN was nitrate, with a mean concentration of 0.4 ± 0.1 mg N-NO3 l−1. This represents 86% of the total inorganic nitrogen, N-NO2 and N-NH4 constituting the remaining 8% and 6% of total DIN.
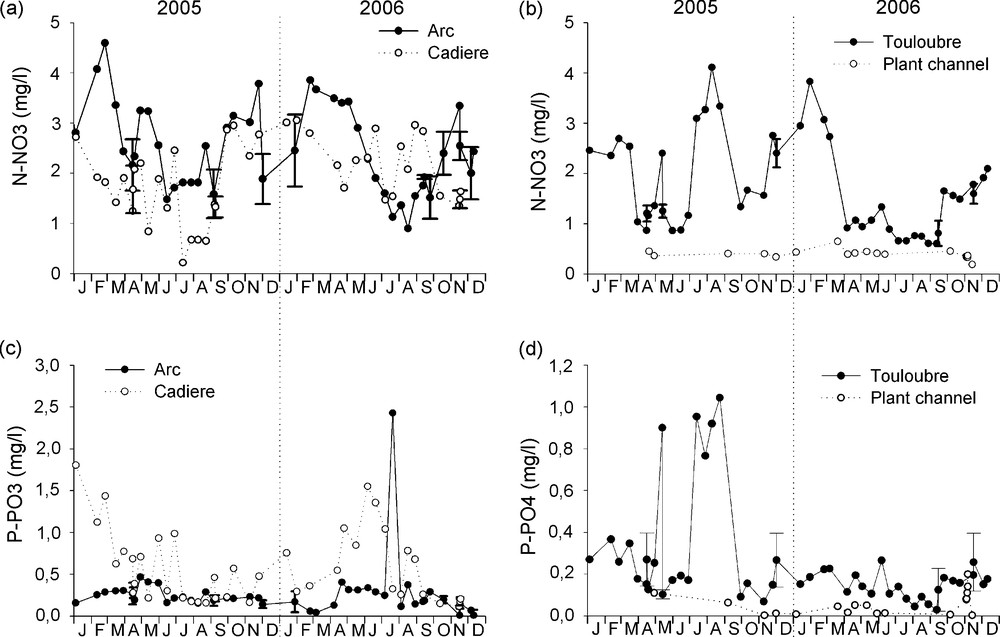
Instantaneous N-NO3 (a and b) and P-PO4 (c and d) concentrations in the tributaries of the Berre Lagoon. Values during flood events are represented by an average associated with error bars (standard deviation).
Fig. 4. Concentrations instantanées de N-NO3 (a et b) et de P-PO4 (c et d) dans les différents tributaires de l’étang de Berre. Les concentrations mesurées pendant les crues sont représentées par une valeur moyenne associée à une barre d’erreur (écart-type).
Concentrations of DIN were higher in the rivers (Table 1). The major form of DIN was nitrate: we measured a mean of 2.6 ± 0.9, 2.1 ± 0.8 and 1.7 ± 0.9 mg N-NO3 l−1 in the Arc, the Cadière, and the Touloubre, respectively. In the Cadière River, concentrations of ammonium could reach very high values (up to 7 mg N-NH4 l−1), so that the mean concentration was equivalent to that of nitrate (1.9 ± 2.6 mg N-NH4 l−1, whereas mean values were 0.1 ± 0.1 in both the Arc and the Touloubre). DIN concentrations in the rivers showed actually great variations over the year, and there was no particular seasonal evolution. For example, concentrations of nitrate fluctuate between 1 and 5 mg N-NO3 l−1 (Fig. 4). We observed periods of low values in the Cadière (<1 mg l−1 during July and August 2005), and in the Touloubre: ∼1.5 mg l−1 from April to December 2006, whereas they reached 4 mg l−1 at the same period of the previous year.
During flood event periods, high-frequency sampling did not indicate any significant relationship between water flow and DIN concentration. Indeed, nitrate, nitrite, and ammonium exhibited variable behaviour with increasing flow: they increased, decreased, or remained stable during water flow increase, depending on event and river. It should be noted that during these surge events, DIN concentrations reflected the wide annual ranges observed in non-flood periods (Fig. 4 and Table 1).
3.3.2 Phosphate
Phosphate concentrations in the plant channel waters were low (mean of 0.06 ± 0.05 mg P-PO4 l−1) compared to values observed in the Arc (0.3 ± 0.3 mg l−1), the Touloubre (0.2 ± 0.2 mg l−1) and the Cadière (0.6 ± 0.4 mg l−1) (Table 1). No seasonal evolution in phosphate concentrations can be observed in any tributary. Concentrations in the Arc and the Touloubre are generally less than 0.5 mg P-PO4 l−1. However, they punctually reached 1 to 2.5 mg P-PO4 l−1 in July 2006 in the Arc, and in the summer 2005 in the Touloubre (Fig. 4). Such high values can be related to agricultural activity and/or organic pollution in the catchment basins. The highest values observed in the Cadière could be due to urban and industrial influences on its catchment basin.
As in the case of DIN, we were unable to establish a relationship between freshwater flow and phosphate concentration. Nevertheless, it should be noted that these variations during flood events are weak, and belong to the wide ranges observed at low flow in non-flood periods (Fig. 4 and Table 1).
3.3.3 Total nitrogen, and total phosphorus
The Cadière River exhibited the highest values of TN (mean of 8.9 ± 4.5 mg N l−1) and TP (mean of 1.4 ± 0.9 mg P l−1). The plant channel exhibited the lowest values, with only 1.4 ± 0.5 mg TN l−1 and 0.3 ± 0.3 mg TP l−1 (Table 1). As for DIN and phosphate, concentrations of total nitrogen and phosphorus varied over a wide range during the year, without any particular seasonal evolution.
A relationship between water flow and total matter concentrations is observed, exhibiting an increase in concentration with the increase of water flow during a flood event. However, it could be observed first an increase, followed by a dilution of total matter with water flow. This pattern could indicate the exhaustion of organic suspended matter in rivers that are under the influence of high water flow. These variations in concentration during floods are of the same order of magnitude as those observed over the year, with the exception of TP concentrations in the Arc, which can increase significantly with water flow increase. The same pattern was observed in the Touloubre in two flood events that took place during the short winter, low-flow period.
3.4 Matter budgets for the Berre Lagoon
3.4.1 Annual budget
During this study (period 2005–2006), the lagoon received an average of 824 × 106 m3 of freshwater per year. The plant canal, respecting the discharge quota, brought 83.5% of this annual discharge, remaining the largest tributary of the Berre Lagoon. The Touloubre is the main natural tributary of the lagoon, with an annual discharge of 75.5 × 10⁶ m3 yr−1, representing 9% of total input (Table 2). The Arc and the Cadière represent 5.5 and 2% respectively. Six to nine flood events are generally observed per year in each river, representing only 8% of annual time, but accounting for nearly half (44.5%) of the annual water discharge of the Arc, 20% of the Cadière and 14% of the Touloubre Rivers’ annual discharge (Table 2).
Summary of annual matter discharge, and matter discharge during floods in 2005 and 2006
Tableau 2 Récapitulatif des apports de matière annuels, et pendant les crues en 2005 et 2006
| Arc | Touloubre | Cadière | Plant channel | Total | ||||||||
| Total | Floods | Total | Floods | Total | Floods | |||||||
| Time (days) | 2005 | 365 | 34 | 9% | 365 | 34 | 9% | 365 | 31 | 8% | 365 | 365 |
| 2006 | 365 | 28 | 8% | 365 | 25 | 7% | 365 | 29 | 8% | 365 | 365 | |
| Water (.106 m3) | 2005 | 39 | 17 | 44% | 74 | 12 | 16% | 16 | 3 | 19% | 660 | 789 |
| 2006 | 52 | 23 | 45% | 77 | 9 | 12% | 17 | 3 | 21% | 713 | 859 | |
| SM (tons) | 2005 | 10,042 | 9271 | 92% | 5114 | 2003 | 39% | 1177 | 911 | 77% | 41,904 | 58237 |
| 2006 | 30,835 | 30,460 | 99% | 5818 | 1775 | 31% | 1142 | 931 | 82% | 42,977 | 80772 | |
| N-NO2 (tons) | 2005 | 2.5 | 1.2 | 48% | 5 | 0.8 | 16% | 5 | 0.3 | 7% | (26 ± 26) | (38 ± 26) |
| 2006 | 5 | 2 | 44% | 6 | 0.6 | 9% | 5 | 0.4 | 7% | 7 | 23 | |
| N-NO3 (tons) | 2005 | 95 | 31 | 33% | 147 | 15 | 10% | 32 | 5 | 15% | (264 ± 66) | (538 ± 66) |
| 2006 | 137 | 41 | 30% | 102 | 12 | 12% | 36 | 5 | 15% | 346 | 621 | |
| P-PO4 (tons) | 2005 | 9 | 3 | 36% | 26 | 1 | 5% | 10 | 1 | 9% | (40 ± 33) | (85 ± 33) |
| 2006 | 8 | 4 | 53% | 10 | 1 | 10% | 8 | 1 | 11% | 24 | 50 | |
| TN (tons) | 2005 | 231 | 102 | 44% | 256 | 35 | 14% | 186 | 18 | 9% | (924 ± 330) | (1597 ± 330) |
| 2006 | 282 | 105 | 37% | 247 | 29 | 12% | 151 | 20 | 13% | 1136 | 1816 | |
| TP (tons) | 2005 | 55 | 39 | 72% | 73 | 8 | 11% | 26 | 1 | 5% | (198 ± 198) | (352 ± 198) |
| 2006 | 43 | 24 | 55% | 35 | 7 | 20% | 21 | 1 | 7% | 263 | 362 |
The total annual discharge of suspended matter into the Berre Lagoon was variable: it was 58,000 tons in 2005 and 81,000 tons in 2006.The power plant has a limit of 60,000 tons per year. This quota was respected as the plant channel contributed ∼42,500 tons of SM per year, representing 52 to 73% of the global SM inputs. The Arc is the most important natural SM conveyor: it contributed 17% and 38% of the annual total SM discharge, in 2005 and 2006, respectively. Moreover, this high natural input was almost entirely brought down during flood events. As previously observed, SM discharge mainly occurs during high water flow, flood events representing on average 95%, 80% and 35% of the annual SM inputs in the Arc, the Cadière and the Touloubre, respectively (Table 2). These massive sediment fluxes occurred over 30 days (i.e. 8% of the year).
Mean global annual N-NO3 input is estimated at 580 tons, half of which was being contributed by the plant channel waters (Table 2). The global annual P-PO4 input was estimated to be between 50 (in 2006) and 85 tons (2005), half of which was being carried by the plant channel (N and P discharges of the power plant were calculated from the mean concentrations of 2005 – cf. §2 – and are indicated in brackets in Tables 2 and 3). The remaining 50% is carried by the rivers that play an important part in the nutrient enrichment of the lagoon, despite their limited flow. Moreover, discharge by flood events represents an average of 33%, 11%, and 15% of the annual N-NO3 discharge for the Arc, the Touloubre, and the Cadière, respectively. In terms of annual P-PO4 discharge, 30 days of flood (8% of time) contributed an average of 44.5%, 7.5%, and 10% of the Arc, the Touloubre, and the Cadière, respectively. Taking into account flood events is essential for the assessment of nutrient discharges of the Arc, but is not significant for nutrient discharge assessments for the Touloubre and the Cadière Rivers.
Summary of historical annual discharges of freshwater, nitrate, nitrite, and phosphate in the Berre Lagoon
Tableau 3 Apports annuels en eau douce, nitrate, nitrite et phosphate à l’étang de Berre
| Arc | Touloubre | Plant channel | |||
| Water (.106 m3) | [15] | 1966 | 1905 | ||
| [15] | 1967 | 1430 | |||
| [15] | 1968 | 2690 | |||
| [15] | 1969 | 65 | 26 | 3922 | |
| [26] | 1977 | 470 | 190 | 6300 | |
| [1] | 1985 | 88 | 88 | 3950 | |
| this study | 2005 | 39 | 74 | 660 | |
| this study | 2006 | 52 | 77 | 713 | |
| N-NO3 (tons) | [15] | 1966 | 840 | ||
| [15] | 1967 | 628 | |||
| [15] | 1968 | 1187 | |||
| [15] | 1969 | 1729 | |||
| [11] | 1977 | 1450 | 260 | 2800 | |
| [1] | 1985 | 415 | 260 | 1739 | |
| this study | 2005 | 95 | 147 | (264 ± 66) | |
| this study | 2006 | 137 | 102 | 346 | |
| N-NO2 (tons) | [12] | 1977 | 72 | 13 | 27 |
| [1] | 1985 | 20 | 11 | 44 | |
| this study | 2005 | 2 | 5 | (26 ± 26) | |
| this study | 2006 | 5 | 6 | 7 | |
| P-PO4 (tons) | [15] | 1966 | 147 | ||
| [15] | 1967 | 110 | |||
| [15] | 1968 | 208 | |||
| [15] | 1969 | 16 | 6 | 303 | |
| [26] | 1977 | 200 | 35 | 110 | |
| [1] | 1985 | 114 | 56 | 87 | |
| this study | 2005 | 9 | 26 | (40 ± 33) | |
| this study | 2006 | 8 | 10 | 24 |
The main input of total nitrogen and total phosphorus came from the plant waters, even though the mean concentrations were lower than those of the rivers. An average total quantity of 1700 tons of TN and 360 tons of TP per year were estimated to enter the lagoon during the study. The plant was responsible of 60% and 65% of this, respectively. The rivers are not a negligible source. Moreover, over their annual budget, TN discharge during flood events (i.e. 8% of time in a year) represents an average of 40.5%, 13% and 11% of the TN annual discharge of the Arc, the Touloubre and the Cadière, respectively. Concerning TP, flood events represent an average of 63.5%, 15.5% and 6% of the annual TP discharge by these same rivers. Taking into account flood events is essential for the assessment of total matter discharges of the Arc. Contribution of floods in the Touloubre and in the Cadière is less significant.
3.4.2 Seasonal budget
Power plant inputs into the lagoon are not constant throughout the year: they are dependent on electricity requirements and water demands from the plant's channel for neighbouring irrigation. Two periods were generally observed during the year: the ‘cold season’, from October to March, was characterized by maximum plant activity. From April to September, the ‘warm season’ was marked by an ‘idle’ summer stage. During the study, 72% (2005) and 56% (2006) of total water inflow occurred during the ‘cold season’, mainly by the plant channel (85% to 90%). During the ‘warm season’, freshwater discharge was reduced, corresponding to the power plant's idleness and dry rivers, but the plant inputs were still the major contributors (67% in 2005, 81% in 2006).
The lagoon received 53 and 73% of the total annual SM discharge during the ‘cold season’ in 2005 and 2006, respectively. In 2005, the power plant mainly controlled the seasonal SM discharges (88% and 54% during the cold and warm seasons, respectively). In 2006, half of the SM discharge during the ‘cold season’ was carried by the Arc. The implication of this river in the seasonal budget was related to flood events that contributed 99.8% of the Arc's seasonal discharge over 20 days (thus in 11% of the period).
During the ‘cold season’, on average 64%, 68% and 55% of the annual global inputs of nitrate, nitrite, and phosphate, respectively, entered the lagoon. The plant channel is responsible for 54 to 60% of the global seasonal input of nitrate and 56 to 65% of the total seasonal input of phosphate. On the contrary, during the ‘warm season’, the rivers were the main nutrient sources, carrying 43 to 70% of the nitrate and 63 to 75% of the phosphate.
Total matter (TN and TP) discharge into the lagoon mainly occurred during the ‘cold season’: a mean of 65 and 57% of global annual inputs reached the lagoon during this period in 2005 and 2006, respectively. The implication of the tributaries in the seasonal total discharge shows seasonal and interannual variabilities. In 2005, the main conveyor of total matter during the ‘cold season’ was the plant channel: it was responsible for 70% of the seasonal inputs. On the contrary, during the ‘warm season’, the rivers were the main conveyors of total matter: they were responsible for 63% of the seasonal inputs. In 2006, the plant channel was the main conveyor of total matter during both seasons (66 and 72% of total matter inputs during ‘cold’ and ‘warm’ seasons, respectively).
4 Discussion and conclusion
This study aimed at establishing a budget for matter entering the Berre Lagoon using high-frequency sampling adapted to river-flood events.
The annual mean river water flows, measured in 2005 and 2006 (1.44, 2.39, and 0.52 m3 s−1 in the Arc, the Touloubre and the Cadière, respectively) were lower than the values proposed by the DIREN PACA (www.hydro.eaufrance.fr): they determined a mean of 3.41 m3 s−1 in the Arc for the period 1971–2006, and a mean of 0.78 m3 s−1 in the Cadière for the period 1984–2006. These results highlight the consequences of the dryness observed during these years, in the South of France. This work was thus carried out in a special context where water discharge restrictions applied to the power plant and river flow were affected by a dry period. We can hypothesize that this dry period also affects the detoured Durance River that feeds the plant canal (Fig. 1). Moreover, freshwater is taken from the plant canal for irrigation by neighbouring farmland. These two combined latter phenomena could help the plant manager to respect freshwater discharge quotas.
Flood events in rivers remain short and violent events. Currently named ‘flash floods’ in the Mediterranean context, they represent the main factor of hydrosedimentary activity of the three rivers. The main annual freshwater and SM discharges occur during these events, inducing great interannual variation of SM discharge and representing a great temporal instability factor for the lagoon. Interannual variability of SM fluxes is related to the significance of floods in the budget and to their random occurrence.
We estimated specific SM discharge at 14 to 42 t km−2 yr−1 in the Arc. In the Touloubre and the Cadière, we determined a mean of 14 and 16 t km−2 yr−1, respectively. Depending on the number of flood events, the Arc can be close to the average values for sediment yields in Europe, ranging from 30 [5] to 88 t km−2 yr−1 [13]. The three rivers monitored in this study show a specific SM discharge value, which was lower than the large-scale estimate of 100 to 200 tons km−2 yr−1 described by Walling and Webb [30,31] for the Mediterranean basins of the Iberian Peninsula. In the Touloubre and the Cadière Rivers, this could be explained by artificial flows and banks.
The highest nutrient concentrations are found in the Cadière: this could be due to the intense anthropisation of its catchment basin. Nutrient concentrations in the plant channel waters are the lowest values due to their mountainous origin and to the artificial ‘river’ bed once in the plant channel. Comparing nutrient concentrations to those measured twenty years ago [1], we noted that nitrate concentrations significantly decreased in the rivers (the Arc and the Touloubre), whereas phosphate also significantly decreased in the Arc (Table 1). This observation can be related to the progressive sewage treatment conforming to European standards throughout the entire catchment basin of the Berre Lagoon. No historical data are published for the Cadière River.
High-frequency monitoring of floods did not enable us to establish relationships between river flow and nutrients concentrations, because of the high complexity of the catchment basins (lithology, vegetation cover, soil occupation, sewage treatment) and climatic variables (rain depth, aridity). Tournoud et al. [27] also discuss the antecedent 30-day cumulative rainfall factor in small Mediterranean rivers. Changes in nutrients concentration during floods are not significant compared to variations observed during the year in ‘non-flood’ periods. Nutrients and total matter discharges during flood events have to be considered in assessing annual inputs from the Arc into the lagoon. In the Touloubre and the Cadière, floods are less or not significant in the annual budget, in relation to artificial flow (high-flow events are not necessarily considered as flood) and to high concentrations of nutrients during ‘non-flood’ periods (due to punctual pollutions).
In a global matter budget, the plant channel is the main tributary of the Berre Lagoon, contributing 83% of the 824 × 106 m3 of freshwater input per year. In the case of suspended matter, the power plant at least doubles natural SM annual discharge. The rivers, despite their low flow, contribute significantly to N and P inputs (close to 50%), and particularly inorganic forms that can be directly assimilated by phytoplankton, once in the lagoon.
It can be noted that matter inputs into the lagoon were significantly reduced by comparison to historical data (Table 3): 2005 and 2006 present the lowest freshwater discharge by the power plant ever observed since the beginning of its functioning. Unrestricted annual discharge of freshwater in 1977 could reach nine times the values observed in this study; thus, nitrate discharge was much higher than those measured in this study are proportionally to water volume, because of the great stability of nitrate concentration in plant channel through decades. In the Touloubre River, 20 years ago, for a similar water volume brought to the lagoon, annual inputs of nitrate were up to 2.5 times higher, and annual inputs of phosphate were up to six times higher than those measured in this study are (Table 3). The Arc brought close to twice the present freshwater volume to the lagoon 20 years ago. Nitrate and phosphate discharge were up to 3.5 times and 25 times more important than the one measured in this study, respectively. Thus, progressive restrictions of N and P discharge in catchments basins, and restrictions of freshwater discharge by the power plant, led to a global decrease of nutrient input into the lagoon.
The largest water, SM, and nutrient inputs are observed during the ‘cold season’ (October to March), associated with intense power plant activity. During spring and summer (‘warm season’: April to September), the Berre Lagoon is fed by lower N and P inputs, which can be mainly brought from the rivers.
These results highlight the fact that the sampling used in this study, adapted to flow rates in the small rivers, is needed in order to estimate reliable SM and nutrients inputs to the Berre Lagoon. Seasonal and interannual variabilities, punctuated with ‘pulse inputs’, induce sudden fluctuations of the hydrological characteristics of the Berre Lagoon, without any predefined regularity. Sampling on the plant channel started only in April 2005, and the number of samples collected was less important than those in the rivers are. Actually, this study focussed on SM and nutrient rivers’ discharges into the lagoon, taking into account flow rate. Thus, by comparison to the height of accuracy and frequency of rivers monitoring, a similar accurate high-frequency study on the power plant is now required to confirm its part of implication in the Berre Lagoon.
These results are available for ecological modelling of the Berre Lagoon.
Acknowledgements
The authors would like to thank Raphaël Grisel, for sampling and for equipment maintenance, and Frédéric Cerutti for his help in water analysis. This work was funded by GIPREB (‘Groupement d’intérêt public pour la réhabilitation de l’étang de Berre’). E. Gouze also thanks the ‘Région Provence – Alpes – Côte d’Azur and GIPREB for Ph.D. funding, and two anonymous reviewers for their helpful comments on the manuscript.