

1 Introduction
Morphologically, the Quaternary terraces in the area of Nice consist of eight stepped levels, over a height of 100 m. This morphology is the result of a tectonic uplift of the coast, combined with glacioeustatic Quaternary changes in sea level. Each terrace level corresponds to an interglacial highstand in sea level and each thus-determined, perfectly horizontal line may serve as a morphological guide-mark in order to detect deformations of the coast.
In the Nice area where active seismicity and neotectonics are well documented [12], we focused more specifically on a survey of the lower, most recent, terrace with the aim of detecting and quantifying all possible deformations. This has entailed focusing on the longest profile of the lower terrace along the coast, starting from the autochtonous Provencal foreland, west of Nice, and running eastward in front of the overthrusting Nice Alpine Range (Fig. 1). In practice, the new dates obtained west of Nice are compared with earlier palaeontological data obtained from further east, in an attempt to connect the lower terraces of the two sectors.

Geomorphological and structural framework of the southern Alps and Riviera between Antibes and Vintimiglia. Relative Tyrrhenian sea level values (e) are explained in the text. The structural features of the Var Basin are from Dubar and Guglielmi [11]. SBAN F.: Saint-Blaise–Aspremont–Nice Fault; BSM F.: Breuil–Sospel–Monaco Fault.
Schéma géomorphologique et structural des Alpes-Maritimes entre Antibes et Vintimille. Les valeurs du niveau marin relatif (e) sont expliquées dans le texte. Les structures tectoniques du bassin du Var sont extraites de Dubar et Guglielmi[11]. SBAN F. : accident Saint-Blaise–Aspremont–Nice ; BSM F. : accident Breuil–Sospel–Monaco.
2 The Tyrrhenian terrace: context and previous work
The eight Quaternary terraces are stepped below the Pliocene delta of the River Var [18]. The highest (and oldest), around 110 m a.s.l., was dated by a foraminiferal assemblage to the Calabrian period (1.7–1.4 Ma). The lowest should be dated to the last highstand (MIS 5) and the presence of Strombus bubonius links it to the Tyrrhenian stage [20]. However, this species is not common to the west of Nice; it was found at only one spot [21]. Thus the lower marine terrace remains to this day badly dated. More recently [10], we have pointed out the presence of a typical forest malacofauna in the dune deposits of this lower terrace. This land snail assemblage includes several extinct or exotic species living today in warmer conditions. Detailed malacological stratigraphic analysis emphasises a climatic evolution of clear interglacial type, correlated with stage 5 of the western Mediterranean basin. In the Nice area and on the French Riviera, this terrestrial fauna was encountered only on the lower terrace and is thus a good marker, as is S. bubonius in purely marine deposits. In view of recent improvements in radiometric technology and methods, we have attempted to date this malacofauna and thus verify the above results.
3 Method to determine ancient sea levels
In order to relate the ancient sea level to the sediments under examination, specific sedimentological or geomorphological markers known from present beaches or nearshore profiles of the region were made use of. Present profiles were recorded at various points according to the nature of the substratum and to the morphology of the coast.
Past relative sea level is shown through some sedimentological indicators by comparing them with present beaches or nearshore profiles. Profiles were chosen from different sectors according to geomorphological features of the coast. This is made possible because the configuration of the littoral has not really changed since the last interglacial highstand, sedimentary dynamics being similar.
The above-mentionned heights take into account the mean value of tide, that is 30 cm in this part of the Mediterranean Basin.
West of Nice, the littoral is sandy-gravelly with shallow beach-profiles, poor in sediment. From nearshore to backshore, the sequence layers is as followed: sand or terrigenous sand, gravels calibrated around 1.25 mm and flattened pebbles. The limit between sand and gravels is located around −1.5 m [27]. The transition from gravels to flat pebbles takes place between the hydrographic zero and +1 m. Behind the berm, crest and other scarps, pebbles form a barrier which reaches up to an altitude of 3 m, regardless of the length and slope of the barrier [2].
East of Nice, the rocky and scarped coast accomodates only small beaches. Profiles are short and steep, and reach down submarine steps in a still wave-dominated environment. Sands are abundant only in sectors where fluvial supplies from Tertiary basins are important, as in the Bays of Menton or Vintimiglia. Generally, beaches are skeletal and consist solely of blocks. Storms frequently perturb the beach system and determine the formation of shingle bars, several metres above sea level, but these do not last and are dismantled. Thus, the normal backshore lies generally between 2.5 and 3 m above the present sea level. Along limestone cliffs corbellings often exist marking the higher action of the waves. These corbellings are located up to 2.5 m above the mean sea level, the value of the eastern swell dominant in the Ligurian sea [27]
Of course, these elements organised according to their profiles may exhibit some perturbations depending on waves and currents: infratidal sands, backswash gravels and surf pebbles may mix. In that case, the error bar on sea level will be increased (3 + 1.5 = 4.5 m for the maximum). In the best of cases, the error bar will be reduced to the strict extension margin of the observed element.
4 Sites studied for dating and geomorphological setting of the low marine terrace, west of Nice
From Antibes to Nice, Quaternary marine terraces broadly expand according to the width of the coastal plain. The Pliocene delta deposits of the Var Basin have embedded themselves into Provence Mezozoic limestones. Although this is a low-flat shore, as one approaches the Alpine reliefs, one observes a progressive increase in topography. The lower terrace, which is a few metres above the coastal plain, can be closely observed along the coast, west and east of the mouth of the Var. Both sites studied belong to each of these sectors.
Measurements of altitude were taken with an electronic altimeters (accuracy: 0.50 m) calibrated on the hydrographic zero.
4.1 Les Amandiers (Cros-de-Cagnes; x = 7°09′18″, y = 43°39′31″, z = 10 m)
West of the mouth of the Var river, the lower terrace is represented by wide benches located around 10 m in altitude (Fig. 1). Near Cros-de-Cagnes a cross-section shows marine gravels of the nearshore facies (Table 1) situated at 10 m a.s.l. which indicate sea level between 9 and 11.5 m (10.25 ± 1.25 m). Marine deposits are associated with strong lagunal clays and dune sands which lay backbeach. Further inland, on the first slopes, they interstratify with palaeosoils. These deposits contain rich landsnail malacofauna with Retinella herculeus and other species of the Tyrrhenian “Ligurian fauna” [10].
Estimation of the altimetric distribution of beach sediments at present
Distribution altimétrique des sédiments de plage actuels
| Sedimentary facies | West of Nice | East of Nice |
| Sand | < −1.5 m | – |
| Gravels | −1.5 à +1 m | – |
| Pebbles | +1 à +3 m | – |
| Mixed | – | Infralittoral −10 m to +3 m |
4.2 Les Bosquets (Nice; x = 7°13′48″, y = 43°40′57″, z = 16 m)
East of the mouth of the Var river, the lower marine terrace forms a straight bench along the littoral (Fig. 1). Marine sands and gravels deposits are exposed between 13 and 16 m in altitude, 6° south. These deposits are typical of the swash zone, very close to zero in sea level. By using the present beach parameters (Table 1), we can judge the past sea level to have been between 13 and 15 m (14 ± 1 m) in altitude. Some shells of Ostreidae have been collected in these deposits. A cross-section perpendicular to the shore evidences landward lagunal and dune deposits and a forest palaeosoil which provided various examples of vertebrate fauna and the so-called “Ligurian landsnail fauna”.
These new data on the lower terrace in this sector corroborate local ancient observations [6] of Tyrrhenian pebbles and blocks and fauna deposits around 11 m in altitude. Nevertheless, the exact position of the sea level cannot be restored.
West of Les Bosquets, near the Saint-Augustin railway station, a pebble bench lying around 15 m a.s.l. is another marker for the Tyrrhenian terrace.
Both sites were dated on the basis of shells.
5 U/Th dating
5.1 Analytical techniques
U-Th analyses have been carried out on four total shells of R. herculeus from Cros-de-Cagnes, and on six fragments of a single valve of O. lamellosa from the Les Bosquets site. Procedures of cleaning and of U-Th chemical separation have been described by Innocent et al. [17].
U and Th were measured on a MC-ICP-MS “Neptune” mass spectrometer equipped with an “Apex®” desolvator and an ion counter coupled with an “RPQ” filter. Samples were corrected, using the standard bracketing method, for a global measurement bias factor encompassing the mass fractionation and the yield of the ion counter. Such correction allows one to dispose of sharp variations of the yield that may occur between the time of external calibration and the time of sample measurement [16]. Ion beams measured by the ion counter ranged as possible between 1 and 4 × 10⁴ coups per second.
For U, the certified reference material (CRM) U010 standard was used. Two hundred and thirty-five and 238 peaks were measured on a Faraday cup, and 234 on the ion counter. For Th, the CRM IRMM 035 standard was used, plus two additional standard solutions that have been synthetized at BRGM Orléans: Th 103 and Th 104 [16]. Both solutions, though not certified as reference materials, have isotopic compositions that are closer than CRM IRMM 035 to those measured in the shells. Thus, CRM IRMM 035 was used in addition to Th 103 and Th 104 solutions for standard bracketing during analysis sequences. For U and Th concentration measurements, artificial isotopes (233U, 236U, 229Th) were all measured on a Faraday cup. In order to evaluate the Th mass fractionation sensu stricto and its drift through time, the Th 103 standard was measured at the beginning and at the end of each Th sequence, using a Th 103 solution sufficiently concentrated for 230Th to be measured on a Faraday cup.
Total blanks were lower than 70 pg for U and 200 pg for Th. Results are reported in Table 2.
Concentrations and activity ratios measured on Ostrea (Os) and Retinella (Sp) shells
Concentrations et rapports d’activité mesurés sur les coquilles d’Ostrea (Os) et Retinella (Sp)
| Sample | U (ppm) | Th (ppb) | (234U/238U) | (238U/232Th) | (230Th/232Th) | (230Th/238U) | (234U/232Th) | (230Th/234U) |
| Os 1 | 0.720 (03) | 1036 (2) | 1.1961 (23) | 2.162 (10) | 3.000 (12) | 1.3877 (83) | 2.586 (13) | 1.1602 (73) |
| Os 2 | 1.380 (03) | 866 (1) | 1.1797 (19) | 4.959 (14) | 6.399 (31) | 1.2905 (72) | 5.850 (19) | 1.0939 (64) |
| Os 3 | 2.774 (09) | 801 (5) | 1.1646 (46) | 10.783 (78) | 13.222 (57) | 1.2262 (103) | 12.557 (103) | 1.0529 (98) |
| Os 4 | 1.206 (07) | 513 (1) | 1.1893 (34) | 7.314 (41) | 9.389 (43) | 1.2836 (93) | 8.699 (55) | 1.0792 (84) |
| Os 5 | 1.930 (07) | 526 (1) | 1.1268 (23) | 11.431 (47) | 13.526 (53) | 1.1833 (68) | 12.880 (60) | 1.0501 (64) |
| Os 6 | 3.456 (11) | 317 (1) | 1.1233 (26) | 33.92 (14) | 39.27 (20) | 1.1577 (75) | 38.100 (177) | 1.0306 (71) |
| Sp 1 | 0.935 (02) | 136.0 (2) | 1.6273 (35) | 21.41 (07) | 27.29 (10) | 1.2749 (62) | 34.838 (131) | 0.7834 (42) |
| Sp 2 | 1.521 (03) | 50.1 (3) | 1.6127 (47) | 94.61 (55) | 147.27 (58) | 1.5566 (110) | 152.58 (1.00) | 0.9652 (74) |
| Sp 3 | 1.555 (06) | 57.4 (5) | 1.6264 (33) | 84.34 (81) | 104.30 (64) | 1.2367 (142) | 137.17 (1.35) | 0.7604 (88) |
| Sp 4 | 1.549 (07) | 99.1 (3) | 1.6088 (43) | 48.68 (25) | 59.39 (28) | 1.2200 (86) | 78.31 (46) | 0.7583 (57) |
5.2 Results and discussion
5.2.1 Retinella herculeus
Three of the four shells define straight lines on (238U/232Th) – (230Th/232Th) and (234U/232Th) – (230Th/232Th) diagrams [26] (Fig. 2). There is no clear explanation for the fact that the fourth point plots out of the lines. However, ages can still be calculated: 131 ± 8 ky derived from 238U and 132 ± 8 ky from 234U, using regression calculations after [23]. Alternatively, U-Th ages may be also derived from 238U-normalized isochrons [22,24].
“Rosholt” U-Th isochron diagrams for the four analyzed shells. The sample that plots out of the isochron is represented as a white disk. Linear regression calculations have been done after Minster et al. [23]. Uncertainties on the calculated ages have been further expanded by the square root of the MSWD and by the appropriate Student’s factor (2σ for three data) [22]. MSWD are of 14 for the “238” isochron and three for the “234” isochron.
Diagrammes isochrones U-Th au sens de Rosholt pour les quatre coquilles analysées. L’échantillon qui s’écarte de l’isochrone est représenté en blanc. Les calculs de régression linéaire ont été effectués d’après Minster et al.[23]. Les incertitudes sur les âges calculés ont été multipliées par la racine carrée du MSWD et par le facteur de Student approprié (2σ pour trois données)[22]. Les MSWD témoignant de la qualité des alignements sont de 14 pour l’isochrone « 238 » et de trois pour l’isochrone « 234 ». Masquer
Diagrammes isochrones U-Th au sens de Rosholt pour les quatre coquilles analysées. L’échantillon qui s’écarte de l’isochrone est représenté en blanc. Les calculs de régression linéaire ont été effectués d’après Minster et al.[23]. Les incertitudes sur les ... Lire la suite
Such calculations, derived from the Isoplot program [22] lead to an age that is similar to that found from 232Th-normalized isochrons, but with a higher uncertainty: 129 ± 30 ky.
Such a relatively high, though probably more reasonable uncertainty may be attributed to heterogeneities between the different shell samples, as indicated by the fact that one of the shells could not be taken into account for age calculations, resulting in a three-datapoint dating. The obtained age is supposed to date the end of the early U trapping, a few thousand years later than the death of the mollusc [14]. The shells could be thus a few ky older than the Eemian sensu stricto [28]. (234U/238U) are comparable from one shell to another (Table 2). The average initial recalculated ratio is 1.9, clearly higher than the seawater value [9]. This highly 234U-enriched uranium very probably indicates groundwater circulation [25].
5.2.2 Ostrea lamellosa
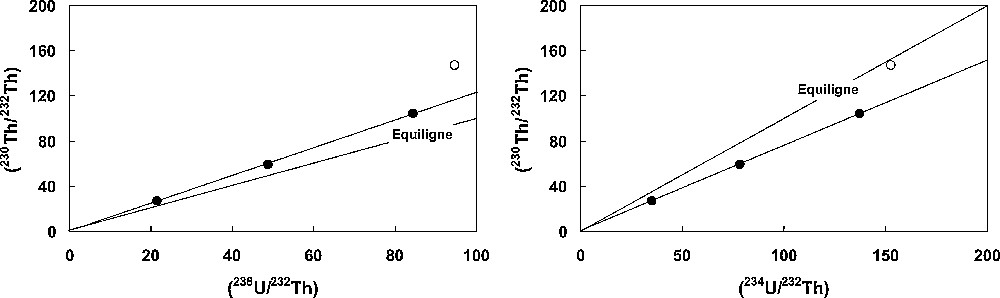
The six fragments, reported in the Rosholt isochron diagrams (Fig. 3, left panel) show alignments that, however, do not allow one to calculate any age, as the datapoints fall above the equiline in both diagrams. First of all, this shows that a U-series dating study has to involve preferably several single, complete gastropod shells rather than bivalves which seem definitely less reliable for such a type of study, in agreement with previously published works [7,14,19].

U-Th diagrams normalized to 232Th (left panel) and 238U (right panel). White disks: measured data; grey triangles: modelized initial points; black squares: present-day, modelized points. Model parameters are detailed in the text. Gain and/or loss percentages in U and/or Th are selected randomly by the computer between zero and the maximum gain and/or loss rate (see text). This open-system evolution tends to preserve the alignments in Rosholt isochron diagrams [15] (left panel).
Diagrammes U-Th normalisés à232Th (gauche) et238U (droite). Disques blancs : données mesurées ; triangles gris : points initiaux modélisés ; carrés noirs : points actuels modélisés. Les paramètres du modèle sont donnés dans le texte. Les termes de perte et gain en U et Th sont choisis aléatoirement par l’ordinateur entre zéro et le taux maximal de gain et de perte (voir texte). Ce modèle d’évolution en système ouvert tend à conserver les alignements dans les diagrammes isochrones au sens de Rosholt [15] (fig. de gauche). Masquer
Diagrammes U-Th normalisés à232Th (gauche) et238U (droite). Disques blancs : données mesurées ; triangles gris : points initiaux modélisés ; carrés noirs : points actuels modélisés. Les paramètres du modèle sont donnés dans le texte. Les ... Lire la suite
Based on the hypothesis that the bivalve and the gastropods are contemporaneous, a closed-system evolution for Ostrea, with an initial seawater-derived U, would result in a present-day (234U/238U) close to 1.1. As measured U activity ratios are largely higher, an initial uptake of 234-enriched U is required, with possibly an open-system evolution with a continuous uptake of such U, as can be suspected from the Rosholt isochron diagrams (Fig. 3).
An evolution model has been tentatively built, featuring a realistic set of parameters. The shell, containing initially some detrital U and Th, would have trapped marine uranium 130 ky ago. The typical contribution of the initial detrital component has been estimated at 7%, with a decay chain at secular equilibrium and an elemental Th/U ratio equal to the average upper continental crust (≈ 4). The seawater component is considered slightly “enriched” in 230Th: (230Th/232Th) = 1.15, with a (230Th/234U) ratio equal to 0.01 and a typical seawater value for (234U/238U) = 1.146. Then, 234U-enriched uranium would have been trapped, resulting from groundwater circulation, with a concomitant leaching of the U present in the shell. The groundwater component would display the same (230Th/234U) ratio (0.01) than the seawater component, but would be highly “enriched” in 230Th ([230Th/232Th] = 14), whereas its (234U/238U) ratio would be 1.4. This evolution model implies gain and/or loss percentages in U and/or Th (by thousand of years and relative to the total amount of element present at a given time) ranging from 0 to respectively 7.7‰ for U gain, 1.7% for U loss, and 0.77‰ for Th (there is no Th loss).
This model fits reasonably the data (Fig. 3) except for one point for which the initial detrital component was probably higher than for the five other points. Certainly, other parameters could be also compatible with the measured activity ratios. Nevertheless, it is worth noting that our data obtained on the bivalve shell remain compatible with a Tyrrhenian age.
5.2.3 Chronostratigraphical interpretation
Several geological and especially paleoclimatic arguments allow one to strengthen the validity of the obtained U-Th age:
- • the associated fauna is of interglacial type;
- • the last interglacial (MIS 5.5) is the major highstand episode contemporaneous to the dating interval – whatever its associated uncertainty – which resulted in the formation of a low terrace on most of the Mediterranean coastline;
- • the presence of only eight levels of Pleistocene terraces (from 1.4 My ago) in the Nice area suggests that only major events were recorded. This is certainly the case for the last interglacial (MIS 5.5) which would correspond to the most recent paleoclimatic event triggering the emplacement of a low terrace.
All these arguments are united to date the lower terrace of the Nice area to the MIS 5.5 (Tyrrhenian p.p.)
6 Local morphoneotectonic implications
A continuity is thus possible on a same profile between the Tyrrhenian deposits west of Nice to those to the east which provided S. bubonius. Such a profile, extends for close to 70 km on either side of the main structural zone which separates the Provence foreland from the Alpine range of Nice. Its morphology and tectonics are analysed for both sectors taking into account old and new data.
6.1 Morphology
The sectors situated on either side of Nice offer different morphological features: to the west, the littoral is low and flat along the Provence platform and Pliocene Var Basin; to the east, along the Alpine range, the coast is rocky, scarped and often bordered with calcareous cliffs.
In the first sector, terraces extend widely and exhibit a good continuity. Tyrrhenian deposits lie some 10 m west of the Var, around 16 m to the east of the river mouths. The Tyrrhenian sea level, restored using sedimentological criteria (Table 1), lies around 10 m (10.25 ± 1.25 m) a.s.l. to the west, and around 14 m (14 ± 1 m) to the east (§ 4 and Fig. 1).
In the second sector, the terraces which are preserved along the coast are reduced to patches of sediments, no more than a few m2 wide. Nevertheless, patches of Tyrrhenian age are numerous and rich in fossils including the typical species S. bubonius. Numerous radiometric datings were carried out earlier [29], but the results were partly controversial [13]. Most of the patches under consideration are submarine deposits and their bathymetry is not precisely defined. Thus, the exact position of the Tyrrhenian shoreline is still debated. By referring to reliable markers along the coast (beach sediments and wave notches), the Tyrrhenian shoreline seems to be situated around 20 m in altitude. This is true for “Puits Risso” on the Villefranche peninsula (Fig. 1), which provided a rich malacofauna including S. bubonius [6] with a restored sea level, taking into account the error bar (Table 1), between 17 and 20 m (18.5 ± 1.5 m). This position of the sea level is confirmed in the Prince’s cave: the Tyrrhenian series stretches from sands with S. bubonius around 12.50 m a.s.l. to a spectacular notch culminating at 22.70 m [1,3]. Thus the maximum reached in sea level is close to 20.20 m (estimating the mean sea level 2.50 m under the notch, according to modern observations, see §3). Along the coast, from Nice to Vintimiglia, the other deposits with S. bubonius (Fig. 1) around 10–12 m a.s.l. are shown to have been under sea level. Thus, the Tyrrhenian shoreline must be located around 20 m, maximum elevation of S. bubonius deposits. The error bar being 3 m (Table 1), we may specify that the relative Tyrrhenian sea level position was between 17 and 20 m in this sector.
6.2 Neotectonics
These data (Table 3) exhibit a progressive uplift from west to east that is consistent with ancient data [5], and correlated with tectonics. Today we may calibrate this uplift and analyse it according to data on major regional structures: to the west, the Var fault or rift, located under the Pliocene basin; to the east, the fault edges the Nice Alpine Range (St-Blaise–Aspremont–Nice Fault, SBAN Fault, Fig. 1).
Relative uplift of the faulted blocks along the coast near the Nice Alpine Range calculated since the MIS 5.5 (125 ka)
Soulèvement différentiel des compartiments du littoral séparés par des accidents à proximité de l’arc de Nice calculé depuis le stade isotopique 5,5 (125 ka)
| Involved structures | Uplift in metres maxi–mini | Annual bar rate in mm |
| Var Fault (“Accident du Var”) | (15–9) to (13–11.5) | 0.048–0.012 |
| Western border fault of the Nice range (SBAN Fault) | (20–13) to (17–15) | 0.056–0.016 |
The first fault determines an eastern uplift of the lower terrace from 1.5 to 6 m (Table 3), taking into account the error bars (Table 1). This difference in level may be compared with that separating the two banks of the lower River Var and affecting the Pliocene deposits [18] and all the Quaternary terraces [11,12]. This difference is related to a supposed rift called “Accident du Var” under the Pliocene basin or at least related to a nonhomogenous deformation of the basin, constrained by the adjacent active Alpine Range border (Fig. 1). The vertical throw seems to be at its maximum along a fault just situated in the axis of the present lower Var valley, this leading one to accept the reality of the “Accident du Var” (Fig. 1). The neotectonic activity is due to the uplift of the Alpine Nice Range which seems to be due to a blind overthrusting in the basement [4].
The second limit corresponds to the fault which edges the Nice Range (SBAN Fault, Fig. 1), separating it from the Pliocene Basin. The faulting was essentially a dextral strike slip with some additional vertical movement, that of the uplift of the Alpine Range.
The area on the eastern coast of Nice uplifted from 2 to 7 m (Table 3) related to the adjacent sector between the mouth of the Var river and the border of the Alpine Range. This uplift may be due to the vertical activity of the Saint-Blaise–Aspremont–Nice fault since MIS 5.5. Other more or less transverse faults which reached the coast, especially the big strike-slip BSM Fault, probably created a favourable context for the offsetting of coastal blocks during the Late Quaternary Age.
7 Regional implications and conclusion
The increased uplift of the coast along the overthrusting Nice Range is a neotectonical feature of regional importance. Indeed, it could be shown clearly by continuing the MIS 5.5 profile eastwards beyond the eastern limit of the Nice Range. This has been made possible thanks to a recent paper [13] on the neotectonics since MIS 5.5 of the Ligurian coast which corresponds to the eastern continuation of our area of study. The authors have shown a reduction in the rate of uplift over about 40 km (up to Taggia). We can thus build a complete profile (100 km) by adding to our altimetric data (No. 1, 2, 3, 4, Fig. 4) that of the cave of Barma Grande (No. 5, Fig. 4). Also, according to these authors, beyond Taggia (zone of the Flyschs), the tendency is reversed and the uplift increases again apparently continuously and homogeneously up to the Apennines Chain (up to 28 m a.s.l.). This result indicates recent neotectonic activity of the Apennines area of much greater importance than that of the Alps, and reflects, of course, the dissimilar implications of the two blocks in the dynamics of this part of the Mediterranean basin. The effect of this imbalance is an uplift of the littoral which is increasingly marked towards the East, conforming with the recent data on the Ligurian margin [8]. However, as regards the western subalpine zone of the Nice Arc, we show a considerable activity of partitioned uplift.

Reconstructed profile with error bar of the MIS 5.5 terrace from western Liguria, showing the uplift related to the Alpine Nice Range activity. 1: Amandiers (Cagnes-sur-Mer); 2: Bosquets (Nice); 3: Puits Risso (Villefranche); 4: Grotte du Prince (Vintimiglia); Barma Grande (Arma di Taggia) (1,2,3 & 4: our study); 5: after Federicci and Pappalardo [13].
Restitution avec sa marge d’erreur du profil de la basse terrasse (MIS 5.5) de la Ligurie occidentale montrant le soulèvement au droit de l’arc de Nice. 1 : Amandiers (Cagnes-sur-Mer) ; 2 : Bosquets (Nice) ; 3 : Puits Risso (Villefranche) ; 4 : Grotte du Prince (Vintimille) ; Barma Grande (Arma di Taggia) (1,2,3 et 4: notre étude) ; 5 : d’après Federicci et Pappalardo [13].
This heterogeneity of the uplift along the limits of the great lithostructures is a remarkable feature of this coast which could be detailed more precisely if new chronological data could be obtained, in particular for the MIS 5.5 terrace along the eastern Ligurian coast.
Acknowledgements
The authors thank C. Dauphin for editing in English, P. Ambert and the two anonymous referees for their expert comments.