

1 Introduction
Artificial recharge of aquifers is devised as a means to increase groundwater resources while regulating surface flow, providing underground storage of this water and avoiding its becoming lost in the sea or in salt depressions, or its evaporation in dams. A large number of water-table aquifers in coastal zones are being increasingly exploited and affected by a constantly growing human impact (Bouwer and Pyne, 2005; de Marsily, 2003; Fedrigoni et al., 2001; Kouzana et al., 2009). In fact, overexploitation of a coastal water-table aquifer can threaten the whole aquifer and deteriorate its hydrological and hydrochemical characteristics. Therefore, this technique can be used especially to preserve the water resources against marine intrusion and/or a pronounced fall in the piezometric level. Currently, the share of total withdrawn groundwater quantities attributed to overexploitation is considerable in several Mediterranean countries: 20% in Gaza, 32% in Israel, where the overexploitation is to a great extent compensated by artificial recharge (Aberbach and Sellinger, 1998), 8 to 10% in Tunisia, partially compensated by artificial recharge (Ministère de l’agriculture, Tunisia, 1996; Margat, 2004). The last is a pilot programme to mobilise resources; the aim is to store water from winter rains available in great quantity and to use it during the dry season (Asano and Cotruvo, 2004; Foster and Chilton, 2004). The objective here is to recreate, for the following year, a piezometric level that is higher than or equal to that of the previous year (Detay and Bersillon, 1996), but with a better quality. In general, surface water is introduced into the aquifer to avoid losing it (great losses occur by evaporation from lakes and silting-up of the big reservoirs) and to re-use it during droughts.
Techniques of artificial aquifer recharge have been used all over the world for over 200 years (Carling and Gustafsson, 1998). To protect against predicted water shortages in many arid and semiarid countries, artificial recharge objectives have been defined (Asano and Cotruvo, 2004; Bize et al., 1972; Bouwer and Pyne, 2005; Carling and Gustafsson, 1998; Detay and Bersillon, 1996; Díaz-Cruz et al., 2006; Grünheid et al., 2005; Kortelainen and Karhu, 2006; Pi and Wang, 2006; Rognon, 2000; Tagina, 2001; Topper et al., 2004). Artificial recharge is used in various countries and has given excellent results: in Belgium (Lebbe et al., 1995), Mexico (Portugal et al., 2006), Great-Britain (O'Shea et al., 1996), California (Tien-Chang et al., 1992), Germany (Seiler, 1996), Spain (Martinez-Santos et al., 2005), etc. Moreover, studies made in different regions have demonstrated the impact of irrigation on the recharge of aquifer systems (Böhlke et al., 2007; Calvache and Pulido Bosch, 1996; Carling and Gustafsson, 1998; Chowdary et al., 2003; Greskowiak et al., 2005; Kendy et al., 2003; Macpherson and Sophocleous, 2004; Ruud et al., 2004; Scanlon et al., 2005, 2006; Zammouri and Feki, 2005) and revealed a clear correlation between the fluctuations of the water-table and the recharge rate by irrigation return flow in various countries (China, Australia, USA, Niger, etc.).
Studies carried out in France in artificial recharge zones along the Seine River have also registered a total elimination of parasites between the raw water used for artificial recharge and the water in the aquifer (Detay and Bersillon, 1996). Kulkarni et al. (2003), describe a pilot recharge programme in India which has considerably improved the water quality in the aquifer where an irrigation well has become a source of drinking-water. Moreover, in Texas, a decrease in nitrate in the aquifer water has been recorded during artificial recharge operations (Alan et al., 2000).
In 2004, Masciopinto (2006), studied artificial recharge of a coastal aquifer in southern Italy where he showed that artificial recharge may stabilise the normal situation while improving exploitation. In fact, after seven years of recharge, he observed a linear increase in the piezometric head in addition to improvements in the chemical quality of the water. Moreover, after the recharge, the saltwater/freshwater interface had receded by 2 km.
In the last two decades, artificial recharge has even been used to inject treated wastewater from treatment plants into aquifers (Sheng, 2005). This is the case of the Cap Bon plant in Tunisia, where around one million metre cubes of treated water from Nabeul were injected into the aquifers from 1986 to 1996. In Morocco, this technique has been widely used for over 30 years and the results are excellent.
In Tunisia, artificial recharge of aquifers started at the beginning of the 1970s and from 2000 it has aimed at underground storage of the equivalent of 100 million metre cubes of surface water in aquifers at a dozen recharge sites (MEAT, 1997). One of the chosen sites is the Teboulba coastal aquifer, because of the length of its artificial recharge experience, the water resource problems in the region and the prevailing geological and hydrogeological conditions.
In common with most coastal aquifers, the Teboulba water-table aquifer suffers the deleterious effects of uncontrolled exploitation and a degradation of its water quality. It is a victim of the imbalance between recharge and intense exploitation, the extent of agricultural activity and the presence of highly soluble minerals in its rock formation. As it is part of the Tunisian Sahel, the Teboulba region has a semiarid climate with very irregular rainfall which makes the groundwater resources quite fragile. This region has major difficulties in managing its water resources which are in decline, especially since, for the last decades, their renewal by rainwater has no longer been sufficient to re-establish the equilibrium given the drier-than-average current climate conditions and recurring droughts. This study concerns the monitoring of the hydrogeological and hydrochemical parameters of the Teboulba aquifer during artificial recharge operations by water from the Nebhana dam.
2 Geology and hydrogeology
The Teboulba region is situated in the Monastir conurbation, some tens of kilometres to the southeast of the city (Fig. 1). This region has a semiarid to arid climate with mild, wet winters and dry, hot summers, a mean annual rainfall of the order of 375 mm and a mean annual temperature of about 20 °C. The studied sector of the region is part of the Sahelian watershed basin, built up on a low-lying coastal plain partly recovered from the sea. The monotonous topography and the geological cover, dominated by Quaternary formations, make it impossible to identify any hydrogeological basin structures. However, the depressions in the interior of the region and the wadis along the coastal zone help to identify the boundaries of more or less individual hydrological basins.
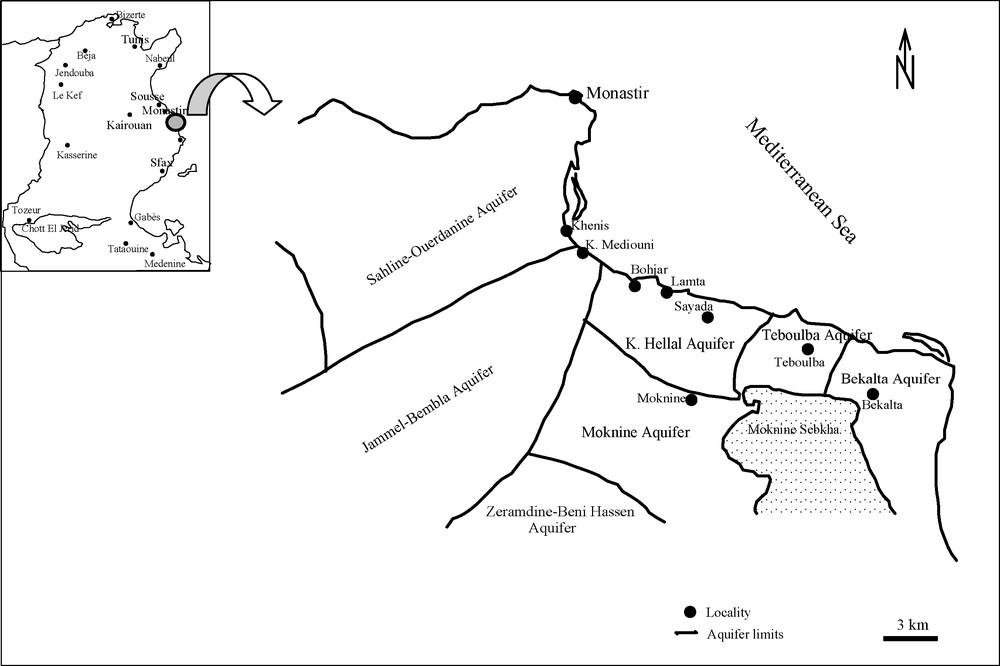
Location map of the study area.
Carte de localisation de la zone d’étude.
The study site is located on an alluvial plain whose geology is dominated by Quaternary deposits. The Teboulba area has relatively stable tectonics apparent in the tabular sedimentary structure. However, normal faults have clearly affected the structure of the deep layers. The Teboulba plateau, 10 km long and 4 km wide, plunges quite sharply towards the sea while a fairly gentle slope links it to the Moknine sebkha (a salt lake at the elevation of about 13 m below sea-level). It contains an alluvial water-table aquifer with lenticular geometry, short horizontal extent and irregular vertical continuity. There are also a few perched aquifers lodged inside the formation in silt-sand layers and lenses intercalated between clay and clay-sand strata. The substratum of the aquifer, consisting of an impervious Mio-Pliocene clay-marl layer, lies at a depth of over 90 m (Kraiem, 2002).
The Teboulba coastal aquifer is located in the sand-silt Plio-Quaternary formations, characterised by an effective porosity estimated at 7%, an average transmissivity of around 2 × 10⁻⁴ m2/s and a storage coefficient of the order of 3.5 × 10⁻². It is a vivid example of overexploitation. The flow in this aquifer takes several directions but converges generally on the exploitation zone (Fig. 2). The flow toward the sea and toward the Moknine sebkha, two natural outlets of the aquifer, is relatively weak due to the strong depression created by the heavy exploitation in the western part of the region. The hydraulic gradients are very variable depending on the lateral facies changes in the aquifer formation and the drawdown linked to the overexploitation. The aquifer is naturally recharged mainly by rainwater and, to a lesser degree, by domestic wastewater from infiltration pits and re-infiltration of some irrigation water. Discharge occurs mainly by pumping for agricultural purposes and into the sea and sebkha. Saltwater intrusion from the sea and/or from the sebkha may disturb the hydrodynamics of the aquifer. All these factors make the water balance of the aquifer extremely complex and its hydrodynamic equilibrium very fragile and, above all, highly variable.
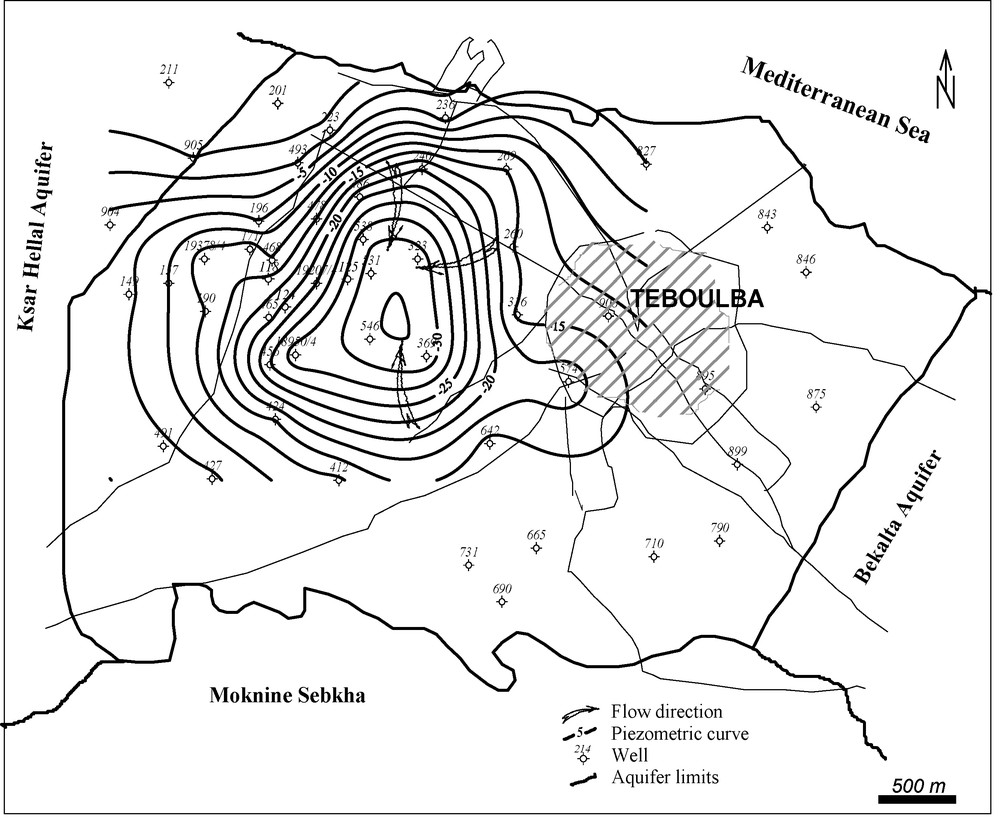
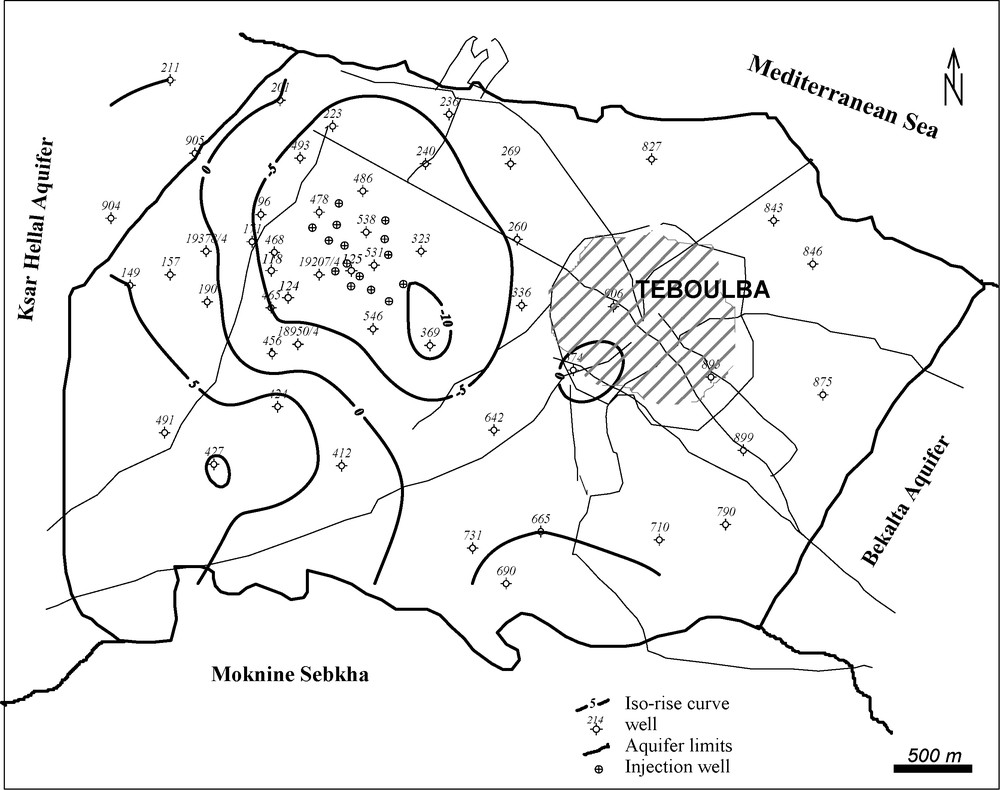
Piezometric map for 1971.
Carte piézométrique de 1971.
The mean rainfall recharge to the aquifer was estimated with an infiltration coefficient of rainfall of 5% determined by Kamenski's method applied to triple wells aligned along a flow line and monitored every month (aquifer recharge calculated from the rise in its level after a rain event).
The Teboulba aquifer covers a surface area of around 35 km2 and represents a hydrological recharge potential estimated, on average, at 0.65 Mm3/y with an exploited volume of 1 Mm3/y. This heavily negative budget (deficit of 0.35 Mm3/y) is compensated by reserves but, above all, by an inflow of saltwater from the sea and/or the sebkha and by return flow of irrigation water from the neighbouring regions, estimated at 0.53 Mm3/y (Beni-Akhy, 1998), only a part of which flows towards Teboulba. The overexploitation of the resources, begun hundreds of years ago and particularly intensified in the last decades, has caused a drawdown of the aquifer to an elevation below sea level (over −30 m at some points) in a zone that covers almost 12 km2. This depression has provoked an intrusion into the aquifer layers of saltwater from the sea in the north and from the sebkha in the south and, as a consequence, the water quality has deteriorated to the extent that in some areas, it can no longer be used for irrigation (Amri, 1992). Luckily, because of the weak permeability of the water-bearing layers, the saltwater intrusion has not progressed very far. The aquifer is exploited mainly by 806 surface wells, 465 of which are equipped with motor pumps enabling them to irrigate, by sprinklers, a surface area of about 200 ha. Note that this irrigation method reduces the water losses to a minimum.
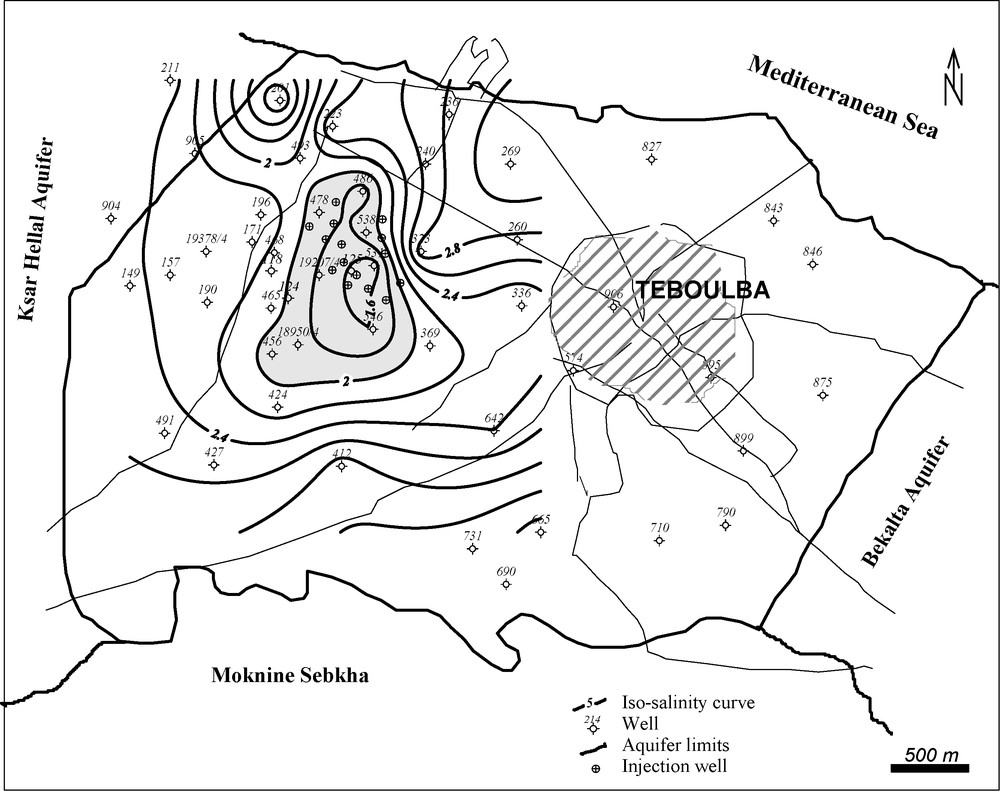
Furthermore, this aquifer is characterised by water with a fairly heavy load of salt. Its salinity may reach 4.5 g/l. The highest values have been recorded near the sea and the sebkha whereas the lowest (1.5 g/l) are found toward the centre of the aquifer (Fig. 3). The planned remedial action is to bring surface water from the overspill of the Nebhana dam and inject it into a few of the wells among the thousand existing ones.

Groundwater salinity map for 1971.
Carte de salinité de 1971.
3 Artificial recharge of the aquifer by water from the dam
Aside from all recharge operations, the piezometric level of the Teboulba aquifer shows a cycle of five phases over one year linked to the mode of cultivation at Teboulba (Amri, 1992; Arrondissement des Ressources en Eau de Monastir, 1973; Besbes, 1971). This piezometric cycle shows that the best times for measuring the water level is the beginning of March, for the wet period, and the end of July for the dry one. Moreover, as the irrigation network is used to recharge the Teboulba aquifer, the best time for the recharge is from November–December to March, corresponding to the first phase of the stationary piezometric cycle, since this period corresponds to an interruption in the irrigation of the end-of-season crops.
The planned experiment was conceived not only as a means of combating the saltwater intrusion, but especially as a potential storage in the aquifer depression of part of the excess water from the Nebhana dam. This dam, situated 47 km north-west of Kairouan, was built in 1966–1968 and started to operate in 1972. It was expected that there would be some mixing of the freshwater in the dam (0.95 g/l of salt) with the saltier groundwater at Teboulba, thus increasing the total volume of freshwater available for agriculture (Arrondissement des Ressources en Eau de Monastir, 1973).
The history of this operation goes back to the 1970s. It concerns the recharge of the aquifer via a connection to the main pipe of the irrigation network (Besbes, 1971; Maalel, 1998; Rekaya and Amri, 1992). As there was no excess water in the Nebhana dam because of the rainfall deficit during the period from 1978 to 1991, the recharge operation was interrupted at the end of 1978 and restarted in July 1992, lasting until 2000 (Fig. 4).

History of artificial recharge of the Teboulba aquifer.
Historique de la recharge artificielle de la nappe de Teboulba.
Preliminary experiments were carried out in 1971 for 128 days during which dam water was injected into four surface wells (diameter 1.2 to 1.7 m). The water used was initially not treated and cascaded freely into the wells from the soil surface, becoming aerated and thereby clogging the flow paths. For each well, the flow rate was measured by a meter and controlled by a valve; the injected volume was 186,000 m3 (i.e. close to 4 l/s per well). The aim of this operation was first to establish an order of magnitude for the infiltration capacity of each well. On the basis of these first results, and taking into account the hydrodynamic characteristics specific to the aquifer, given above, a simple mathematical finite-difference model was constructed to interpret the first 128-day experiment, in order to estimate by extrapolation the volume that would be necessary to replenish the aquifer. During this first period, the exploitation amounted to 78,000 m3, only 11,000 m3 of which were taken into account in the modelled zone because of the distance between the injection zone and the withdrawal points. In order to bring the piezometric level back up to sea-level, it was found necessary to inject a volume of around 7 Mm3. In case such a volume was not available, another scenario proposed, injecting the water into some 15 wells for five years, in the first year at a rate of 0.5 Mm3 during four months, then 0.25 Mm3 every following year to reach a maximum piezometric recovery of 25 m. The depression would not be entirely filled, but this method would prolong the life of the aquifer by around 40 years by decreasing the hydraulic gradients that caused the saltwater intrusion and diluting the aquifer water by less salty water, if the withdrawal rate remained at 1.1 Mm3/y. This simulation also showed that, for such a withdrawal rate, the aquifer would be permanently protected if it were artificially recharged by, on average, 0.5 Mm3/y and if 20 to 25 wells were equipped, assuming an annual rainfall of 375 mm with an infiltration coefficient of 5% (Arrondissement des Ressources en Eau de Monastir, 1973).
During the 1972–1978 period, a total volume of around 1.52 Mm3 was injected (i.e. on average 220,000 m3/y). Three-inch injection pipes penetrating the wells below the water level were used. At the same time, filters were fixed to the injection devices in order to reduce to a minimum the clogging by suspended matter contained in the dam water. Despite these precautionary measures, a clear decrease was noted in the absorbed flow rates and it seemed doubtful that it would be possible to inject more than 3 or 4 l/s into each well over the long term unless the water went through a complete treatment process. Moreover, the farmers were always reluctant to allow access to their wells for the recharge. In order to solve this problem, plots of land were acquired where injections could be made into deep trenches, but this technique was never implemented and the injection continued in wells.
Despite the considerable difference between the initial model predictions and the water volume really injected into the Teboulba aquifer, the results were quite noticeable. The piezometric depression cone disappeared to a great extent (Rekaya and Amri, 1992). Whereas the model predicted only a piezometric recovery to an elevation between −10 and −15 m, it actually reached −5 m and even, at some points, zero, despite the fact that the injected volume was less than a quarter of that used in the model. This made it possible to bring back into production a number of wells that had been dry for several years (Amri, 1992).
During the 1992–2000 phase of artificial recharge, a total volume of around 1.76 Mm3 of water was injected (i.e. on average 196,000 m3/y), always through wells.
In order to follow the variations in time and space of the aquifer piezometric level and salinity and to define the effect of the artificial recharge, series of measurements were made of the piezometric level of the aquifer as well as samplings of the water for physical and chemical analyses which made it possible to make rough draughts of piezometric and salinity maps.
4 Results and discussion
4.1 Hydrodynamic impact
The monitoring installation was composed of 22 surface wells exploiting the aquifer and three piezometers. The analysis of the piezometric level fluctuations versus time in the control wells indicated two distinct behaviours. The first one showed a rapid and continuous recovery of the water level in the wells close to the zone where the recharge was strong. The second one was the continuous decrease due to the exploitation of the aquifer by the surface wells. This can be explained by the great distance between the recharge zone and these wells and the weak natural recharge rate which does not compensate for the large quantities of water withdrawn by the farmers. Establishing the piezometric maps is sometimes made more difficult by the presence of small perched aquifers inside the weakly permeable lenticular formations.
4.1.1 First recharge phase (1972–1978)
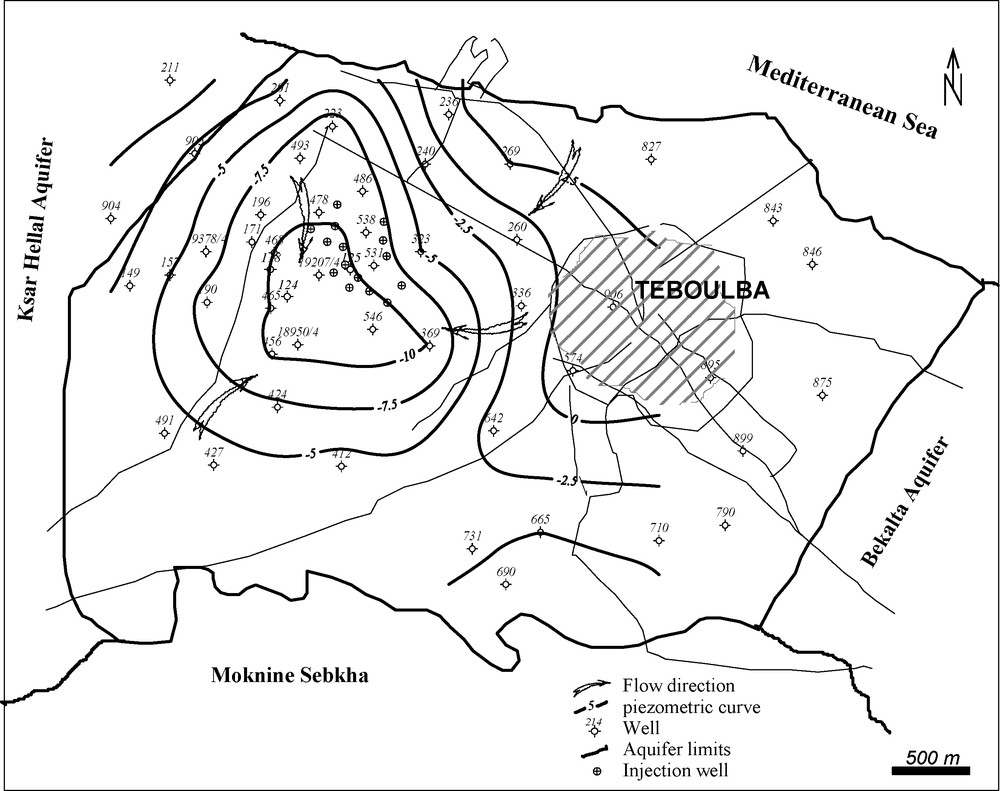
After injection of around 1.52 Mm3 of water (average 220,000 m3/y), the piezometric map of 1978 (Fig. 5) clearly shows the disappearance of the piezometric depression, revealed in 1971. Moreover, it shows the emergence of a hydrodynamic divergence zone to the west of the town of Teboulba but with a partial recovery of the hydrodynamic equilibrium of the aquifer in the recharge zone where the piezometric level exceeds 5 m. Note that the hydraulic gradient between wells 369 and 546 has increased. This may be explained by the high recharge rate (10 l/s for each injection well) and the weak permeability of the aquifer layer. This situation lasted until 1980 when the injection site still appeared as a high piezometric level zone in the aquifer albeit with a downstream propagation of the recharge wave (Amri, 1992).

Piezometric map for 1978.
Carte piézométrique de 1978.
The evolution of the piezometric level between 1971 and 1978 (Fig. 6) shows a general recovery that may exceed 30 m in the zone adjacent to the recharge site. The monitoring of the depth of the water-table shows a very significant increase since the beginning of the recharge. The response of the aquifer is expressed by an attenuation of the injection pulse and a regularisation of the effective water quantity that actually reaches the aquifer.
Map of piezometric evolution of the aquifer between 1971 and 1978.
Carte d’évolution de la piézométrie de la nappe entre 1971 et 1978.
The surface wells situated a few hundred meters from the irrigated perimeter showed only weak recovery. In the most exploited zones and those furthest away from the recharge zone, particularly in the western part of the region, a relatively large decrease of the aquifer level was recorded. An analysis of the map of the recovery during the first recharge phase led to an estimate of the water volume stored in the aquifer porosity of around 4 Mm3. Although a slight increase in exploitation was noticed because of the quality improvement due to the artificial recharge, this volume is much greater than that injected during the same period (1.52 Mm3), meaning that a large fraction of the aquifer water comes from other sources, e.g. pre-artificial recharge water, re-infiltration of the irrigation return water and domestic wastewater discharged in infiltration pits.
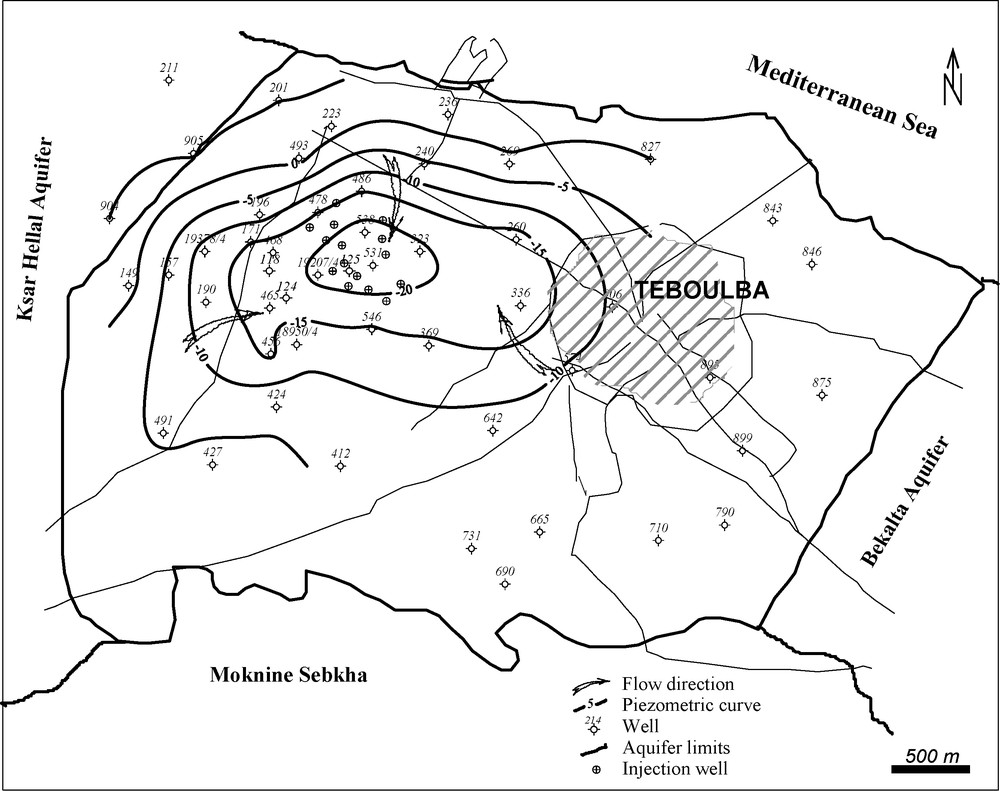
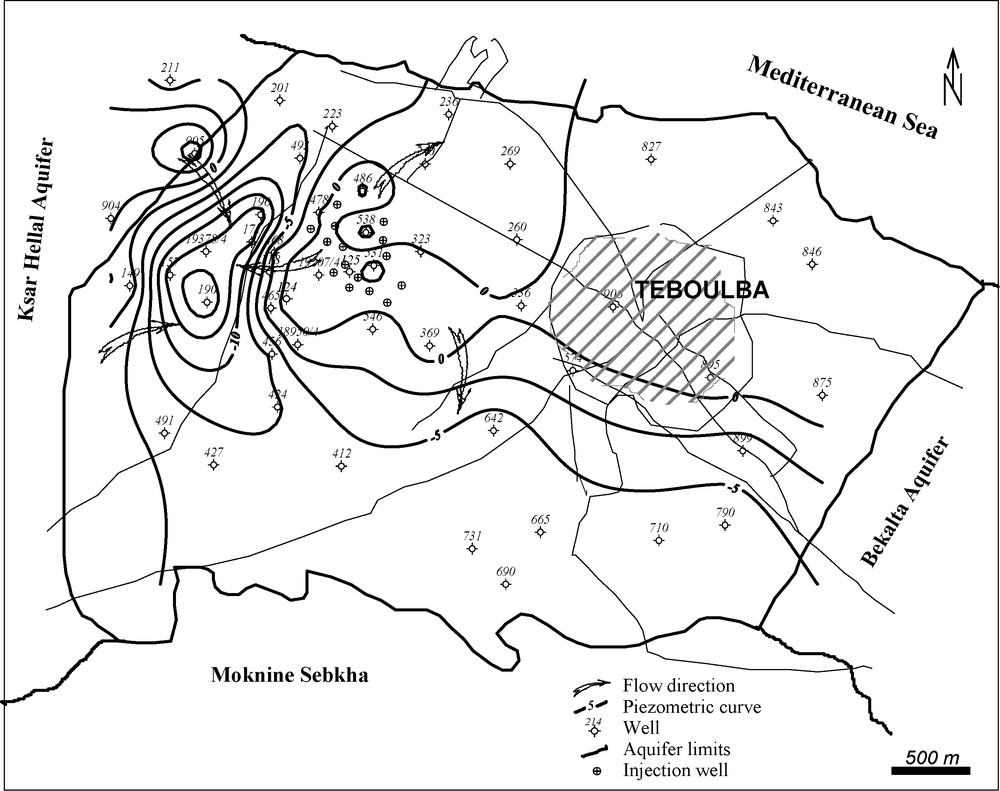
The cessation of artificial recharge after 1978 has caused a significant lowering of the aquifer piezometric level. The 1988 piezometric map (Fig. 7) reveals a depression to the west of the town of Teboulba which reaches 20 m below sea level. The hydraulic gradient is on the order of 16%, which demonstrates the weak permeability of the formation. This situation lasted until the beginning of 1992 and caused a general draw-down of the aquifer, in some places exceeding 10 m (Fig. 8).
Piezometric map for 1988.
Carte piézométrique de 1988.
Map of piezometric evolution of the aquifer between 1978 and 1992.
Carte d’évolution de la piézométrie de la nappe entre 1978 et 1992.
4.1.2 Second recharge phase (1992–2000)
During the second phase of artificial recharge, a total volume of around 1.76 Mm3 of water was injected (average 196,000 m3/y). Although the available volume of water in the dam varies from year to year, for every well, attempts were made to keep the injected volume at a fixed percentage of the annual natural recharge at the site. The second phase, begun with an injection of 120,000 m3, revealed some improvement in the reserves stored in the aquifer compared to 1988. The situation in 1992 (Fig. 9) showed some piezometric levels reaching −11 m (versus −22 m in 1988).
Piezometric map for 1992.
Carte piézométrique de 1992.
Due to the great rainfall deficit in 1994 and to the negligible replenishment of the Nebhana dam that year, the recharge in 1994 was reduced to 153,000 m3. For this reason, the exploitation wells were strongly affected and recorded a fall in the piezometric levels of up to 8 m compared to the situation in 1992, creating a new depression further west of the town of Teboulba (not shown). In fact, a concentric and convergent flow was detected in the direction of this piezometric depression. However, the injection zone had a fairly normal piezometric level with a general flow toward the sea in the north and toward the sebkha in the south. West of Teboulba, there is still a noticeable depression around wells No. 190, 196 and 456 which may be explained either by a very high withdrawal rate at this point or by a lack of influence of the artificial recharge in the zone.
In 1995 and 1996, the recharge was weak although water was available in the dam. Indeed, work being carried out on the old above-ground irrigation network to replace it by a buried one had hampered the recharge operations. The total injected volume was reduced to 67,000 and 97,000 m3, respectively. The mean absorption rate per well was low, estimated at 1.63 l/s. There was no artificial recharge in 1997 but the piezometric levels in the aquifer did not show any great decrease. There was a surplus of rainfall in the autumn of 1997 which contributed to the natural recharge of the aquifer and to fairly stable piezometric levels. The piezometric map for the year 1997 (not shown) shows the emergence of a flow toward the sebkha to the south. The depression is still present to the west of Teboulba. A few, highly localised, piezometric domes appear in the north-east of the urban area, in the far north-west (well No. 905) and in the vicinity of well No. 531 where the injection wells are concentrated.
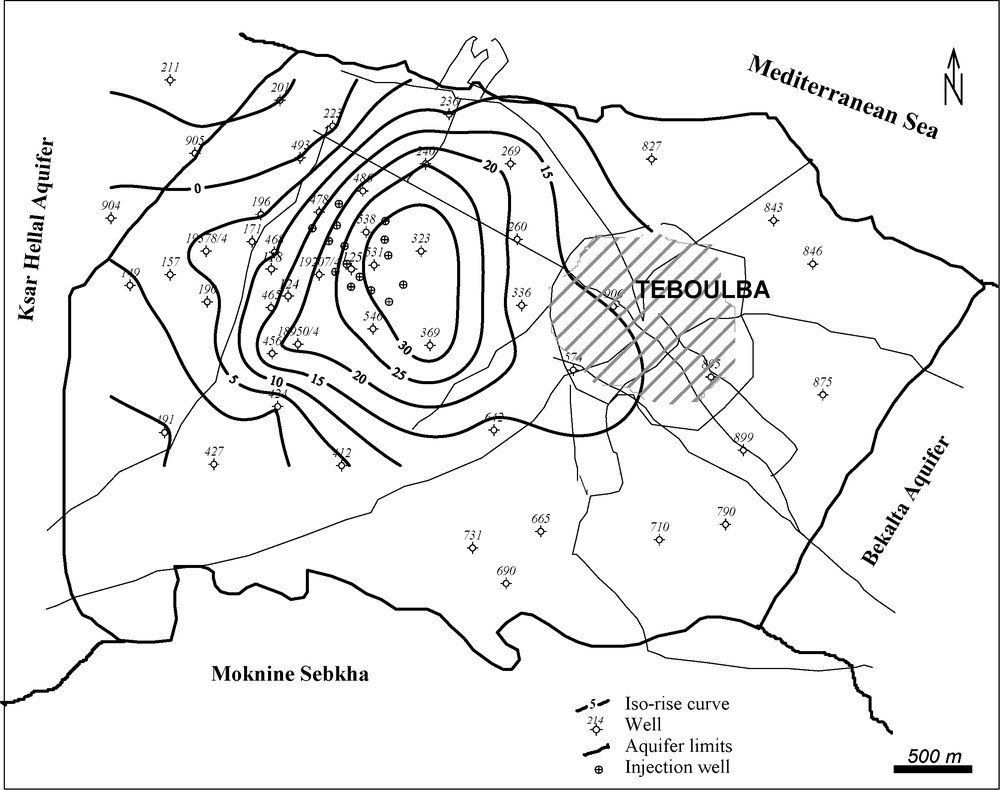
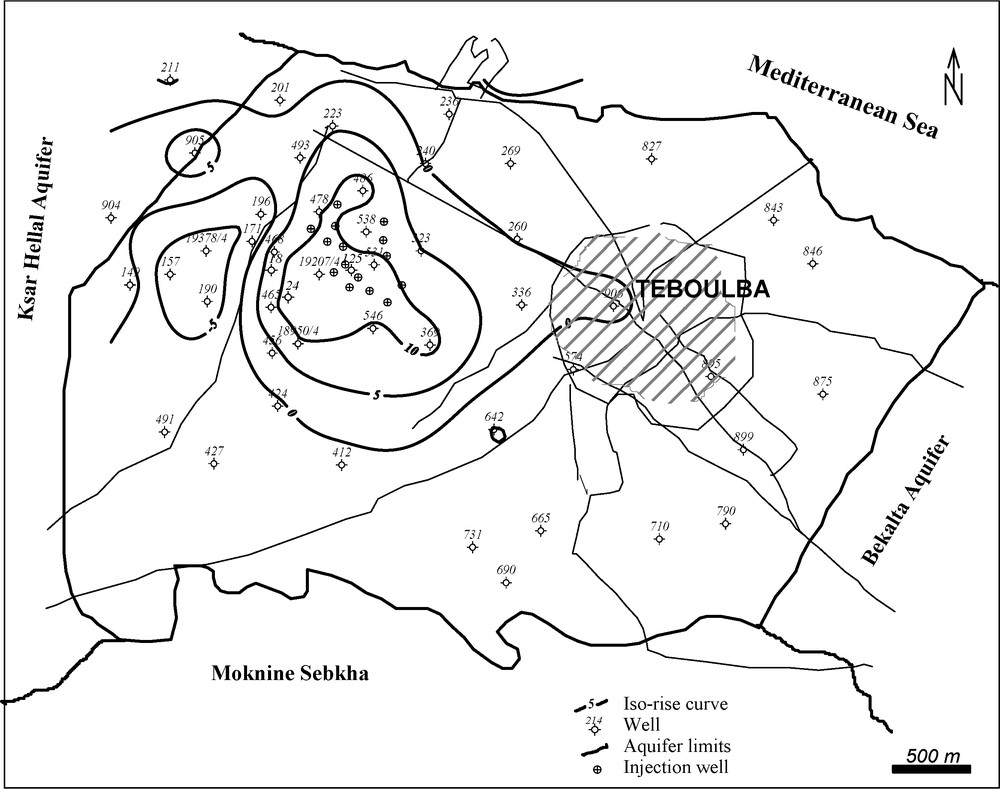
The artificial recharge could not be continued until April 1998, when the new irrigation network had been installed. Thus, with 19 injection wells and an overall instantaneous flow rate of 23 l/s, it was possible to increase the recharge rate of the aquifer. After intense artificial recharge from 1998 to 2000, an analysis of the piezometric situation of the aquifer, in 2000 (Fig. 10), further confirmed the existence of the localised domes, revealed in 1997, but definitely enhanced. The flow direction of the aquifer remained constant but still retained the depression in the western part of the aquifer, where the piezometric level reached –17 at well No. 190. Furthermore, the map shows a narrowing of the depression cone compared to earlier situations. This may be explained by the increase in the water volume injected into the wells in the neighbouring zones which exceeded 297,000 m3 in 2000. An analysis comparing the situations in 1992 and 2000 revealed that the water level had risen, sometimes by more than 13 m underneath the recharge site (Fig. 11), and that the aquifer had received around 1 Mm3. The difference between the injected volume and that stored in the aquifer porosity (0.76 Mm3) can be explained by the increase in the withdrawal rate which may have been as high as 1.5 Mm3/y instead of 1.1 Mm3/y. Note that the Teboulba aquifer is also recharged by infiltration return flow of treated wastewater used for irrigation. These irrigation volumes were 144,000 m3 in 1992, 114,000 in 1993 and 255,000 in 1994 (Beni-Akhy, 1998).
Piezometric map for 2000.
Carte piézométrique de 2000.
Map of piezometric evolution of the aquifer between 1992 and 2000.
Carte d’évolution de la piézométrie de la nappe entre 1992 et 2000.
Although the depression persisted in the western part of the Teboulba aquifer, the piezometric map for 2001 (not shown) shows a slight deepening of the depression cone compared to the situation in 2000. Moreover, the map reveals that the local piezometric domes mentioned in 2000 have disappeared. The reason is that there had been no recharge to the aquifer since the summer of 2000, which had lowered the water level by 1.2 m in the Teboulba region.
4.2 Hydrochemical impact
4.2.1 Situation before the artificial recharge
Hydrochemical studies carried out from 1940 to 1971 show that the salt content in the aquifer water follows the same pattern as the piezometric levels measured between 1940 and 1971. The salinity map for 1971 (Fig. 3) shows values higher than 4.3 g/l, a sign that the aquifer water was becoming brackish. The high salinity values observed in the North and South of the region are explained by the contamination of the aquifer by saline intrusion from the sea and sebkha. This hypothesis is supported by the high chloride contents and the presence of inverse cation-exchange reactions, which are characteristic of sea-and freshwater mixing movements (Kouzana et al., 2009; Pi and Wang, 2006; Seiler, 1996; Tagina, 2001; Pulido-Leboeuf et al., 2003; Sivan et al., 2005; Trabelsi et al., 2005). On the other hand, the freshwater (TDS between 0 and 1.5 g/l) is concentrated toward the central zone of the aquifer. The reason is that the effect of the saline intrusion remains low due to the weak permeability of the aquifer formations.
4.2.2 Situation after the artificial recharge
During the whole period from 1972 to 1993, a clear zonal distribution of the salinity was observed in the aquifer together with a persisting zone of weakly concentrated water (TDS lower than 1.5 g/l) localised on the coastal zone. Around this zone, the salinity increased sharply and exceeded 4.5 g/l in the vicinity of the sea and the sebkha (Amri, 1992). Because of a lack of available salinity data from the period of the first recharge phase, this study only examines the evolution of the aquifer water quality between 1994 and 2001. The salinity maps for the different states, based on electric conductivity data, clearly confirm the zonal distribution and the increasing salinity in the direction of the sea and the sebkha. The situation in 1994 (Fig. 12) shows quite low salinity values (lower than 2 g/l) in the western part of the aquifer, the zone of artificial recharge, whereas the highest ones are found especially in the coastal zones and at the boundaries of the sebkha where they exceeded 3 g/l.
Groundwater salinity map for 1994.
Carte de salinité de 1994.
Although the Teboulba aquifer was not recharged in 1997, the salinity variations of its water, recorded in the control wells, were not very significant, due to the great surplus of rainfall that year which contributed to the natural recharge of the aquifer, thus maintaining both the piezometric levels and the water quality. The salinity map for the year 2000 (Fig. 13) shows almost the same general pattern as that for 1994 with a slight salinity reduction toward the west of the aquifer: the zone characterised by a salinity lower than 2 g/l and situated near the recharge site becomes more extensive. This shows the influence of the mixing with less salty water from the Nebhana dam.
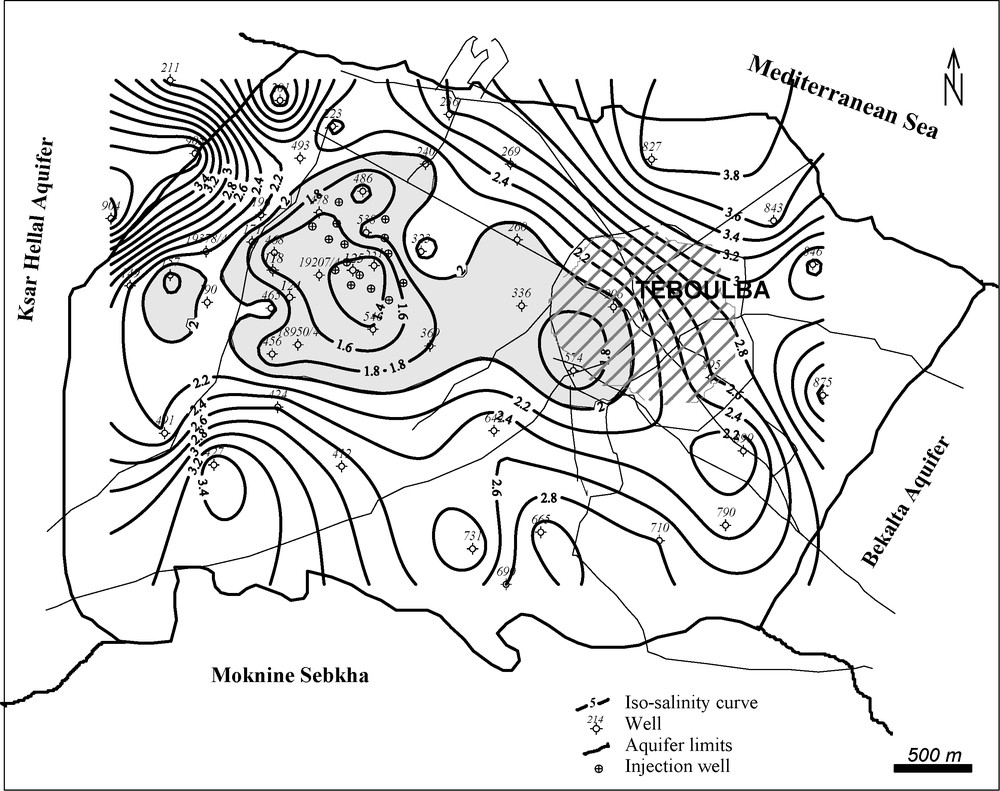
Groundwater salinity map for 2000.
Carte de salinité de 2000.
In 2001 there was no artificial recharge, which resulted in a degradation of the groundwater quality in the region. The 2001 salinity map (not shown) shows a shrinking of the less-than-2 g/l salinity zone and reveals saline intrusions especially in the northern and southern parts of the aquifer where the salinity exceeds 4 g/l. It is important to note that the salinity increase at the aquifer boundaries and the existence of the piezometric depression west of the town of Teboulba are directly related to the heavy exploitation, on the one hand, and to the very low volume of recharge water available that year, on the other. The continuity of the aquifer flow toward the depression and the disappearance of the local piezometric domes clearly confirm that the aquifer needs continuous recharge every year, if its status is to be maintained.
4.3 Social and economic impacts
The benefits from artificial recharge are economic, social and environmental. Over a 37-year period, with almost constant exploitation, the water artificially injected into the aquifer reached an overall volume of 3.3 Mm3, which was later used for irrigation. If one considers that the injected water represents a cost (supply, filtration, injection, etc.), the financial economies and the obtained advantages are enormous. Although it is very difficult to undertake an in-depth study of the effect of all the determining variables on the cost effectiveness of artificial recharge, we can affirm that whatever the uncertainty of the estimate, the total cost of recharged water, including all fixed and variable expenditures (price of the water, additional cost of supplying and injecting it, monitoring, maintaining the installations, etc.) varies between 0.028 and 0.095 Tunisian Dinars per metre cube (i.e. between 0.015 and 0.052 €) (Besbes, 2008). Note that in the total cost, the exploitation share is only 0.011 to 0.028 Tunisian Dinars per metre cube (0.006 to 0.015 €). Thus, the price of the recharged and re-pumped water remains much lower than the price paid by the farmers for the dam irrigation water (0.110 to 0.134 Tunisian Dinars per metre cube, i.e. 0.06 to 0.075 €/m3). This price should be compared to the cost of a metre cube of treated waste water or desalinised sea water (on the order of 0.2 to 0.7 €/m3). In the case of Teboulba, given that the same pipes are used as for the supply of the irrigation water, the cost of the artificial recharge installations remained insignificant.
In the present state of the Teboulba region, the benefits of the artificial recharge are social as well, because they contribute to raising the farmers’ income and to creating jobs, particularly in the fields of maintenance and day-to-day management of the infrastructure. In addition to reduced pumping costs, the availability of a good-quality resource during periods of drought has had a great impact on the preservation of irrigated agriculture and on the crop yields. During the last decades, the Tunisian agricultural production has increased at a mean rate of 3.6% a year, exceeding that of the population (2.3%) which has caused a general improvement in incomes (Ministère de l’Agriculture, 1996).
5 Conclusion
Artificial recharge of coastal aquifers, which are especially overexploited, can offer an efficient means of combating seawater intrusion and thus of preventing an inevitable degradation of the water quality which might prove irreversible. It has produced good results in recent decades and seems to have a promising future in arid and semiarid regions given that it is considered to be a conservation measure as well as a means of developing resources. In a country such as Tunisia, which suffers from lack of water and a capricious climate, artificial recharge by surface water would be very valuable for the aquifers because of the availability of the water and its remarkable annual regularity of occurrence.
Artificial recharge by dam water represents a valuable tool for managing water resources. The installations needed for the recharge operations are simple and relatively inexpensive. Although there are other methods of artificial recharge, the recharge by injection directly into the aquifer is the most efficient one for creating freshwater barriers against saline intrusion. However, clogging of the wells, which was quite random, and the doubts of the farmers concerning this technique might jeopardise the success of the recharge operation. Tunisia has acquired an extensive experience in the field of recharge. However, until now the recharge has remained low and discontinuous in time and space.
Now the aim is to promote an active research and experimentation programme to evaluate the additional resources and, in particular, to achieve an integrated and participative management of the water resources, including partnerships with local communities and the private sector, and to convince the users of the necessity to save water and protect its quality. Note that the storage of excess water in wet years would be extremely valuable in particularly dry years and would lead to a beneficial joint management of groundwater and surface water. Only a determined acceleration of the recharge operation could help to avoid the predicted water crises by guaranteeing supply without putting increased pressure on already degraded resources. The social, economical and environmental impacts of such an action would be considerable.