


 CC-BY 4.0
1. Introduction
While elegant methods such as those reported by de Marsily et al. [2005] enable dealing with spatial heterogeneity, they are unfortunately of no use when basic hydrological information is missing. This is sometimes the case for some of the world’s major aquifers, especially in regions facing groundwater resources sustainability issues. Large transboundary aquifers have been attracting special attention, and as stated by de Marsily et al. [1978] “one reason is that their water resources are very large indeed, but another one is that many problems become apparent when one aims at an intensive exploitation”. Two decades of groundwater resources studies based on satellite hydrology through the Gravity Recovery and Climate Experiment (GRACE) led to a definitive conclusion of world-wide aquifer depletion [see e.g. Richey et al. 2015]. In arid areas such as the Sahara where groundwater is almost the only accessible resource, the unsustainable exploitation of large transboundary aquifers is due to a low, sporadic, and therefore difficult to detect recharge which does not compensate the withdrawals. This causes a piezometric decline and therefore major groundwater depletion for Saharan aquifers [Frappart 2020; Gonçalvès et al. 2013]. Four major regional-scale aquifers with surface areas larger than 100,000 km2 mostly extending within the Saharan belt are concerned: the Northwestern Sahara Aquifer System (NWSAS, Algeria, Tunisia and Libya), the Nubian Aquifer System (NAS, Egypt, Sudan, Chad, Libya), the Murzuk aquifer (Libya) and the Tindouf aquifer system (TAS, see below for basin extension). The first two aquifer systems have been particularly well studied especially to support the well-developed oasis agriculture [Gonçalvès et al. 2013, 2020; Heinl and Brinkmann 1989; Mohamed et al. 2017; Mohamed and Gonçalvès 2021]. The basin of Murzuk has been the subject of some studies especially in the context of the Great Man Made River project to supply water in the Tripoli area [Libya, Pizzi and Sartori 1984]. The last of these four large Saharan aquifers, the TAS, is undoubtedly the least well-known in terms of groundwater budget, available resources, and overall hydrogeological functioning. Territorial conflicts, the low population and the hyper-arid climate prevailing in the eastern half of the area very likely explain this relative lack of hydrogeological information.
The TAS covers tree countries (Algeria, Morocco, Mauritania) and one conflict territory (Western Sahara) over an area of more than 200,000 km2. The geological structures as well as the stratigraphy of this basin are relatively well known due to petroleum and mining (iron) economic interests for this basin. Yet, very few and almost only qualitative hydrogeological studies are available [García et al. 2021; Heißet al. 2020; Lamouroux and Hani 2006; Mahia et al. 2017]. They are based on geochemical approaches (stable isotopes of water, major element, conductivity) to identify relationships between aquifers and overall groundwater flow directions. Using GRACE data, Frappart [2020] showed temporally stable groundwater resources for the TAS. However, the author used a very approximate geographical limit of the basin which does not correspond to the real geological extension of the TAS. Thus, the global groundwater balance really applying to the TAS remains to be established.
The TAS is considered as an endorheic basin in which outlets correspond to groundwater exfiltration (springs), pumping, and evaporation, at the sebkhas (salt pans, see below) of which the largest is that of Tindouf [Figure 3; Lamouroux and Hani 2006]. If the recharge of aquifers does not compensate for groundwater pumping and evaporation that occurred in sebkhas, this should lead to a decrease in groundwater resources and a decline in piezometric levels. Compared to the other large Saharan basins, the TAS is not subjected to excessive pumping. An old estimate of questionable validity now points to groundwater withdrawals in the TAS of about 0.1 km3⋅yr−1 [UNESCO 2006], whereas they represent several km3⋅yr−1 for the other basins.
In arid environments, direct evaporation from the free surface of aquifers can be expected but its intensity is variable and poorly assessed. One hundred km east of Tindouf, in the Beni Abbès region (NWSAS, Western Algeria) where the Average Annual Rainfall (AAR) is 32 mm⋅yr−1, Fontes et al. [1986] established experimentally using geochemical profiles (stable isotopes of water and chlorides) the possibility of a net “negative recharge” or more rigorously a diffuse discharge through a thick unsaturated zone. A net negative recharge occurs when infiltration is seasonally or permanently lower than the groundwater evaporation [Lekula and Lubczynski 2019]. Therefore, this flux corresponds to a groundwater uptake by evaporation for a water table depth up to 200 m according to Kamai and Assouline [2018]. Estimates of direct evaporation from the phreatic surface of aquifers are relatively rare and difficult to perform, either by using geochemical tracers or by direct measurement with surface evaporation flow sensors for point values [Schulz et al. 2015]. For more regional values, mathematical expressions for evaporation as a function of the water table depth were used [Coudrain-Ribstein et al. 1998]. Hydrogeological modeling [Baba-Sy 2005; Zammouri and Ribeiro 2017] and remote sensing methods are also useful. For the latter, the satellite measurement of surface temperature is introduced in ground heat balance models in order to identify the contribution of the latent heat of vaporization [Brunner et al. 2008]. However, these models are highly uncertain, particularly in the Saharan region [Weerasinghe et al. 2020]. When this evaporation is very high, it leads to the development of salt pans at the ground surface in topographical depressions that can be seasonally filled by shallow lakes. In the Maghreb, these areas are referred to as sebkhas, the largest of which is the Chott Djerid in the west of Tunisia with an area of 5360 km2 [Bryant et al. 1994]. In this area, hydrogeological modeling leads to an estimate of the order of 6 m3⋅s−1 (or 35 mm⋅yr−1) of evaporation flux [Baba-Sy 2005]. While such diffuse discharge was identified at the local scale, the Tindouf basin offers the opportunity to describe this flux at a regional scale.
In this study, the scarce piezometric data were supplemented with some geomorphological and hydrological features specific to the arid domain and indicative of piezometric levels. This enabled us first to propose a conceptual model for the hydrodynamic functioning of the basin and then to establish a first set of water level contour sketches for the multi-layer aquifers of Tindouf basin, not available hitherto. The regional groundwater budget over the TAS domain was also obtained using GRACE data and compared to the conceptual hydrodynamic model and to the piezometric analysis. This satellite information (gravity and geographic distribution of sebkhas) made it possible to propose an estimate for the unknown direct phreatic surface evaporation through a groundwater mass balance.
2. The Tindouf basin: physical context
2.1. Geomorphology
The Tindouf basin coincides with a 800 km long and 350 km wide NE-SW oriented low-relief area in North-West Africa (Figure 1A). It is bounded by the Anti-Atlas and the Ougarta ranges to the North, by the Tarfaya basin to the West, by the Bou Bernous arch to the East and by the Reguibat Shield to the South (Figure 1B). The Anti-Atlas range forms an up to 2000 m high relief laterally connected to the lower relief of the Ougarta range. The northern part of the Tindouf basin shows successive southward-dipping cuestas. They originate from the differential erosion of clay-dominated Middle Cambrian, Lower Ordovician, Silurian and Late Devonian formations forming elongated depressions referred to as the internal and external Feijas [Nutz et al. 2019; Thorp et al. 2002] and the Drâa Plain, respectively, and more resistant sandstone- and limestone-dominated Lower Cambrian, upper Middle Cambrian, Upper Ordovician, Early Devonian and upper Early Carboniferous rocks [Michard et al. 2008]. More resistant rocks form the relief of the Jbels Tabanit, Bani, Richs, Tazout and Ouarkziz (Figure 1B). Cuestas and anticlines are crosscut by wadis in narrow gorges (locally called foums) that progressively connect to form the Drâa River flowing in the Drâa plain, which corresponds to the valley located between the Jbel Bani and the Jbel Ouarkziz (Figure 1B). The Drâa valley is the lowest area of the Tindouf basin. In the central portion of the Tindouf basin, a slightly concave plateau referred to as the Hamada du Drâa slowly dips southeastward. On top of the Hamada du Drâa lie abundant sebkhas, especially in the southeastern and eastern part. Eastward and southward, transitions from the Tindouf basin to both the Bou Bernous arch and the Reguibat shield are not expressed by a significant topography. To the west, from the Hamada du Drâa to the Tarfaya basin, the topography abruptly decreases at the edge of the Hamada du Drâa plateau entering the catchment of the Saguia el Hamra wadi (Saguia el Hamra plain) and then progressively decreases westward until the Tarfaya basin.
Digital Elevation Model of northwest Africa (SRTM30) showing the Tindouf basin and surrounding areas. Estimated limits of the basin are presented as well as major sub-regions of the basin.
2.2. History of the Tindouf basin and lithostratigraphy
Initiation of the Tindouf basin dates back to Paleozoic times, during which a large wave-length flexural deformation has affected the Saharan platform. This deformation resulted in several intracratonic basins separated by anticlines, referred to as arches [Perron 2019]. The Tindouf basin is the western-most of these intracratonic basins; it is a 800 km elongated asymmetrical syncline (Figure 2A) oriented ENE to WSW characterized by a southern flank gently dipping to the north and a northern flank steeply dipping to the south (Figure 2B). In places, the Tindouf basin is thought to reach a maximum depth of about 8 km [Craig et al. 2008] while it commonly reaches 2–3 km (Figure 2B).
Simplified geological map of the Tindouf basin and regional-scale cross sections showing the TAS geometry [compiled from Boote et al. 1998; Leprêtre 2015; Perron 2019].
The lithostratigraphy consists of km-scale Paleozoic formations from Cambrian to Late Carboniferous. Unconformably overlaying, hundreds of meters-scale Cretaceous, Tertiary and Quaternary deposits form the Hamadian Formation. All together, these formations constitute the Tindouf Aquifer System (TAS). The Paleozoic sedimentary succession originates from the long-term evolution of a several hundreds of km long embayment connected northward to the Tethyan sea where global eustatic fluctuations led to successive transgressions and regressions from the Cambrian to the Late Carboniferous Guiraud et al. [2005]. From the Late Carboniferous, uplift of the northern Sahara platform, as a consequence of the Hercynian orogeny, marks the onset of the Anti-Atlas and the Ougarta range uplift. As a consequence, the Tindouf basin was enclosed and then inverted, interrupting sedimentation. The area likely remained stable in a terrestrial context until the Lower Cretaceous, during which the Sahara Platform and the Tindouf basin were intermittently flooded until the Paleogene, the maximum submersion being coeval to the global Cenomanian–Turonian transgression. During the Middle to Upper Eocene, the first Atlasic tectonic event [sensu Frizon de Lamotte et al. 2009] slightly uplifted the basin and sedimentation stopped, until another subsidence phase during the Neogene, likely during the Mio-Pliocene, allowed sedimentation to restart. Afterwards, the Tindouf basin was definitely inverted [Frizon de Lamotte et al. 2009]; since that time, eolian deflation and fluvial incision have been the predominant processes modifying the Tindouf basin surface.
Even if the stratigraphic pile of the Tindouf basin is complex due to strong variations in lateral facies and thickness, as a simplification, from base to top, the Tindouf basin succession starts with Cambrian limestones [Maloof et al. 2010]. In places, the Cambrian limestones overlay a basal clastic interval [Michard et al. 2008]. In the northern part of the Tindouf basin and in the Anti-Atlas, the Cambrian interval is several kilometers thick, progressively thinning southward, pinching out in depth in the Tindouf basin (Figure 2B). Above, Lower Ordovician rocks consist of shales recording offshore marine conditions [Loi et al. 2010]. Overlying are sandstones of the Upper Ordovician; they originate from a major global eustatic sea-level fall due to the end-Ordovician glaciations [Beuf et al. 1971; Ghienne et al. 2007; Loi et al. 2010]. Interruption of this glacial event is recorded by an abrupt transition to Silurian shales [Lüning et al. 2000; Nutz et al. 2013]; in the Tindouf basin, Silurian shales are 100–200 m thick [Guerrak 1989]. Overlying the Silurian shales, lower to middle Devonian rocks are shallow marine shales while during the Middle to Upper Devonian a global marine regression led to the deposition of marine fine sandstones [Guerrak 1989]. Above, Lower Carboniferous rocks (Visean) include shallow marine limestones and occasional continental sandstones. These deposits are overlain by marine shales which are Middle Carboniferous in age. Above, continental sandstones terminate the Paleozoic succession as a new global regression occurred during the Upper Carboniferous. Overlying the Paleozoic succession, the Hamadian package includes Lower Cretaceous, Cenomanian and Turonian marine and continental deposits, unconformably overlain by Mio-Pliocene continental sandstones.
2.3. Hydrology
Using the geomorphological, geological and structural information presented in Sections 2.1 and 2.2, the hydrogeological limits for the TAS (contacts with the basement, hydraulic thresholds associated with folding) shown in Figures 1 and 2 were identified in a much more realistic way than those presented in IGRAC (International Groundwater Resources Assessment Centre) [2015]. Over this domain of 255,000 km2 in surface area, four aquifer formations were identified: the Upper Ordovician sandstones, the Middle to Upper Devonian fine sandstones, the Carboniferous mainly made of the Visean limestones and sandstones, and the Hamadian platform (Cretaceous, Tertiary and Quaternary). The syncline morphology of the Tindouf basin suggests a topographically driven groundwater flow regime which is clear for the Paleozoic aquifers affected by major folding and more subtle for the Hamadian, where lower stratal dips are observed.
Rainfall gridded data beginning in 1901 were retrieved from the CRU data center (Climatic Research Unit, http://wps-web1.ceda.ac.uk) at a resolution of 0.5° × 0.5°. It should be noted, however, that the number of rainfall land stations (some of which were available after 1901) is very limited in the Sahara [Harris et al. 2020] and specifically in the TAS area (7 stations). Precipitation shows a NW–SE linear gradient with maximum precipitation onto the Anti-Atlas relief with an average annual rainfall reaching 200 mm⋅yr−1, while minimum precipitation locates to the southeastern part of the basin with an average value of 20 mm⋅yr−1 (Figure 3). This rainfall pattern with higher values in the Anti-Atlas greatly influences the hydrographic network. Only one river of regional importance is present in the TAS domain but only in its lower and mainly dry part, the Drâa river (Figure 1). In its upper and middle valley, the Drâa river episodically flows mainly on the bedrock and not on the sedimentary formations of the TAS. In its upstream part, flood waters are stored in dams to supplement groundwater for human activities, especially agriculture. Moreover, the larger average annual rainfall (AAR) values located on the Anti-Atlas localize the likely active recharge area. In opposition, sebkhas mostly situated in the south-east of the basin (Figure 3) correspond to areas of high water evaporation (groundwater and/or wadi floods) and thus certainly localize some of the main outlets of the TAS. However, the real hydrodynamic functioning (recharge–discharge areas) of the Tindouf basin is difficult to decipher due to the scarcity of the piezometric data.
(A) Domain-averaged time series of the Average Annual Rainfall (AAR) for the TAS, (B) distribution of the AAR and location of the sebkhas (salt pans), and (C) Cumulative distribution of the sebkhas surface areas.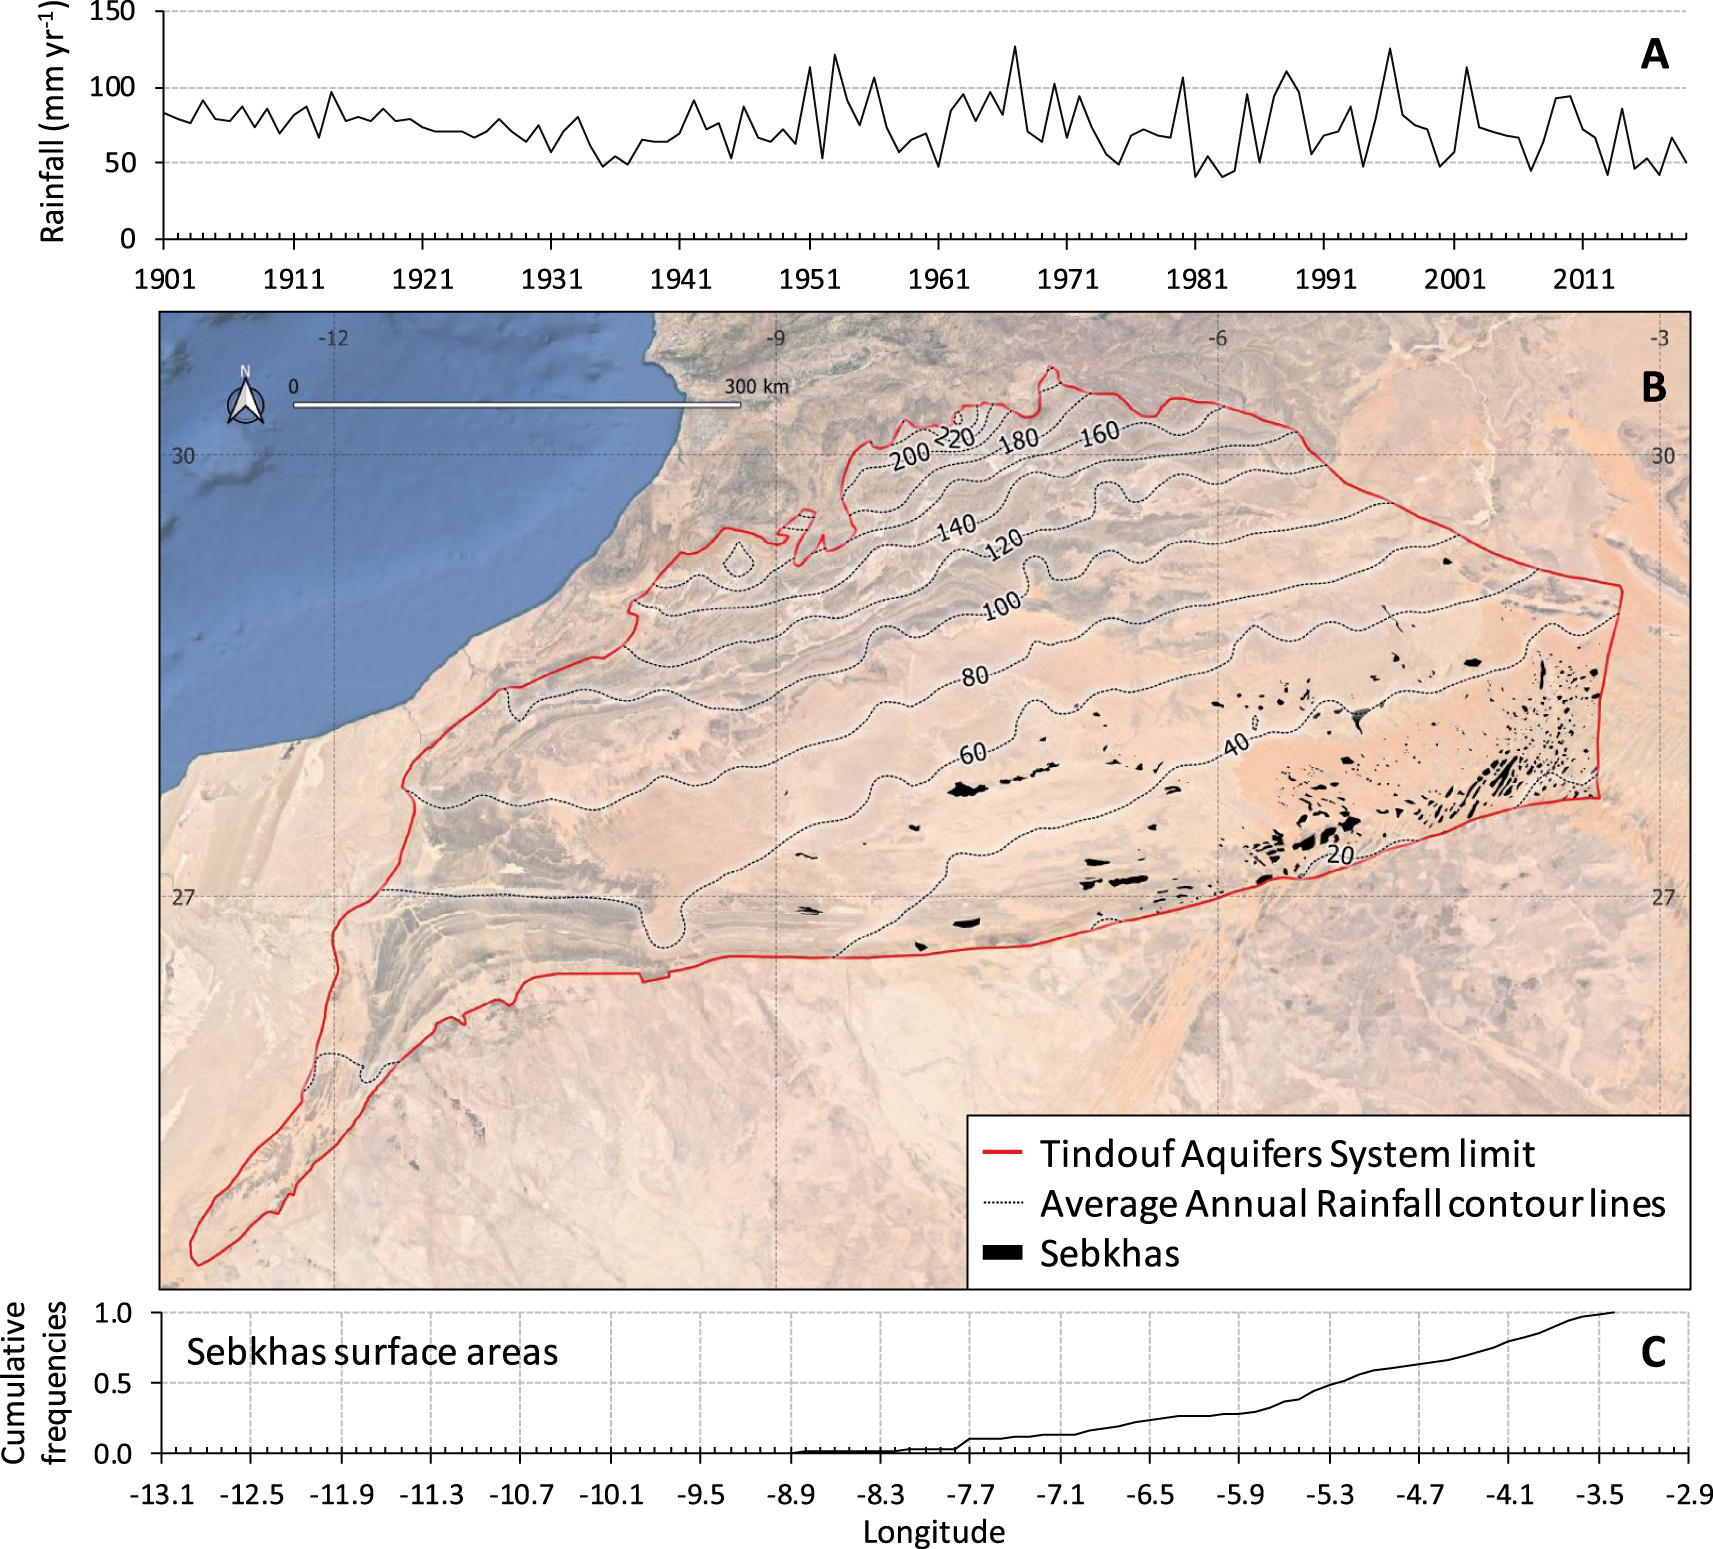
The few available water levels (31 values) mostly date back to 1980 and are localized around the city of Tindouf for the Hamadian and Visean aquifers, and south of Tindouf city for Devonian and Cambro-Ordovician aquifers [Lamouroux and Hani 2006]. However, a few additional piezometric levels measured in the 2010–2020 decade were provided by Ron Martin [2020]. By comparing these recent levels with the 1980 data, the temporal evolution of aquifer water levels was estimated, at least in the western part. A decline of a few meters per decade for the Hamadian aquifer is observed while a relative stability of piezometric levels characterizes other aquifers. According to Lamouroux and Hani [2006], the Hamadian and Visean aquifers are hydraulically connected at the southern border of the basin, as evidenced by very similar piezometric levels at about 400 m in dedicated piezometers for the two aquifers in the area of Tindouf city. The largest piezometric level data set for the Hamadian aquifer demonstrates a groundwater flow from the west-northwest (Hamada plateau) towards the sebkha of Tindouf, which is therefore a major discharge area by exfiltration and evaporation. For the Visean aquifer, Lamouroux and Hani [2006] reported unpublished (unavailable technical reports) hydraulic head measurement campaigns suggesting north-eastern streamlines converging to the sebkha of Tindouf and therefore pointing to an active recharge at the northern Anti-Atlas piedmont. This latter recharge area is consistent with the fact that in the northern part of the basin, the Zemoul anticline (Figure 2) exhumes the Devonian and the Visean, thus establishing a preferential recharge zone. For the aquifers of the Hamadian and Visean, recharge probably occurs by direct infiltration (diffuse recharge) of rainfall and infiltration of floodwater (focused recharge) on the Hamada plateau and at the Zemoul anticline while discharge occurs at the southern sebkhas.
Along the southern flank of the Tindouf basin, in the Devonian aquifer, the piezometric data of Lamouroux and Hani [2006] point to a down-dip (towards the northeast) local hydraulic head gradient of 10−3. Despite scarce and poorly distributed data (three water level values), a similar gradient can be identified for the Cambro-Ordovician aquifer at the same location. No piezometric data are available in the literature to our knowledge for the Paleozoic formations on the northern flank of the Tindouf basin. Given the lack of an effective hydrodynamic conceptual model for the TAS, little is known about recharge and discharge areas for the Devonian and Cambro-Ordovician aquifers which can only be postulated regarding the overall topographically-driven conceptual model for groundwater flow. Higher piezometric levels in the north of the basin compared to the south can be reasonably assumed, resulting in a southward gradient. Therefore, the general hydrodynamic functioning for the Devonian and Cambro-Ordovician aquifers could correspond at first order to a recharge on the northwest flank and a discharge on the southern flank. Local discharge areas can also be suspected. For instance, the absolute topographic low area of the basin corresponds to the Drâa valley to the northwest of the domain which deeply incised transversally the Devonian and Cambro-Ordovician strata making this area a possible outlet for these aquifers.
Average transmissivity values of 6.5 × 10⁻⁶, 1 × 10⁻⁴, 9 × 10⁻⁵ and 6 × 10⁻⁴ m2⋅s−1 were reported by Mahia et al. [2017] and García et al. [2021] for the Hamadian, Visean, Devonian, and Cambro-Ordovician aquifers, respectively. Storativity values are only available for the confined parts of the Devonian in the order of 10−3 and for the unconfined areas of the Hamadian and Visean aquifers at 0.06 and 0.1 respectively. Considering the hydraulic head gradients suggested by the scarce piezometric data in the order of 10−3, the transmissivity values point to a low productivity of the aquifers. Groundwater exploitation mainly occurs in the Morocco fraction of the TAS with more than 100 × 106 m3⋅yr−1, much larger than the 3 × 10⁶ m3⋅yr−1 withdrawn at Algerian Tindouf city [UNESCO 2006]. However, beyond these rather old estimates, pumping data are extremely scarce. Only global values for the Moroccan basins are available [Hssaisoune et al. 2020] with an estimate of 323 × 106 m3⋅yr−1 for the Drâa valley, of which only the lower part is in the TAS.
3. Material and methods
3.1. Water levels mapping
The piezometric contour map, which is the basic tool for identifying groundwater flow, is lacking here for almost all the aquifers due to water level data scarcity, with the exception of a very restricted area around the city of Tindouf for the Hamadian formation. However, some indirect information makes it possible to compensate for the lack of hydraulic head data. Geomorphological and hydrological features indicative of the piezometric level in this arid context can be comprehensively collected. The locations of springs were primarily considered here since their topographical elevation gives the piezometric levels of the aquifers from which such groundwater outflows. The corresponding aquifer was simply identified by considering the exposed geological strata at the location of the springs. Additional information was parsimoniously used to supplement the spring data, i.e. only to fill sampling gaps, especially in the eastern and western parts of the basin. This additional information is made of traditional or shallow water wells (hassi in local arabic) and sebkhas. Water levels very close to the ground surface for hand dug traditional wells mean that a piezometric level almost equal to the topographic elevation can be assumed. Elevations are obtained here using the Digital Elevation Model (DEM) SRTM (1-arcsec resolution). The Khettara systems, which are gently dipping tunnels drilled to reach the water table of an aquifer (indicative of the elevation of the water table) provided by Heißet al. [2020], were not used here since they are redundant with numerous springs. Spring and well locations and names are available from the GEOnet Names Server (GNS) of the US National Geospatial Intelligence Agency (NGA, https://geonames.nga.mil/gns/html). The sebkhas are flat depressions collecting water from wadi floods and/or aquifers where water evaporates, causing salt precipitation. At the sebkhas, and especially where they are exclusively fed by groundwater, the water table is nearly at the ground surface [Lamouroux and Hani 2006]. It is assumed here that the small surface water bodies observed on the hyper-arid southeastern and eastern parts of the basin are sebkhas exclusively fed by aquifers whose free surface at these outcrops is very close to the ground surface. The few sebkhas (two) used here were obtained from the surface water bodies mapping provided by Pekel et al. [2016, data available at https://global-surface-water.appspot.com] using satellite imagery. The indirect water level information collected here was associated with the available piezometric data (Figure 4 and Supplementary Information) in an attempt to improve our understanding of the overall hydrodynamic functioning of the aquifers system.
Piezometric sketches for the four main aquifers. The blue arrows indicate main groundwater streamlines and the black dashed line groundwater divides (Cambro-Ordovician, Devonian, and Visean) or convergence to a median discharge area (Hamadian). Springs beyond the limits (e.g. groundwater divide at Bou Bernous) were considered to constrain the interpolation.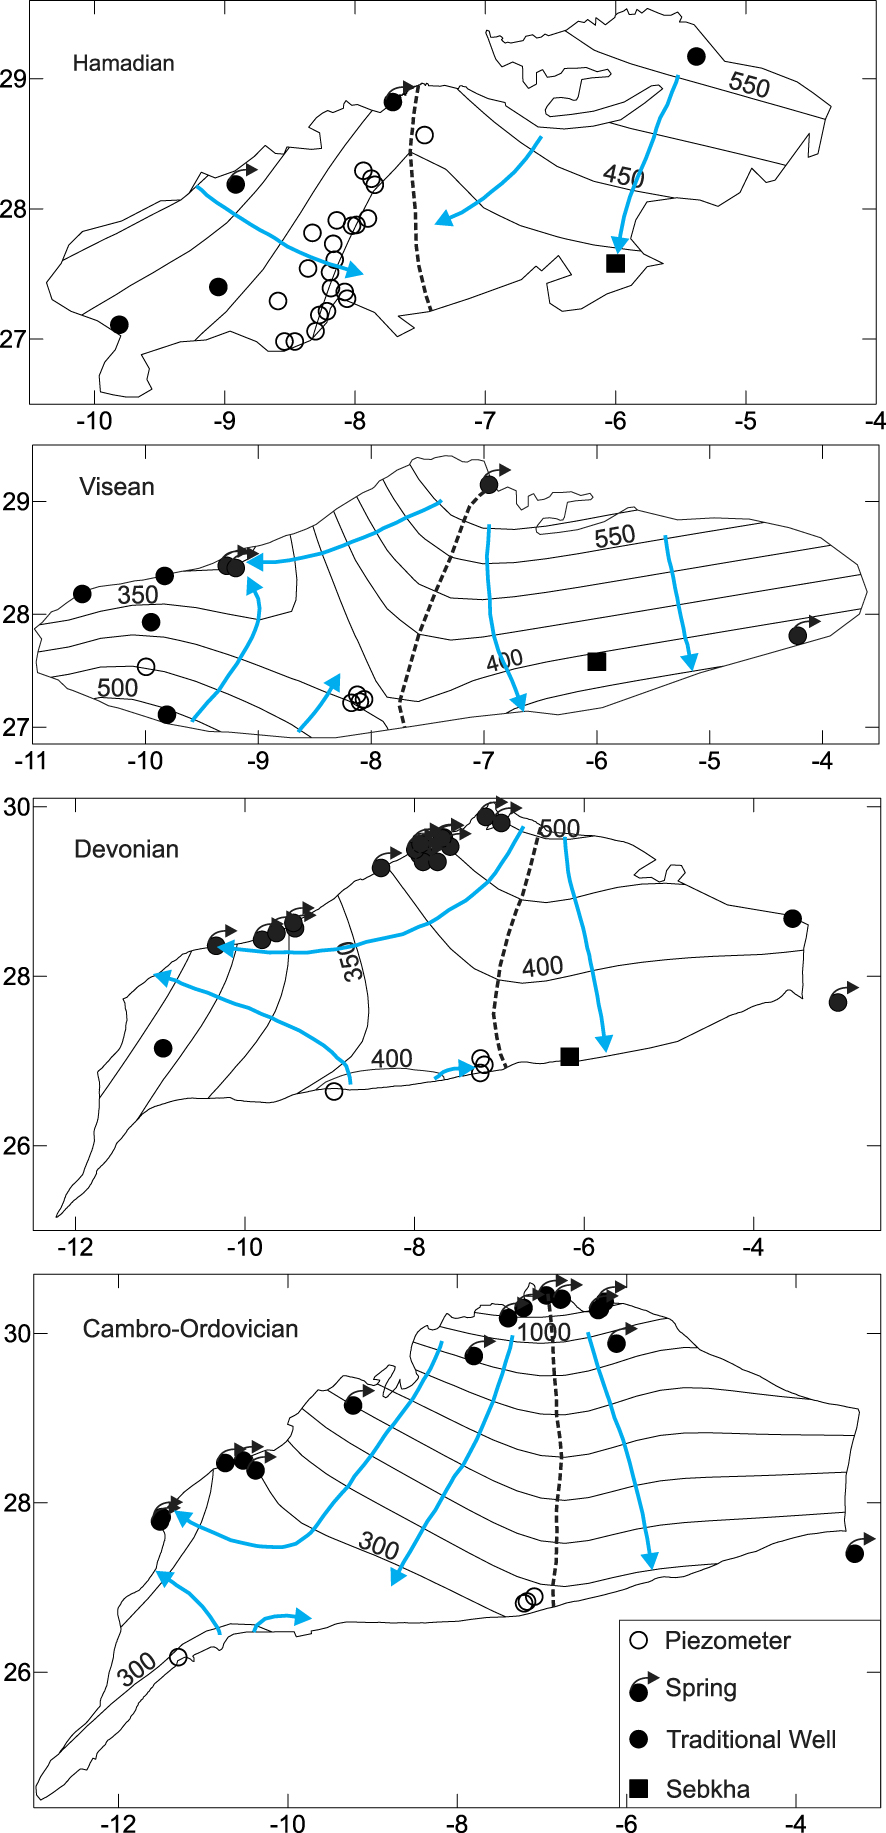
3.2. Groundwater mass balance analysis using satellite-based gravity data
The GRACE twin-satellite system launched in 2002 by the NASA and the German Aerospace Center (DLR) monitors the earth’s gravity on a monthly basis [Tapley et al. 2004]. The gravity variations monitored by the GRACE satellites are attributed to mass variations of the surface water bodies (groundwater, soil water, and surface water). Given the obvious hydrological interest of this kind of measurement, for example for water balance purposes at the regional scale, the data are expressed in water height. The more recent version of the GRACE data is based on an interpretation of the gravity signal using discrete regional mass concentration blocks (spherical caps) called Mascons [Watkins et al. 2015]. Monthly GRACE-derived Terrestrial Water Storage (TWS) anomalies (difference between a TWS value and its average value calculated for the period January 2004–December 2009) were retrieved from the Jet Propulsion Laboratory (JPL data center, http://grace.jpl.nasa.gov). The JPL R06M solution filtered from the contribution of oceans [CRI filter, Wiese et al. 2016], therefore giving the TWS time-series corresponding only to the land part of a Mascon, was used here. The scaling factors proposed by Wiese et al. [2016], which correspond in fact to downscaling factors [Scanlon et al. 2016], were used to downscale the data from their native resolution (3° × 3°) to a 1° × 1° resolution. These downscaling factors are based on the mass distribution calculated by a land surface model (soil-atmosphere water balance) which is considered suitable to the Tindouf basin where evaporation through the soil might be a prominent discharge. The relevance of these factors in the case where groundwater abstraction is the dominant term was recently questioned by Gonçalvès et al. [2021]. The Center for Space Research (CSR) solution produced at University of Texas (Austin, USA) and involving inversion of the gravity signal at a 1° resolution was also retrieved. In this study, 223 monthly solutions for the period between April 2002 and October 2020 were used (Figure 5). The trend of a TWS time-series is interpreted as water variation (e.g. in mm⋅yr−1) over a land surface and thus water fluxes over the TAS.
(a) Domain-averaged time-series for the different Soil Water Storage (SWS) models GRACE (mean CSR-JPL) from GLDAS (NOAH, VIC, CLSM) and average Terrestrial Water Storage (TWS) between JPL and CSR solutions., and (b) Groundwater Storage (GWS) times series obtained by subtracting the retained SWS (CLMS) from the averaged TWS.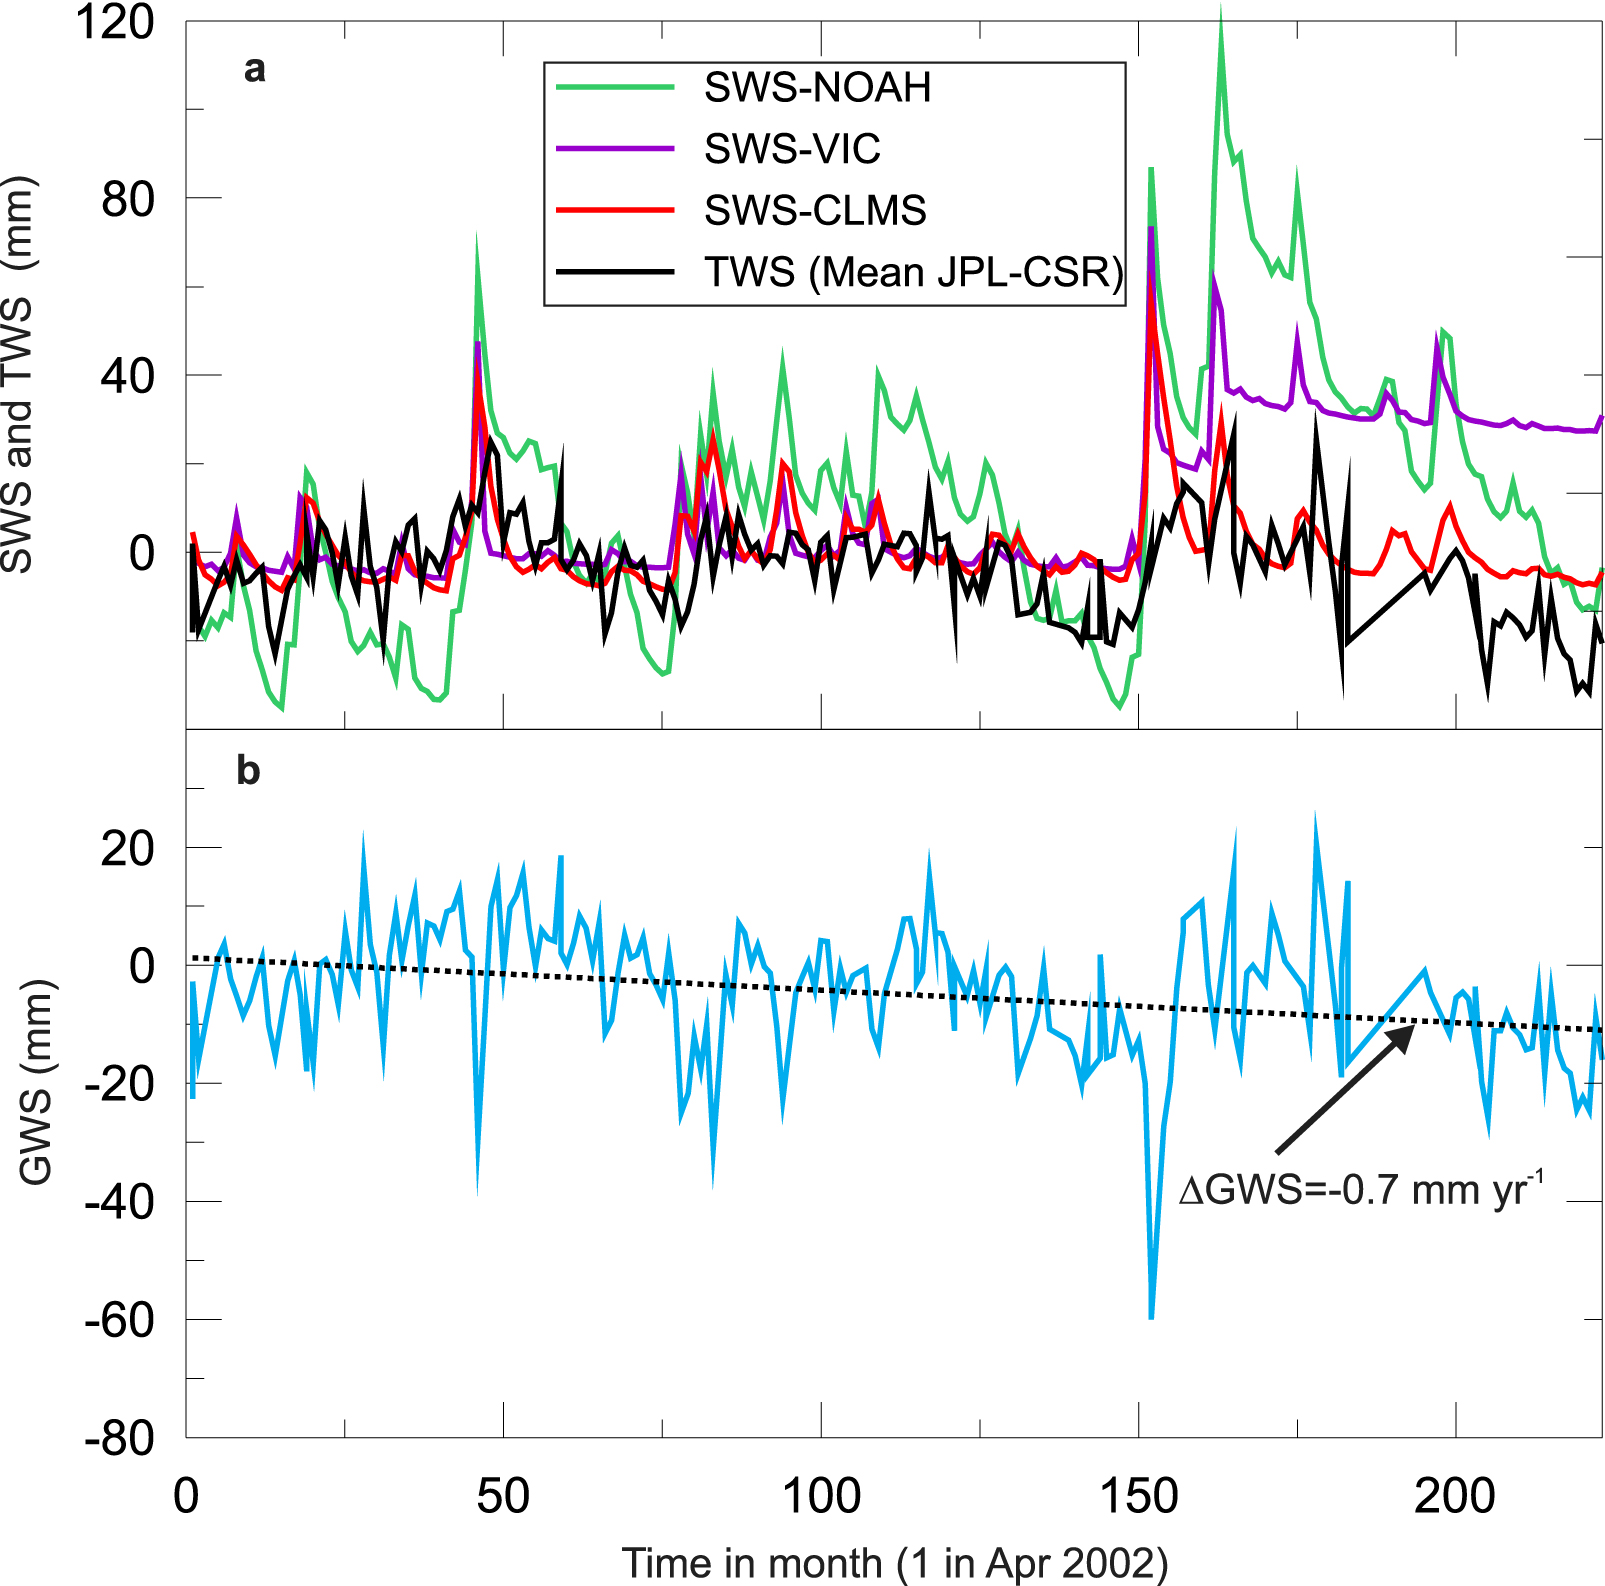
As outlined above, groundwater, surface water, and soil moisture variations are accounted for in TWS time series. Therefore, and in the absence of substantial surface water in the TAS domain, Soil Water Storage (SWS) has to be subtracted from TWS to identify Groundwater Storage (GWS). Soil water storage variations (𝛥SWS) are usually small due to almost constant and low soil moisture in arid areas and may represent a small or even negligible component of TWS [Gonçalvès et al. 2013; Nimmo et al. 1994]. Despite the questionable geographical limit used, the soil moisture time-series proposed by Frappart [2020] for the TAS suggest an almost zero SWS interannual variation. Soil Water Storage (SWS) time-series are available from the Global Land Data Assimilation System (GLDAS, http://disc.sci.gsfc.nasa.gov/) combining ground-based and satellite data and the results of hydrological surface models [Rodell et al. 2004]. The 1° spatial resolution data was retrieved for the same period as the GRACE data and for the 3 available land surface models (LSM):
- the Variable Infiltration Capacity model (VIC)
- the Community Land Surface Model (CLSM)
- the National Oceanic and Atmospheric administration model (NOAH).
The Soil Water Storage (SWS) was expressed in anomalies in the same way as for the GRACE TWS anomalies, i.e. by subtracting the 2004–2009 average from each term of the time series. Upon verification of the consistency of the alternative LSM outputs with the GRACE data, GLDAS data yielded GWS = TWS −SWS time-series. The groundwater storage variations (𝛥GWS) identified from this GWS time-series were then used in regional-scale groundwater balance calculations to identify in particular two unknown terms: the recharge and the evaporation.
4. Results
4.1. Hydrodynamic conceptual model for the TAS based on piezometric information
Piezometric sketches not available hitherto were obtained here using the direct and indirect water levels collected (see Section 3.1 and Supplementary Information). The main objective was to identify recharge and discharge areas for the different aquifers of the TAS as well as the main flow directions. For this purpose, we used the local polynomial interpolation package in R which is not an exact interpolator, thus producing smooth surfaces given the fact that data of different origins and dates (despite low temporal variations, see Section 2.3) were used.
With this approach, the conceptual model for the hydrogeology of the TAS was largely updated. The piezometric levels shown in Figure 4 point to a similar hydrodynamic behavior between Cambro-Ordovician, Devonian and Visean aquifers on the one hand and Hamadian aquifer on the other hand consistent with the stratigraphic unconformity. Regarding first the deeper Paleozoic aquifers, the highest piezometric levels (above 500 m) are observed at the northwest boundary of the basin, making this area a major recharge zone from which groundwater flow diverges towards two discharge areas: the southeastern border and the northwestern boundary close to the Atlantic coastal area (Figure 4). The southeastern discharge zone ought to be a major outlet of the Paleozoic aquifers in accordance with the presence of numerous sebkhas especially aligned along the outcrops of Paleozoic formations in this hyper-arid area [Figures 2 and 3, and Pekel et al. 2016]. At the location of the sebkhas, the discharge occurs by exfiltration and evaporation due to the proximity of the water table to the ground surface [Lamouroux and Hani 2006]. Southeastern groundwater discharge is also supported by reconnaissance operations carried out by the French army in Algeria in the 1930’s which identified numerous springs and possibly downstream sebkhas [Martin 1930]. An area of likely modest recharge can also be identified in the southwest of the TAS for deep aquifers that corresponds to small topographic highs with relatively higher rainfall than the remaining southern boundary. Regarding now the Hamadian aquifer, the same recharge area at the Anti-Atlas piedmont as for the Paleozoic aquifers can be clearly identified in Figure 4. The likely presence of this recharge area was commented on but not evidenced by Lamouroux and Hani [2006]. Conversely to the other aquifers, there is only one discharge area for the Hamadian aquifer. It corresponds closely to the Sebkha of Tindouf in central and southern position, making the area east of the −8°W and south of 28°N certainly the main discharge area of the whole TAS. The other western recharge area for the Hamadian aquifer, i.e. the Hamada du Drâa plateau already described is also clearly identified in Figure 4.
Piezometric sketches suggest a common feature for all aquifers, i.e. the presence of groundwater divides or a convergence area between the parallels −8W and −7W (dashed lines in Figure 4) separating the TAS into two sub-basins. For all aquifers these groundwater divides correspond to a zero-flow boundary except for the Hamadian for which the central part is a discharge area that will be taken into account in the groundwater budget equations (see section below).
4.2. GRACE-derived groundwater balance of the TAS
Before correcting the GRACE-derived TWS data from soil water storage (SWS, see Section 3.2), the compatibility of the different soil models with the GRACE data needs to be verified for the region of interest [Gonçalvès et al. 2013; Scanlon et al. 2019]. From this point of view, Scanlon et al. [2019] recently reiterated that the consistency of SWS fluctuations (seasonality) with that displayed by the GRACE signal (SWS amplitudes expected to be less than or equal to that of TWS) should be verified. For this purpose, domain average terrestrial and soil water storage time-series were considered first for comparison purposes (Figure 5). The VIC and NOAH models show a sharp rise of about 100 mm in soil water storage at the end of 2014 then a roughly stable or declining plateau that does not appear as much in the GRACE data. Consequently, these two models that are inconsistent with the GRACE data (gravity observations) were rejected and only the CLSM model was considered in the following analysis. Despite a sharp increase also for the CLSM model in 2014, the latter shows the best overall consistency with the GRACE TWS time-series. It can be noted that the CLSM model is consistent with the soil model considered by Frappart [2020] showing a weak interannual storage variation (low trend). Using the CLSM model to identify SWS and to produce the GWS time series (TWS −SWS) leads to an overall groundwater depletion of the TAS 𝛥GWS = −0.7 ± 0.1 mm⋅yr−1 (Figure 5).
The regional distribution of GRACE-derived values of 𝛥GWS shows a western part in quasi-equilibrium regarding groundwater mass variations while the eastern part is in clear depletion (Figure 6). Moreover, the largest groundwater depletion of the TAS is identified at the southeastern boundary of the basin over a limited area of 16,000 km2 and at a rate of about −5 mm⋅yr−1. Interestingly, this large depletion zone corresponds exactly to the areas of high-density regarding salt pans at downstream Paleozoic aquifer outcrops where high evaporation is expected (see Figures 2 and 3). Therefore, evaporation may be a prominent outflow for the TAS without being precisely quantified at this stage.
Spatial distribution of Groundwater storage variations 𝛥GWS (18 years average) of the Tindouf aquifer system and Groundwater budget fluxes (see Equations (1) and (2)) expressed in water heights.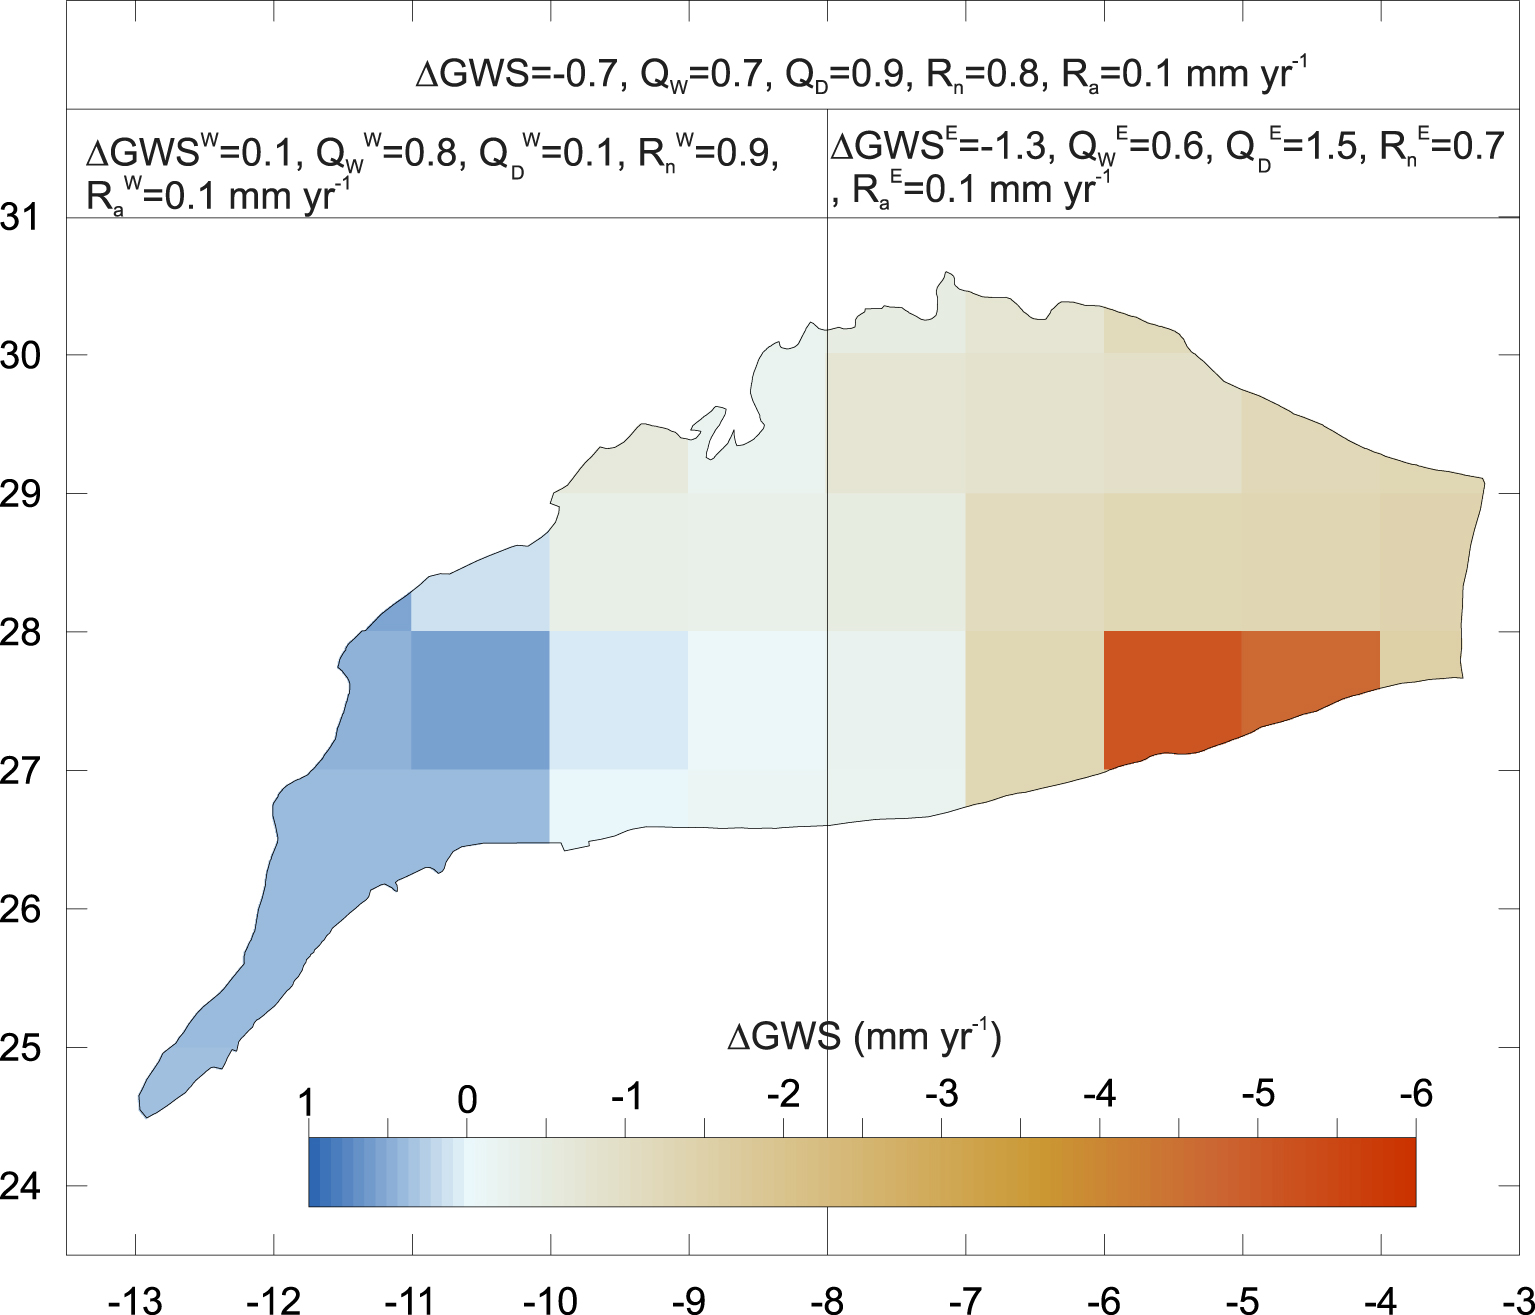
The overall water balance for the TAS involves two unknowns: the recharge and the natural groundwater discharge, here dominated by evaporation at the sebkhas mostly in south-east quarter of the domain (sebkha of Tindouf and numerous sebkhas along the Visean, Devonian and Cambro-Ordovician outcrops). Therefore, writing a single water balance for the entire basin as previously done e.g. by Gonçalvès et al. [2013] for the NWSAS cannot provide independent estimates for these two quantities. Considering the results of the water level analysis (Section 4.1) and the spatial distribution of the sebkhas where this evaporation occurs (Figure 3), the basin is subdivided into two sub-domains separated by the 8th parallel: an eastern, more arid, part where the sebkhas are mainly located (main discharge areas) and a western part, slightly more humid on average. Two distinct groundwater-balance equations were written over these two domains assuming negligible east-west groundwater exchanges based on the piezometric sketches of Section 4.1. It should be noted that for the Hamadian, groundwater converges towards this central area and do not pass from one sub-basin to another one. This sub-division is also largely supported by the GRACE data which show a western half-domain in near equilibrium with respect to the water budget with 𝛥GWSW = 0.1 mm⋅yr−1, while the eastern area is characterized by a groundwater depletion with 𝛥GWSE = −1.3 ± 0.1 mm⋅yr−1. The GRACE-derived water budgets for the western and eastern sub-domains of the TAS are written:
| (1) |
| (2) |
Solving the TAS groundwater balance requires the identification of pumping rates for which only the global value is known. Groundwater extraction for the Algerian part [a few million cubic meters per year; García et al. 2021] is negligible compared to the exploitation in Morocco mainly for irrigation (see Section 2.3). Global values at 323 × 106 m3⋅yr−1 are given by Hssaisoune et al. [2020] for the Drâa basin and at 22 × 106 m3⋅yr−1 for the Guelmim plain [Figure 1; Touzani 2012] in Morocco. The methodology proposed here involves redistributing the global value to obtain pumping values QWi for the two sub-basins. The partitioning of pumping between the two sub-basins was made using two alternative approaches: (i) using the spatial distribution of irrigated surfaces from FAO AQUASTAT (data version 5 available at https://data.apps.fao.org/aquamaps/), and (ii) the spatial distribution of pumping wells available from the Moroccan Souss-Massa-Drâa hydrological basin agency (ABHSMD, http://www.abhsm.ma). The irrigated surface areas within the TAS domain represent 25% east of −8°W and 19% west of −8°W of the global irrigation areas in the Drâa basin, and 15% of those in the Guelmim plain (western sub-basin). Assuming a proportionality between cultivated surfaces and groundwater abstractions yields QWW = 65 × 106 m3⋅yr−1 (19% of 323 × 106 m3⋅yr−1 plus 15% of 22 × 106 m3⋅yr−1) and QWE = 82 × 106 m3⋅yr−1. The eastern and western sub-basins each contain 30% of the Drâa basin pumping wells while 50% of the Guelmim plain boreholes are located in the western part. Assuming again a linear relation between borehole density and groundwater abstractions yields QWW = 108 × 106 m3⋅yr−1 and QWE = 97 × 106 m3⋅yr−1. The different values obtained for the pumping in the TAS are due to contrasting relative proportions of pumping and agricultural areas. Considering now average values between the two approaches leads to QWW = 87 ± 30 × 106 m3⋅yr−1 or 0.8 ± 0.3 mm⋅yr−1 and QWE = 90 ± 10 × 106 m3⋅yr−1 or 0.6 ± 0.1 mm⋅yr−1 over the 112,000 km2 and 143,000 km2 surface area of the western and eastern sub-domains, respectively. Following Gonçalvès et al. [2013] artificial recharge (irrigation return flow) represents a fraction f = 15 ± 15% of withdrawals, leading to Rai = f × QWi. Regarding the last two terms on the right-hand side of Equations (1) and (2), linear relations between natural recharge and AAR (Rni =𝛼 ×AARi, AARE = 50 mm⋅yr−1 and AARW = 62 mm⋅yr−1) and between natural discharge (evaporation) and salt pans surface SSPi (QDi =𝛽 ×SSPi, SSW = 150 km2 and SSPE = 3500 km2) were assumed. By introducing these relations together with the values for 𝛥GWSW, 𝛥GWSE, QWW, QWE and the corresponding artificial recharge values in Equations (1) and (2), 𝛼 (1.39 ± 0.46 × 10⁻²) and 𝛽 (4.48 ± 0.88 × 10⁻⁴ mm⋅km−2⋅yr−1) and then the natural recharge and discharge in each sub-domain given in Figure 6 were identified. The domain-averaging of these values using sub-domain surface areas yielded Rn = 0.8 ± 0.2 mm⋅yr−1 (196 ± 51 × 106 m3⋅yr−1) and an evaporation QD = 0.9 ± 0.2 mm⋅yr−1 (225 ± 51 × 106 m3⋅yr−1) for the entire TAS domain.
5. Discussion
In this study, the first step was to identify the hydrogeological limits of the basin as accurately as possible. Geological features such as arches or highs which likely constitute hydraulic divides were looked for. From this standpoint, the numerous geological studies available giving the structure and lithological descriptions provided valuable information for hydrogeological analysis. Low-extension anticlines were included in the domain in the north-northwestern zone where TAS limits were defined by the contact between the Cambrian and the crystalline basement. These anticlines can lead to local flow structures (e.g., piezometric highs, streamlines developing around the anticline) that disrupt the overall topographically driven groundwater flow pattern. The precise nature and geometry of these hydrodynamic disturbances cannot be characterized using piezometric information, which is too sparse and poorly distributed geographically. However, these anticline areas of moderate surfaces (few thousand km2) were integrated into the domain (i) for overall geological consistency, and (ii) for water balance purposes based on satellite data on a multi-layer system whose extension is ultimately given by that of the Cambrian formation. The geographical extension presented here can therefore be used to update the TAS limits in the international synthesis of aquifers by IGRAC (International Groundwater Resources Assessment Centre) [2015].
The physiographic information (DEM, geomorphology) and satellite images of earth surface to identify the salt pans were then considered in a second step in order to draw a conceptual model for the hydrogeology corresponding to an endorheic topographically-driven basin. This interpretation is consistent with the generally relatively high salinity reported for the groundwater of the different aquifers which is often in the order of a few g/l, requiring reverse osmosis treatment plants for water consumption [García et al. 2021; Lamouroux and Hani 2006]. Here, this conceptual model was supported by piezometric sketches obtained by compensating the lack of water level data with indirect information of varying quality: DEM-derived elevations of springs, sebkhas, and traditional wells. The maximum value of the DEM uncertainty (SRTM 1 arcsec) at the global scale is 16 m. However, when possible, this uncertainty should be identified locally by comparing the DEM values with reliable elevation data. To our knowledge, this comparison has not been carried out on the present study area but on a nearby area in Morocco [Khal et al. 2020]. The authors identified an average error of about 2 m for SRTM 1 arcsec. This error is thus larger than the accuracy of the piezometry but remains acceptable given the several hundred meters range of variation of piezometric levels. Of the indirect piezometric information, the sebkhas are the most uncertain. Their use assumes a preferential groundwater supply, which is verified if the free water exists long enough after the rain. The validity of such condition is difficult to verify. The satellite imagery interpretation proposed by Pekel et al. [2016] can generally identify only one to three years of water bodies occurrence in the period 1984–2021 in the area of interest for the use of sebkhas (southeast of the isohyets 30 mm/year, Figure 3). Generally, the sebkhas in this area contain water the year following a particularly rainy year (according to the CRU data in Figure 3), which suggests, but does not formally establish, the occurrence of surface water bodies with some time lag. Only the Hamadian could be really impacted by this uncertainty on the two sebkhas considered here since no other data is available in the southeast part of this aquifer, unlike the other three aquifers. However, the overall interpretation in two hydraulic sub-basins used as a basis for the water budget calculations using GRACE is little impacted by this uncertainty, including for the Hamadian since the piezometric data and the well (Figure 4) for the latter already suggests the considered structuring. The piezometric spatialization proposed here is certainly approximate but the use of more robust interpolation methods was difficult to consider due to the scarcity and heterogeneity of the data as well as their sparse spatial distribution. Although approximate, these piezometric sketches are not only illustrative but provide a valuable scheme for the hydrodynamic functioning of the TAS (main streamlines, recharge and discharge areas) consistent with what was known in the literature and with the GRACE data. Therefore, the proposed piezometric sketches, which represent a first attempt, should be confirmed by a consistent water level data set, even if this seems difficult at this time. However, the good consistency between (i) the conceptual model proposed here for the TAS, (ii) the piezometric sketches for the main aquifers of the TAS, and (iii) the regional distribution of 𝛥GWS derived from the GRACE-GLDAS analysis reinforces the confidence in the simple piezometric analysis proposed here.
Regarding the overall groundwater budget using GRACE data, only an interannual analysis aiming at identifying long-term average flows such as recharge is proposed here. This is adapted to arid environments characterized by a lag time of sometimes several decades between rainfall and recharge related to thick vadose zones as discussed in Gonçalvès et al. [2021] or Séraphin et al. [2022]. However, in climatic and/or geological contexts where recharge is rapid, a seasonal analysis using GRACE data can be conducted [e.g., Pascal et al. 2022]. In addition, only one GLDAS soil model (CLMS) could be retained following the comparative analysis with the TWS signal, and uncertainties at each step (linear regression on GWS time series, pumping estimation, return flow) were proposed to quantify the uncertainty of each water budget terms. Similarly to Frappart [2020], this study indicates a very small groundwater storage change for the TAS. However, a slight decrease in GWS of 0.7 mm⋅yr−1 was obtained here and not a slight increase of about 0.2 mm⋅yr−1 as previously proposed. This increase can be explained by an erroneous circular domain considered in Frappart [2020] rather centered on the west of the actual TAS basin, which was indeed found in slight gain in the present study. Finally, the discharge of the Paleozoic aquifers at the northwestern limit in the downstream valley of the Drâa River suggested by the piezometric maps was not considered. However, a possible loss of this natural outflow caused by pumping is discussed below.
An almost homogeneous land use and climate enables a direct comparison between the recharge of 0.8 ± 0.2 mm⋅yr−1 identified here for the TAS during the period 2002–2020 for a long-term value of AAR at 55 mm⋅yr−1 with the values previously obtained for the other regional-scale aquifers of the Saharan belt. These aquifers are the Nubian Sandstone Aquifer System (NSAS, 2.2 × 10⁶ km2 of surface area over Egypt, Libya, Chad, and Sudan), the Murzuk aquifer (0.64 × 10⁶, km2 of surface area over Libya, Niger and Algeria) and the Northwestern Sahara aquifer system (NWSAS, 106 km2 of extension over Algeria, Tunisia and Libya). For the NSAS, a previous study by Mohamed et al. [2017] yielded a recharge over the entire domain of 0.48 ± 0.63 mm⋅yr−1 for an AAR of 36 mm⋅yr−1. The recharge of the Murzuk aquifer was estimated at 0.25 ± 0.40 mm⋅yr−1 by Mohamed and Gonçalvès [2021] for an AAR of 25 mm⋅yr−1. Here it is assumed that GRACE-derived recharge values are good estimates of long term values for the three aquifers. Using GRACE data and a global groundwater mass balance, a recharge of 1.76 ± 0.44 mm⋅yr−1 was derived for the NWSAS by Mohamed and Gonçalvès [2021] for a long-term value of AAR at 75 mm⋅yr−1. When plotted against the AAR, recharge values for the different transboundary aquifers of the African Saharan belt show a good consistency and represent a small fraction of AAR, i.e. about 1.5 ± 0.6%.
Here a value of 225 ± 51 × 106 m3⋅yr−1 for the overall groundwater evaporation was obtained. Distributed over the 3550 km2 of surface area for the salt pans this represents an evaporation rate of 63 ± 14 mm⋅yr−1 and a basin-scale average of 0.9 ± 0.2 mm⋅yr−1. Local values were obtained by Fontes et al. [1986] by means of stable isotopes of water profiles through the vadose zone in southwestern Algerian Sahara close to the TAS. An evaporation value of 2.3 mm⋅yr−1 was identified for a water table depth at 8 m. An intermediate scale study by Schulz et al. [2015] for a sebkha system covering a surface area of 3600 km2 in southwestern Saudi Arabia yielded a value of 39 mm⋅yr−1 using soil column experiments to obtain a relation between evaporation rate and temperature, relative humidity and water level for spatial distribution and domain averaging purposes. Large scale values are also available for two arid domains. The first one is the Central Kalahari basin in Southern Africa where a regional scale value of 1.87 mm⋅yr−1 was obtained using a calibrated hydrogeological model of this 195,000 km2 surface area domain. Hydrogeological modeling of the NWSAS [Baba-Sy 2005] led to an estimate on the order of 190 × 106 m3⋅yr−1 (35 mm⋅yr−1) for the evaporation flux in the Chott Djérid.
Recharge and evaporation were identified on the two presumably independent sub-basins on which groundwater budgets were established based on GRACE-GLDAS data. These two budgets must now be separately interpreted to explain possible causes of imbalance which are also valid for the entire TAS whose groundwater balance cannot be directly estimated. An incautious analysis of the reconstructed overall water balance of the TAS could lead to misinterpretation such as a groundwater depletion caused only by pumping, which is inconsistent with the minimum 𝛥GWS values (largest depletion) in the non-pumping southeastern area. The western part of the TAS is at hydrodynamic equilibrium despite pumping, which is only possible if some groundwater discharge that naturally balanced the recharge has dried up. This natural discharge may correspond to the topographical low in the lower Drâa valley (Section 2.3), i.e. within the pumping area. The overall groundwater depletion of the TAS is therefore entirely attributed to the eastern part. Regardless of pumping, the groundwater budget of the eastern sub-basin is “naturally” unbalanced since recharge is lower than evaporation (0.7 and 1.5 mm⋅yr−1, see Figure 6). This contributes −0.8 mm⋅yr−1 (≈60%) to the overall balance of −1.3 mm⋅yr−1 in this sub-domain. A recent increase in evaporation e.g. associated with the ongoing global warming or a past higher recharge and thus lateral groundwater drainage in equilibrium with evaporation then a reduction of the former can be invoked to explain the unbalanced evaporation. Evaporation from the water table is controlled by the depth of the free surface but also by climatologic variables [soil surface atmospheric air temperature and relative humidity, see e.g. Kamai and Assouline 2018] that can vary on interannual or even long-term time scales. Regarding recharge variations, the few available values for the hydraulic parameters (Section 2.3) together with recharge–discharge distances of several hundreds of km suggest characteristic times [Rousseau-Gueutin et al. 2013] for the TAS aquifers of several thousand years and point to the Holocene period for such variations. The remaining 40% of the eastern sub-basin negative groundwater budget is due to pumping. These contributions of evaporation and pumping to the negative groundwater balance also apply to the entire TAS upon surface averaging since the western subbasin is budget neutral.
6. Conclusions
The combined geological, geomorphological and land surface analysis conducted here concluded to a topographically-driven conceptual model for the groundwater hydrodynamics of the TAS involving at least one recharge area, the Anti-Atlas piedmont, and one major discharge area through groundwater evaporation located on the southeastern boundary of the basin where the highest density of salt pans (sebkhas) was found. Based on abundant geological information notably related to petroleum engineering studies, more realistic geographical limits than those considered so far in IGRAC (International Groundwater Resources Assessment Centre) [2015], and therefore with a relevant hydrodynamic significance, were proposed. The piezometric sketches, in good general agreement with our conceptual model, provide however more valuable insights. A second recharge area, i.e. the Hamada plateau for the Hamadian and the Carboniferous aquifers and the southwestern border for the Devonian and Cambro-Ordovician aquifers, was identified. In addition, a second discharge area on the northwest boundary of the TAS (downstream valley of the Drâa), which may be drying up, is suggested by the water levels for the Paleozoic aquifers. However, these results could be further established if additional water level data were available to obtain more reliable piezometric contour maps. A quantitative analysis of the groundwater mass balance was conducted using GRACE-GLDAS data leading to the conclusion of an overall depletion of the basin of about −0.7 mm⋅yr−1 (178.5 × 10⁶ m3⋅yr−1). More precise water budget calculations identified separately the domain-averaged evaporation at 0.9 ± 0.2 mm⋅yr−1 (225 ± 51 × 106 m3⋅yr−1) and the recharge at 0.8 ± 0.2 mm⋅yr−1 (196 ± 51 × 106 m3⋅yr−1), confirming the endorheic behavior of the TAS. The depletion of the TAS attributed here to evaporation and withdrawals is however more moderate than in the other basins of the Saharan belt due to a relatively low exploitation of the aquifers.
Conflicts of interest
Authors have no conflict of interest to declare.