

1 Introduction
Despite the fact that they are commonly used for drinking water, recreation, irrigation, and fishing, there have been surprisingly few studies looking at the effect of the sediment-water interaction on the chemistry of lakes and reservoirs. Several studies have focused on how sediment-lake water interaction could affect the availability of essential nutrients such as phosphorous (e.g. House, 2003; Lijklema, 1993; Smits and Vandermolen, 1993). Other studies have investigated how lake sediments can influence the aqueous concentration of toxic or trace metals, such as mercury (Vandal et al., 1995; Wolfenden et al., 2005) and other heavy metals (Gonzalez et al., 2000; Owens et al., 2005). To date, little is available on the rates of dissolution of major elements into lakes. This study attempts to fill, in part, this knowledge gap through a series of controlled laboratory experiments investigating the dissolution rates of Oued Cherf lake sediments in its waters.
The geology near the Oued Cherf lake has been described in detail by Vila (1980). The region is composed of sedimentary rocks from Trias to Quaternary in age; these rocks are dominated by limestones, sandstones, evaporates, and marls. The Oued Cherf lake (Fig. 1), began to fill following completion of its dam in 1994. This lake has a total capacity of 160 million m3 of water, which is intended primarily for the irrigation of 1700 hectares of farmland. The hydrology of the watershed is dominated by the Oued Cherf, Oued Settara, Oued Mellah Kebira and Oued Melleh Seghira rivers. The Oued Cherf river, which enters the lake from the southeast, is the most important. It has an average flow of 5 m3/s in winter and 0.02 m3/s in summer. The climate is semi-arid with an average annual rainfall of 300 mm. Temperatures average 27 °C in the summer and 5 °C in the winter. Annual evapotranspiration is estimated to be approximately 270 mm representing 90% of the total rainfall.
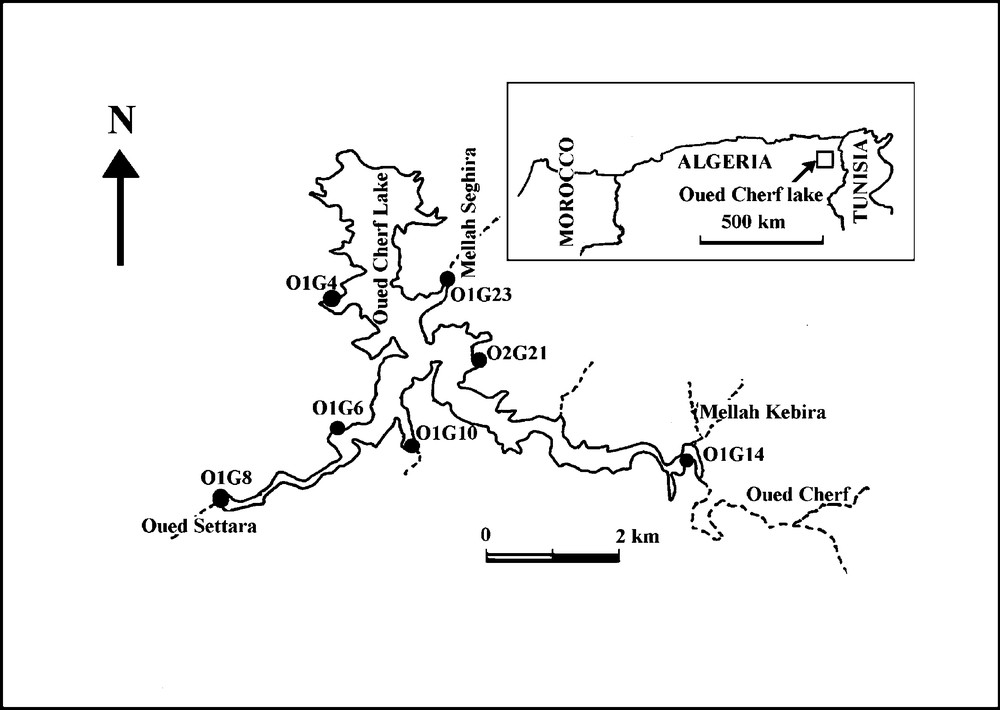
Location of the samples collected within the Oued Cherf Lake in the present study.
Localisation des échantillons prélevés dans le barrage d’Oued Cherf lors de la présente étude.
A large number of studies have been performed to quantify the dissolution rates of the major rock forming minerals from laboratory experiments (e.g. Brantley, 2008; Oelkers, 2001; Schott et al., 2009; Sverdrup, 1990; White and Brantley, 1995). The applicability of such studies to natural systems has been questioned, as ‘field’ based rates at times appear to be significantly lower then their laboratory based counterparts (e.g. Ganor et al., 2007; White and Brantley, 2003). These differences may stem from a number of sources including the effects of reaction affinity and secondary minerals (e.g. Maher et al., 2009; Zhu, 2005; Zhu and Lu, 2009), mineral age (e.g. Hodson and Langan, 1999; White, 1995), and difficulties in quantifying mineral dissolution/precipitation rates in the field (e.g. Hacini et al., 2008). This study is motivated in part to aid in the further understanding of such differences by studying the dissolution rates of lake sediments in their coexisting fluids in the laboratory. Natural sediments are in many ways similar to the material used in laboratory dissolution experiments. Whereas laboratory dissolution rates are commonly performed on minerals that have been ground and cleaned, natural sediments are ground during their transport and regularly cleaned by their interaction with flowing fluids. By dissolving sediments in the fluids that coexisted with them in nature we can mimic as close as possible the dissolution rates of these sediments in the natural environment.
2 Methods
Experiments were performed in 120 ml closed-system batch reactors similar to those described by Harouiya et al. (2007). Approximately 0.5 g of sediment was placed into each reactor, together with ∼80 ml of the corresponding lake water sample. These reactors were sealed and placed a 25 °C temperature controlled oven. Each reactor was shaken by hand every 48 hours. Fluid samples were regularly taken from these reactors through 0.45 μm Millipore Nitrocellulose filters and stored till analysis.
The sediments used in these experiments were obtained by direct sampling from the bottom of the Oued Cherf near the lake edge; sample locations are shown in Fig. 1. These sediments were air dried and used in these experiments without further preparation. The dried sediments were characterized by X-ray diffraction, scanning electron microscopy (SEM), and X-ray fluorescence. X-ray diffraction measurements, performed using an INCEL CPS 120 diffractometer with Coradiation (λ = 1.78 Å), indicates that these sediments are comprised of quartz, calcite, clay minerals, and minor iron oxides and sulfate minerals. SEM images of some of the sediments, obtained using a JEOL JSM-6360LV Scanning Electron Microscope, are shown in Fig. 2. The sediments consist of grains that are less than 100 μm in size, the bulk of the grains are considerably smaller. Some of the larger grains are agglomerates containing particles of various minerals. The chemical compositions of these solids as determined by X-ray fluorescence using a Panalytical PW2400 are shown in Table 1. The compositions vary considerably sample to sample; the SiO2 content of these samples range from 18 to 78%. The surface area of these sediments was determined by the three-point BET method (Brunauer et al., 1938) using N2 gas. The results of these analyses are summarized in Table 1; surface areas range from 16 to 45 cm2/g.

SEM photomicrographs of two of the sediment samples dissolved in the present study: a) Sample O1G4S, b) Sample O1G6S, c) an enlargement of the boxed section of b. The abbreviations on the figure correspond to the identity of the mineral grains: qz = quartz, ca = calcite, of = iron oxide, ar = clays, ba = barite, bi = biotite.
Images MEB de deux des échantillons de sédiments mis en solution au cours de cette étude : a) Echantillon O1G4S, b) Echantillon O1G6S, c) Détail de la zone encadrée b. Les abréviations sur la figure correspondent aux noms des minéraux : qz = quartz, ca = calcite, of = oxydes de fer, ar = argiles, ba = barite, bi = biotite.
Composition des solides utilisés dans la présente étude, déterminée par fluorescence X.
| % Oxides | O1G04S | O1G06S | O1G08S | O1G10S | O1G14S | O1G23S | O2G21S |
| SiO2 | 77.89 | 31.77 | 35.74 | 18.17 | 44.85 | 57.89 | 48.1 |
| Al2O3 | 3.44 | 3.38 | 11.79 | 4.57 | 15.00 | 9.35 | 5.41 |
| Fe2O3 | 3.21 | 4.35 | 5.71 | 2.62 | 7.34 | 7.08 | 4.74 |
| MnO | 0.03 | 0.08 | 0.06 | 0.03 | 0.08 | 0.18 | 0.09 |
| MgO | – | 0.59 | 1.47 | 0.87 | 1.86 | 1.65 | 1.08 |
| CaO | 7.73 | 32.11 | 19.59 | 50.56 | 23.3 | 7.13 | 22.21 |
| Na2O | – | – | – | – | 2.1 | 1.51 | – |
| K2O | 0.4 | 0.5 | 0.81 | 0.67 | 1.7 | 1.29 | 0.82 |
| P2O5 | 0.06 | 0.08 | 0.14 | 0.04 | 0.18 | 0.15 | 0.09 |
| TiO2 | 0.3 | 0.27 | 0.58 | 0.35 | – | 0.66 | 0.45 |
| Pfa | 6.2 | 26.23 | 23.4 | 21.7 | 2.2 | 10.5 | 16.3 |
| Cl | – | 0.02 | 0.08 | – | 1.05 | 0.96 | 0.09 |
| Total | 99.26 | 99.36 | 99.29 | 99.58 | 98.61 | 97.39 | 99.29 |
| S.Ab | 15.69 | 16.46 | 44.97 | 30.07 | 47.21 | 15.79 | 38.9 |
a Loss on ignition.
b Surface area (m2/g).
The aqueous solutions used for the experiments were obtained from the same locations as the sediment samples as noted by the locations shown in Fig. 1. These aqueous solutions were collected in acid washed bottles and filtered through 0.45 μm Millipore Nitrocellulose filters prior to their use in the experiments. The composition of these solutions, as well as those collected during the experiments were determined by atomic absorption spectroscopy (AAS) with an uncertainty of ± 1% and a detection limit of 6 × 10⁻⁷ M, and ion chromatography using Dionex High Pressure Liquid Chromatograph (HPLC) with a precision of better than 8%. Alkalinity was determined by standard HCl titration with an uncertainty of ± 1% and a detection limit of 5 × 10⁻⁵ M. pH of all aqueous solutions was measured at 25 °C using a standard glass electrode. These measurements have a ± 0.02 uncertainty in pH. The pH measured in the laboratory is within 0.03 pH units of those measured originally in the field. The composition of the initial aqueous solutions is listed in Table 2.
Composition des solutions initiales utilisées dans la présente étude.
| Anions/cations | O1G04E | O1G06E | O1G08E | O1G10E | O1G14’E | O1G23E | O2G21E |
| Na (ppm) | 313.31 | 344.99 | 317.83 | 321.06 | 327.32 | 348.66 | 368.07 |
| Mg (ppm) | 57.42 | 58.32 | 60.54 | 56.92 | 57.24 | 58.21 | 61.83 |
| Cl (ppm) | 490.21 | 506.64 | 481.07 | 470.30 | 490.82 | 504.46 | 517.38 |
| K (ppm) | 20.92 | 24.56 | 18.98 | 19.87 | 19.78 | 20.35 | 19.90 |
| Ca (ppm) | 129.96 | 125.59 | 141.36 | 133.88 | 155.49 | 147.33 | 149.02 |
| SO4 (ppm) | 296.73 | 309.50 | 304.70 | 285.86 | 292.17 | 338.18 | 334.49 |
| HCO3 (mmol/l) | 1.80 | 1.56 | 2.93 | 2.12 | 3.15 | 2.56 | 2.50 |
| NO3 (ppm) | 32.81 | 33.45 | 38.71 | 33.63 | 32.09 | 34.69 | 24.38 |
| Si (ppm) | 1.63 | 1.67 | 2.22 | 1.64 | 1.64 | 1.77 | 1.35 |
| Al (ppb) | 0.78 | 1.72 | 4.03 | 0.33 | 2.00 | 15.53 | 1.16 |
| pH | 7.75 | 8.10 | 8.05 | 8.05 | 7.95 | 7.90 | 7.70 |
The saturation state of various mineral phases in these aqueous solutions was investigated via the PHREEQC (Parkhurst and Appelo, 1999) together with its LLNL database1. The results of these calculations are shown in Table 3. These solutions are close to equilibrium with respect to quartz and calcite, the minerals that dominate the sediments. These natural solutions are also undersaturated with respect to the sulfates gypsum and anhydrite, and various evaporate minerals (e.g. epsomite, hexahydrite). Interestingly calculations suggest these lake fluids are supersaturated with respect to the Al-oxihydroxide diaspore and the primary Al-silicate phases K-feldspar, kaolinite, and muscovite. This later results could stem from an overestimate in the activity of aqueous Al due to lack of characterization of potential Al-ligand complexes in solution.
Etat de saturation des solutions initiales et finales des expériences en tenant compte des phases calculées à l’aide de PHREEQC (Parkhurst et Appelo, 1999) avec sa base des données LLNL.
| Phases | O1G4E(0) | O1G4E(6) | O1G6E(0) | O1G6E(7) | O1G8E(0) | O1G8E(7) | O1G10E(0) | O1G10E(7) | O1G14’E(0) | O1G14’E(7) | O1G23E(0) | O1G23E(7) | O2G21E(0) | O2G21E(7) |
| Albite | −1.43 | 0.03 | −1.07 | −0.02 | −0.67 | 0.55 | −1.77 | 1.07 | −1.38 | 0.46 | −0.43 | −0.31 | −1.68 | −0.02 |
| Amesite-14A | −3.88 | 5.20 | −1.02 | 4.62 | 0.71 | 6.00 | −4.16 | 6.12 | −1.27 | 5.88 | 2.18 | 2.85 | −3.41 | 5.48 |
| Analcime | −1.45 | 0.02 | −1.13 | −0.04 | −0.78 | 0.37 | −1.81 | 0.80 | −1.35 | 0.32 | −0.45 | −0.39 | −1.61 | 0.02 |
| Anhydrite | −1.45 | −1.19 | −1.44 | −1.25 | −1.37 | −1.20 | −1.44 | −1.21 | −1.35 | −1.17 | −1.30 | −1.22 | −1.33 | −1.20 |
| Anorthite | −6.96 | −3.53 | −6.20 | −3.63 | −5.32 | −3.10 | −7.57 | −2.46 | −6.15 | −3.25 | −4.37 | −4.70 | −6.77 | −3.43 |
| Aragonite | −0.00 | 0.49 | 0.27 | 0.30 | 0.60 | 0.61 | 0.37 | 0.15 | 0.57 | 0.75 | 0.42 | 0.46 | 0.16 | 0.52 |
| Boehmite | 0.27 | 1.39 | 0.33 | 1.43 | 0.58 | 1.36 | −0.30 | 1.85 | 0.37 | 1.26 | 1.27 | 0.68 | 0.45 | 1.49 |
| Calcite | 0.15 | 0.63 | 0.42 | 0.45 | 0.75 | 0.75 | 0.52 | 0.30 | 0.72 | 0.89 | 0.56 | 0.60 | 0.31 | 0.67 |
| Chrysotile | −2.88 | 0.42 | −0.86 | −0.14 | −0.36 | 1.19 | −1.32 | −0.15 | −1.29 | 1.40 | −1.40 | 0.83 | −3.13 | 0.31 |
| Clinochlore-14A | −3.18 | 4.64 | 0.27 | 3.79 | 1.62 | 5.81 | −1.76 | 4.53 | −0.30 | 5.96 | 1.31 | 3.87 | −3.20 | 4.66 |
| Clinochlore-7A | −6.62 | 1.26 | −3.18 | 0.41 | −1.79 | 2.43 | −5.22 | 1.15 | −3.71 | 2.58 | −2.09 | 0.50 | −6.64 | 1.29 |
| Dawsonite | −1.14 | −0.09 | −1.22 | −0.17 | −0.80 | −0.12 | −1.73 | 0.20 | −0.99 | −0.08 | −0.16 | −0.81 | −0.93 | 0.04 |
| Diaspore | 0.69 | 1.80 | 0.74 | 1.84 | 0.99 | 1.77 | 0.12 | 2.26 | 0.78 | 1.66 | 1.68 | 1.08 | 0.87 | 1.89 |
| Diopside | −4.74 | −2.56 | −3.40 | −2.94 | −2.98 | −1.93 | −3.67 | −2.77 | −3.62 | −1.78 | −3.71 | −2.23 | −4.94 | −2.67 |
| Dolomite | 1.28 | 2.30 | 1.84 | 1.95 | 2.48 | 2.55 | 2.00 | 1.64 | 2.36 | 2.78 | 2.08 | 2.26 | 1.58 | 2.37 |
| Epsomite | −3.89 | −3.72 | −3.84 | −3.75 | −3.86 | −3.72 | −3.88 | −3.73 | −3.90 | −3.75 | −3.84 | −3.73 | −3.82 | −3.73 |
| Gibbsite | 0.14 | 1.20 | 0.19 | 1.24 | 0.42 | 1.17 | −0.42 | 1.66 | 0.21 | 1.07 | 1.10 | 0.49 | 0.31 | 1.30 |
| Gypsum | −1.19 | −1.0 | −1.16 | −1.06 | −1.14 | −1.02 | −1.16 | −1.03 | −1.12 | −0.99 | −1.08 | −1.04 | −1.08 | −1.02 |
| Hexahydrite | −4.12 | −3.95 | −4.08 | −3.99 | −4.09 | −3.96 | −4.11 | −3.97 | −4.14 | −3.98 | −4.08 | −3.97 | −4.05 | −3.96 |
| Illite | 0.51 | 3.15 | 1.14 | 3.02 | 1.81 | 3.70 | −0.36 | 4.96 | 0.77 | 3.38 | 2.84 | 1.80 | 0.52 | 3.03 |
| K-Feldspar | 0.34 | 1.37 | 0.89 | 1.07 | 1.12 | 1.83 | 0.17 | 2.51 | 0.44 | 1.68 | 1.34 | 0.83 | 0.14 | 1.04 |
| Kaolinite | 0.83 | 2.83 | 0.99 | 2.95 | 1.55 | 3.12 | −0.22 | 4.27 | 0.88 | 2.82 | 2.69 | 1.60 | 0.97 | 2.93 |
| Magnesite | −0.54 | 0.05 | −0.26 | −0.12 | 0.08 | 0.17 | −0.20 | 0.29 | −0.01 | 0.26 | −0.13 | 0.03 | −0.39 | 0.08 |
| Montmor-Ca | 0.46 | 2.51 | 0.98 | 2.55 | 1.62 | 3.22 | −0.07 | 4.13 | 0.66 | 2.92 | 2.18 | 1.74 | 0.34 | 2.47 |
| Montmor-K | 0.23 | 2.16 | 0.78 | 2.10 | 1.35 | 2.83 | −0.29 | 3.80 | 0.39 | 2.54 | 1.91 | 1.33 | 0.09 | 2.02 |
| Montmor-Mg | 0.54 | 2.60 | 1.06 | 2.64 | 1.70 | 3.31 | 0.00 | 4.22 | 0.73 | 3.00 | 2.25 | 1.83 | 0.41 | 2.56 |
| Montmor-Na | 0.33 | 2.38 | 0.82 | 2.40 | 1.44 | 3.07 | −0.25 | 3.99 | 0.46 | 2.80 | 1.99 | 1.62 | 0.17 | 2.34 |
| Muscovite | 2.20 | 5.43 | 2.85 | 5.21 | 3.58 | 5.83 | 0.89 | 7.49 | 2.48 | 5.46 | 5.17 | 3.46 | 2.35 | 5.30 |
| Nesquehonite | −3.58 | −2.97 | −3.31 | −3.14 | −2.95 | −2.85 | −3.26 | −3.30 | −3.04 | −2.76 | −3.15 | −2.98 | −3.43 | −2.94 |
| Paragonite | −0.49 | 3.19 | −0.03 | 3.22 | 0.87 | 3.65 | −1.96 | 5.15 | −0.25 | 3.35 | 2.49 | 1.42 | −0.38 | 3.34 |
| Pentahydrite | −4.46 | −4.29 | −4.42 | −4.33 | −4.43 | −4.30 | −4.45 | −4.30 | −4.48 | −4.32 | −4.42 | −4.31 | −4.39 | −4.30 |
| Phlogopite | −1.05 | 3.48 | 1.46 | 2.58 | 2.12 | 4.36 | 0.25 | 3.53 | 0.77 | 4.50 | 1.53 | 3.16 | −1.29 | 3.14 |
| Pyrophyllite | −0.97 | 0.93 | −0.76 | 1.08 | −0.08 | 1.56 | −1.95 | 2.88 | −1.02 | 1.17 | 0.83 | −0.11 | −1.02 | 0.92 |
| Quartz | −0.05 | −0.14 | −0.02 | −0.12 | 0.02 | 0.03 | −0.00 | 0.12 | −0.11 | −0.01 | −0.10 | −0.04 | −0.15 | −0.19 |
| Sepiolite | −6.15 | −2.17 | −3.36 | −2.86 | −2.62 | −0.57 | −3.90 | −2.09 | −4.29 | −0.45 | −4.41 | −1.31 | −6.85 | −2.50 |
3 Results
The temporal evolution of the aqueous phase composition during all closed-system experiments are listed in Table 4. The solutions sampled during each experiment are denoted sequentially by the number in parentheses in this table. The concentrations of a number of elements changed substantially at the onset of the experiments. The aqueous concentrations of Na, K, Al, Si, Cl, and SO4 tend to increase notably once the sediments are introduced into the lake water. In contrast, the aqueous concentration of calcium dropped appreciably during the first few minutes of each experiment. The initial release of NO3 and alkalinity to aqueous solution shows no clear trend.
Évolution de la composition des solutions lors des expériences menées dans cette étude.
| O1G4S + O1G4E | O1G4E(0) | O1G4E(1) | O1G4E(2) | O1G4E(3) | O1G4E(4) | O1G4E(5) | O1G4E(6) | |
| Time (s) | 0.00E + 00 | 3.07E + 05 | 5.70E + 05 | 1.29E + 06 | 2.59E + 06 | 5.26E + 06 | 7.83E + 06 | |
| pH | 8.05 | 7.97 | 7.95 | 7.96 | 8.03 | 8.14 | 8.09 | |
| Si (ppm) | 1.63 | 1.73 | 1.74 | 1.77 | 1.76 | 1.79 | 1.96 | |
| Ca (ppm) | 129.96 | 121.13 | 121.46 | 122.65 | 118.14 | 135.45 | 145.54 | |
| Na (ppm) | 313.31 | 334.99 | 322.71 | 323.75 | 359.44 | 369.22 | 399.83 | |
| K (ppm) | 20.92 | 46.44 | 21.78 | 19.13 | 16.68 | 17.24 | 13.66 | |
| Mg (ppm) | 57.42 | 58.08 | 54.41 | 55.58 | 57.00 | 61.14 | 68.18 | |
| Cl (ppm) | 490.21 | 595.35 | 581.03 | 580.63 | 599.70 | 623.11 | 700.21 | |
| SO4 (ppm) | 296.73 | 388.26 | 386.85 | 388.38 | 402.85 | 418.14 | 457.53 | |
| NO3 (ppm) | 32.81 | 32.45 | 32.44 | 33.84 | 35.03 | 37.11 | 45.14 | |
| Alc, (mol/l) | 1.80E-03 | 2.00E-03 | 1.93E-03 | 1.94E-03 | 1.92E-03 | 1.92E-03 | 1.86E-03 | |
| Al (ppb) | 0.78 | 45.22 | 50.22 | 51.73 | 44.73 | 48.98 | 45.95 | |
| O1G6E + O1G6S | O1G6E(0) | O1G6E(1) | O1G6E(2) | O1G6E(3) | O1G6E(4) | O1G6E(5) | O1G6E(6) | O1G6E(7) |
| Time (s) | 0.00E + 00 | 8.88E + 04 | 1.74E + 05 | 1.04E + 06 | 2.34E + 06 | 4.93E + 06 | 7.61E + 06 | 1.02E + 07 |
| pH | 8.08 | 7.99 | 8.00 | 7.94 | 7.94 | 7.81 | 7.98 | 8.00 |
| Si (ppm) | 1.67 | 1.70 | 1.71 | 1.73 | 1.78 | 1.78 | 1.86 | 2.03 |
| Ca (ppm) | 127.04 | 116.41 | 117.20 | 115.92 | 116.66 | 122.80 | 123.01 | 130.62 |
| Na (ppm) | 334.82 | 337.61 | 330.02 | 329.99 | 334.58 | 342.90 | 351.54 | 346.71 |
| K (ppm) | 24.56 | 61.45 | 43.25 | 72.80 | 61.36 | 12.73 | 14.58 | 6.74 |
| Mg (ppm) | 58.32 | 59.52 | 56.62 | 56.16 | 57.92 | 57.66 | 60.21 | 63.75 |
| Cl (ppm) | 506.64 | 601.00 | 616.56 | 627.24 | 617.67 | 589.99 | 602.94 | 626.81 |
| SO4 (ppm) | 309.50 | 387.64 | 396.49 | 398.37 | 390.61 | 397.74 | 405.93 | 421.68 |
| NO3 (ppm) | 33.45 | 32.76 | 33.50 | 34.13 | 33.00 | 34.13 | 34.71 | 36.94 |
| Alc, (mol/l) | 1.56E-03 | 1.66E-03 | 1.65E-03 | 1.62E-03 | 1.62E-03 | 1.59E-03 | 1.64E-03 | 1.59E-03 |
| Al (ppb) | 1.72 | 31.99 | 31.99 | 34.28 | 35.39 | 35.73 | 36.30 | 41.05 |
| O1G8S + O1G8E | O1G8E(0) | O1G8E(1) | O1G8E(2) | O1G8E(3) | O1G8E(4) | O1G8E(5) | O1G8E(6) | O1G8E(7) |
| Time (s) | 0.00E + 00 | 2.54E + 05 | 5.16E + 05 | 1.23E + 06 | 2.53E + 06 | 5.21E + 06 | 7.77E + 06 | 1.04E + 07 |
| pH | 8.36 | 8.09 | 8.11 | 8.16 | 8.11 | 8.12 | 8.13 | 8.16 |
| Si (ppm) | 2.22 | 2.64 | 2.63 | 2.78 | 2.75 | 2.78 | 2.89 | 2.93 |
| Ca (ppm) | 141.36 | 139.96 | 131.36 | 138.00 | 142.14 | 140.41 | 140.62 | 145.33 |
| Na (ppm) | 317.83 | 323.84 | 324.80 | 331.44 | 336.76 | 341.01 | 350.97 | 359.04 |
| K (ppm) | 18.98 | 44.32 | 16.01 | 17.49 | 14.80 | 15.51 | 9.91 | 10.79 |
| Mg (ppm) | 60.54 | 61.79 | 58.65 | 58.56 | 58.95 | 61.18 | 65.78 | 67.77 |
| Cl (ppm) | 481.07 | 589.64 | 565.37 | 576.89 | 573.07 | 594.72 | 596.37 | 645.21 |
| SO4 (ppm) | 304.70 | 393.85 | 391.18 | 399.85 | 399.68 | 415.22 | 415.89 | 442.29 |
| NO3 (ppm) | 38.71 | 38.67 | 38.56 | 40.00 | 40.57 | 41.31 | 43.96 | 48.33 |
| Alc, (mol/l) | 2.93E-03 | 3.06E-03 | 3.05E-03 | 2.97E-03 | 2.83E-03 | 2.72E-03 | 2.43E-03 | 2.07E-03 |
| Al (ppb) | 4.03 | 45.13 | 48.88 | 43.81 | 50.11 | 46.41 | 43.41 | 50.12 |
| O1G10S + O1G10E | O1G10E(0) | O1G10E(1) | O1G10E(2) | O1G10E(3) | O1G10E(4) | O1G10E(5) | O1G10E(6) | O1G10E(7) |
| Time (s) | 0.00E + 00 | 3.07E + 05 | 5.68E + 05 | 1.29E + 06 | 2.58E + 06 | 5.26E + 06 | 7.83E + 06 | 1.04E + 07 |
| pH | 8.01 | 7.84 | 7.92 | 7.92 | 7.82 | 7.83 | 7.89 | 7.91 |
| Si (ppm) | 1.64 | 2.57 | 2.77 | 2.84 | 2.96 | 3.16 | 3.17 | 3.50 |
| Ca (ppm) | 133.88 | 120.67 | 118.72 | 115.95 | 122.57 | 125.79 | 135.97 | 143.50 |
| Na (ppm) | 321.06 | 328.49 | 329.51 | 324.55 | 333.86 | 356.90 | 348.43 | 387.71 |
| K (ppm) | 19.87 | 50.01 | 21.29 | 17.84 | 17.57 | 18.53 | 12.21 | 16.67 |
| Mg (ppm) | 56.92 | 58.31 | 54.63 | 55.17 | 55.73 | 51.02 | 60.69 | 67.26 |
| Cl (ppm) | 470.30 | 596.16 | 590.10 | 581.82 | 598.33 | 614.01 | 605.40 | 684.46 |
| SO4 (ppm) | 285.86 | 389.31 | 392.25 | 390.33 | 401.50 | 412.03 | 404.21 | 442.82 |
| NO3 (ppm) | 33.63 | 32.85 | 35.47 | 32.78 | 34.30 | 34.78 | 34.70 | 41.27 |
| Alc, (mol/l) | 2.12E-03 | 1.68E-03 | 1.64E-03 | 1.61E-03 | 1.56E-03 | 1.56E-03 | 1.45E-03 | 1.30E-03 |
| Al (ppb) | 0.33 | 90.98 | 84.43 | 87.14 | 86.28 | 84.58 | 82.88 | 88.75 |
| O1G14S + O1G14’E | O1G14’E(0) | O1G14’E(1) | O1G14’E(2) | O1G14’E(3) | O1G14’E(4) | O1G14’E(5) | O1G14’E(6) | O1G14’E(7) |
| Time (s) | 0.00E + 00 | 2.53E + 05 | 5.15E + 05 | 1.24E + 06 | 2.54E + 06 | 5.21E + 06 | 7.77E + 06 | 1.04E + 07 |
| pH | 8.41 | 8.18 | 8.18 | 8.19 | 8.12 | 8.15 | 8.19 | 8.22 |
| Si (ppm) | 1.64 | 2.04 | 2.06 | 2.27 | 2.37 | 2.50 | 2.61 | 2.66 |
| Ca (ppm) | 155.49 | 144.03 | 116.86 | 145.18 | 148.42 | 151.68 | 153.93 | 159.22 |
| Na (ppm) | 327.32 | 379.53 | 327.09 | 390.55 | 376.73 | 396.88 | 502.28 | 447.17 |
| K (ppm) | 19.78 | 32.11 | 12.73 | 20.89 | 16.26 | 16.10 | 10.27 | 11.62 |
| Mg (ppm) | 57.24 | 57.27 | 46.88 | 55.09 | 56.05 | 58.63 | 66.91 | 66.04 |
| Cl (ppm) | 490.82 | 645.83 | 542.49 | 631.53 | 657.86 | 660.80 | 677.12 | 748.44 |
| SO4 (ppm) | 292.17 | 398.80 | 339.67 | 395.00 | 413.43 | 414.79 | 421.80 | 456.65 |
| NO3 (ppm) | 32.09 | 37.36 | 32.13 | 37.54 | 40.32 | 41.21 | 43.38 | 49.88 |
| Alc, (mol/l) | 3.15E-03 | 3.33E-03 | 3.13E-03 | 3.08E-03 | 3.07E-03 | 3.05E-03 | 2.76E-03 | 2.38E-03 |
| Al (ppb) | 2.00 | 45.08 | 42.64 | 43.83 | 43.46 | 43.14 | 45.50 | 45.56 |
| O1G23S + O1G23E | O1G23E(0) | O1G23E(1) | O1G23E(2) | O1G23E(3) | O1G23E(4) | O1G23E(5) | O1G23E(6) | O1G23E(7) |
| Time (s) | 0.00E + 00 | 2.39E + 05 | 5.02E + 05 | 1.22E + 06 | 2.52E + 06 | 5.19E + 06 | 7.76E + 06 | 1.03E + 07 |
| pH | 8.16 | 8.10 | 8.11 | 8.13 | 8.07 | 8.11 | 8.10 | 8.13 |
| Si (ppm) | 1.77 | 1.93 | 1.99 | 2.09 | 2.11 | 2.25 | 2.44 | 2.45 |
| Ca (ppm) | 147.33 | 136.97 | 132.75 | 132.64 | 140.11 | 140.52 | 139.59 | 140.89 |
| Na (ppm) | 348.66 | 389.45 | 393.65 | 432.92 | 395.13 | 405.90 | 414.47 | 439.05 |
| K (ppm) | 20.35 | 27.41 | 24.26 | 11.69 | 15.01 | 13.51 | 7.44 | 9.55 |
| Mg (ppm) | 58.21 | 60.01 | 57.65 | 56.80 | 58.53 | 48.80 | 63.87 | 67.38 |
| Cl (ppm) | 504.46 | 684.78 | 677.54 | 673.43 | 690.69 | 693.80 | 708.99 | 779.42 |
| SO4 (ppm) | 338.18 | 411.33 | 409.06 | 408.35 | 419.05 | 420.60 | 424.47 | 450.71 |
| NO3 (ppm) | 34.69 | 34.14 | 33.82 | 33.90 | 35.52 | 35.80 | 36.80 | 41.19 |
| Alc, (mol/l) | 2.56E-03 | 2.15E-03 | 2.12E-03 | 2.09E-03 | 2.02E-03 | 1.96E-03 | 1.86E-03 | 1.66E-03 |
| Al (ppb) | 15.53 | 10.10 | 9.21 | 10.49 | 9.70 | 11.07 | 9.62 | 9.81 |
| O2G21E + O2G21S | O2G21E(0) | O2G21E(1) | O2G21E(2) | O2G21E(3) | O2G21E(4) | O2G21E(5) | O2G21E(6) | O2G21E(7) |
| Time (s) | 0.00E + 00 | 8.97E + 04 | 1.73E + 05 | 1.03E + 06 | 2.34E + 06 | 4.93E + 06 | 7.61E + 06 | 1.02E + 07 |
| pH | 8.21 | 8.18 | 8.21 | 8.16 | 8.14 | 8.05 | 8.08 | 8.09 |
| Si (ppm) | 1.35 | 1.40 | 1.40 | 1.46 | 1.50 | 1.54 | 1.59 | 1.74 |
| Ca (ppm) | 149.02 | 142.93 | 145.26 | 142.36 | 140.08 | 140.30 | 141.75 | 146.35 |
| Na (ppm) | 368.07 | 415.53 | 388.54 | 380.53 | 402.93 | 369.63 | 373.38 | 404.86 |
| K (ppm) | 19.90 | 34.94 | 25.30 | 40.22 | 39.57 | 12.26 | 11.97 | 7.29 |
| Mg (ppm) | 61.83 | 58.47 | 59.48 | 58.24 | 59.95 | 59.91 | 62.12 | 67.57 |
| Cl (ppm) | 517.38 | 646.03 | 654.45 | 693.86 | 650.51 | 629.24 | 659.87 | 696.62 |
| SO4 (ppm) | 334.49 | 411.57 | 415.66 | 427.51 | 410.54 | 412.52 | 432.65 | 451.15 |
| NO3 (ppm) | 24.38 | 23.32 | 23.66 | 24.46 | 23.52 | 24.68 | 27.66 | 29.50 |
| Alc, (mol/l) | 2.50E-03 | 2.72E-03 | 2.73E-03 | 2.62E-03 | 2.56E-03 | 2.33E-03 | 2.30E-03 | 2.00E-03 |
| Al (ppb) | 1.16 | 44.09 | 45.04 | 54.79 | 59.93 | 60.79 | 58.56 | 57.67 |
Following this initial period the aqueous concentrations of Si, Ca, Na, Mg, Cl, SO4, and NO3 increase systematically with time, which is consistent with mineral dissolution. To quantify the release rates of these elements, the mass of each element in the total fluid phase of each experiment (equal to the element present in the fluid in the reactor and that in the fluids sampled previously from the reactor) was determined from
| (1) |
where Mi stands for the mass of the ith element in the fluid phase, ci,r corresponds to the concentration of this element in the fluid phase present in the reactor, ci,n represents this concentration in the nth fluid sample, and Vr and Vn denote the mass of fluid present in the reactor and taken during the nth sample, respectively. Masses of elements present in the aqueous phase from the latter part of three representative experiments are presented in Fig. 3. Element release rates (ri) were obtained from these masses using
| (2) |

Regression plots of the temporal evolution of major element fluxes into the reactive fluids during three representative experiments performed in the present study. The symbols correspond to measured fluxes, whereas the lines correspond to a linear least squares fit of these data. The element release rates consistent with these linear fits are provided on the plots.
Variation en fonction du temps des flux des éléments vers les solutions réactives, lors de trois expériences représentatives. Les symboles correspondent aux flux mesurés et les courbes représentent les régressions linéaires des données. Les vitesses de départ des éléments déduits de ces courbes sont reportées dans la figure.
where t denotes time, and sBET corresponds to the BET surface area of the sediments present in the reactor. Linear regressions of Mi versus time were performed on all experiments performed in this study. Examples of these regressions are shown in Fig. 3. These regressions were made on the final 5–7 fluid samples from each experiment to avoid the initial effects described above. For the most part these linear regressions provide an excellent description of the temporal evolution of Mi. In some cases, however, the distributions of aqueous concentrations exhibit a decrease in slope with time during the experiments, consistent with slowing dissolution rates. The slowing of dissolution rates could stem from an approach to equilibrium of the aqueous fluid with respect to one or more minerals in the sediments (c.f. Schott and Oelkers, 1995). In such instances rates computed from the first two and last two measured aqueous concentrations in Fig. 3 differ from that of the regression curve by no more than a factor of 2. The slope of the regression curves in Fig. 3 corresponds to ∂Mi/∂t. These slopes were used to calculate element release rates using Eq. (2). The results of this calculation are summarized in Table 5. Note that the evolution of aqueous Al concentration tend to remain nearly constant, likely due to the combination of the dissolution of Al-bearing phases coupled to Al-hydroxide precipitation. In contrast to the other elements, the long-term aqueous K concentrations and alkalinity tend to decrease throughout the experiments.
Logarithmes des vitesses de départ des éléments en solution lors des expériences menées dans la présente étude.
| Log r (mol/cm2/s) | O1G4 | O1G6 | O1G8 | O1G10 | O1G14 | O1G23 | O2G21 |
| Log r (Si) | −18.42 | −17.75 | −18.06 | −17.53 | −17.78 | −17.43 | −18.16 |
| Log r (Ca) | −16.6 | −16.22 | −16.66 | −16.49 | −16.2 | −16.25 | −17.16 |
| Log r (Na) | −15.9 | −15.75 | −15.96 | −15.79 | −16.38 | −15.36 | −16.64 |
| Log r (Mg) | −16.6 | −16.38 | −16.66 | −16.71 | −16.38 | −16.51 | −16.94 |
| Log r (Cl) | −15.9 | −15.92 | −15.96 | −15.88 | −15.68 | −15.51 | −15.94 |
| Log r (SO4) | −16.42 | −16.23 | −16.66 | −16.49 | −16.2 | −16.3 | −16.64 |
| Log r (NO3) | −17.12 | −16.92 | −17.18 | −17.19 | −16.84 | −16.91 | −17.16 |
Calculated element release rates of Si, Ca, Na, Mg, Cl, SO4, and NO3 are remarkably consistent experiment to experiment and element to element. Logarithms of Si release rates in units of mol/cm2/s, vary only from −18.4 to −17.4; those of Mg vary only from −16.4 to −16.9. The fastest measured released element is Na, the logarithm of its release rates are as high as −15.8, which is less than three orders of magnitude faster than that of the slowest measured element release rate in this study.
4 Discussion
The results presented above illustrate distinct behaviors between the initial and long-term element release rates into solution. At the onset of the closed-system experiments, the concentration of elements in the aqueous solution changed rapidly compared with their longer-term evolution. As these experiments consist of reacting lake sediments in the aqueous solutions collected simultaneously from the same locations it seems likely that this distinct initial behavior stems from the handling of the solutions and sediments between their collection and the beginning of the experiments. Three distinct processes that could contribute to the observed distinct initial behavior include:
- • the partial or complete equilibration of the lake water samples with the atmosphere;
- • the formation of soluble salts on the sediments during drying;
- • the precipitation of insoluble phases in the aqueous solution.
It seems likely that each of these processes contributed to the initial behavior of the experiments described above. Ca drops notably during the initial part of each experiment consistent with calcite precipitation and the observation that calcite is supersaturated in the initial aqueous fluids. This supersaturation could have stemmed from interaction of the lake water with the atmosphere following its collection. The rapid initial release of Na, K, Si, Cl, and SO4 suggests the rapid dissolution of soluble salts that could have formed during the drying of the sediments following their original sampling. The rapid rise in Al concentrations of the lake water could be due to Al hydroxide precipitation during the time between their sampling and their use in these experiments; note these lake samples are supersaturated with respect to diaspore. Once the experiments started, aqueous Al concentrations could increase due to the dissolution of Al-bearing phases (e.g. clay minerals).
The longer-term temporal variation of the aqueous phase composition stems from mineral reactions. The direct comparison of long-term element release rates determined above with dissolution and precipitation rates of individual minerals measured in the laboratory is challenging for a number of reasons. First, element release rates generated above are normalized to the surface area of the sediments whereas mineral dissolution/precipitation rates are normalized to the surface area of the individual minerals. It seems likely that the surface area of the sediments measured in the present study are dominated by those of clay minerals rather than that of other minerals present in the sediments (c.f. Sverdrup, 1990; Sverdrup and Warfvinge, 1993). Second, mineral dissolution rates depend strongly on saturation state and aqueous fluid composition (e.g. Oelkers, 2001; Schott et al., 2009). Accurate determination of the saturation state of many low-temperature minerals, such as clays, is challenging owing to current limitations in thermodynamic databases (Oelkers et al., 2009). Third, the mineral source of each element released into solution may be ambiguous as several minerals contain the same element.
Despite some of the challenges listed above, comparison between element release rates generated in this study with dissolution rates of individual minerals can provide insight into both lake water-sediment interaction and the degree to which one can use laboratory measured rates to model natural processes. One striking feature of the results of this study is that the long-term release rates of element measured in this study vary by only three orders of magnitude. This consistency contrasts with the large differences in the dissolution rates of the minerals containing of Si, Ca, Na, Mg, Cl, SO4, and NO3 present in the sediments as measured during laboratory experiments, which span by over 12 orders of magnitude. The near to neutral pH ‘far-from-equilibrium’ dissolution rates of halite are > 10−6 mol/(cm2 s) (Alkattan et al., 1997), of barite are ∼10−7.5 mol/(cm2 s) (Dove and Czank, 1995), of calcite are ∼10−9.8 mol/(cm2 s) (e.g. Cubillas et al., 2005; Plummer et al., 1978), of quartz are ∼10−17.7 mol/(cm2 s) (Brady and Walther, 1990) and those of the clay minerals montmorillonite are ∼10−18.2 mol/(cm2 s) (Rozalen et al., 2008), kaolinite are ∼10−18.2 mol/(cm2 s) (Huertas et al., 1999) and illite are 10–18.8 mol/(cm2 s) (Köhler et al., 2003). Possible reasons why the element release rates measured in the sediments are similar to one another and similar to that of the slow dissolving minerals are that the rapidly dissolving minerals either:
- • attain rapidly an equilibrium or close to equilibrium state, as appears to be the case for calcite;
- • rapidly consume all accessible material, which is likely the case for halite.
Measured element release rates are, however, close to those of the slow dissolving minerals, quartz and clays, suggesting these minerals are controlling the chemical evolution of the aqueous phase during our experiments. Nevertheless, the aqueous phase is close to equilibrium with respect to quartz, and supersaturated with respect to a large number of clay phases. It is, therefore, difficult to determine which phase dominates the overall dissolution of the sediments. As many of the sediment grains are agglomerates of a number of minerals, the dissolution of less reactive minerals could expose the surfaces of soluble salts present in the agglomerates to dissolution explaining the similar release rates of a number of elements not normally present in silicate minerals (e.g. Cl, SO4, and NO3).
5 Conclusions
A detailed experimental study of the rates of interaction between lake sediments and their coexisting fluids suggest the long-term (hours to months) chemical transfer between sediments and lake waters are dominated by the dissolution of the relatively inert silicate phases like quartz and clay. As a significant percent of sediment grains are agglomerates of both rapidly and slow dissolving minerals, the dissolution of these silicates could expose some more soluble salts, if present in the agglomerates to dissolution. The close correspondence between the dissolution rates of quartz and clay minerals and element release rates measured in this study suggest that laboratory measured silicate dissolution rates can be applied to estimate element fluxes among fluids and sediments in a large number of natural environments.
Acknowledgments
We would like to thank Jacques Schott, Oleg Pokrovsky, Gleb Pokrovski, Jean-Louis Dandurand, Robert Gout, Stacey Callahan, and Abdelmajid Chouabbi for helpful discussions during the course of this study. Alian Castello, Jean-Claude Harrichoury, Carole Causserand, Stéphanie Mounic, Carole Boucayrand, Frédéric Candaudap and Thierry Aigouy provided technical assistance. Support from Centre National de la Recherche Scientifique, Ministère de l’Enseignement Supérieur et de la Recherche Scientifique (MESRS-Algeria), Agence Nationale des Barrages (ANB-Algeria) and Agence Nationale des Ressources Hydrauliques (ANRH-Algeria) is gratefully acknowledged.
1 The database used in the present study has the id: llnl.dat 85 2005-02-02. The data for this database were taken from ‘thermo.com.V8.R6.230’ prepared by Jim Johnson at Lawrence Livermore National Laboratory.