

1 Introduction
Geophysical investigations carried out in the Adamawa region in recent years have used seismic, gravimetric, magnetic and magneto-telluric methods to study deep and superficial structures and to propose geodynamic and tectonic evolutionary models for the region. The results of these studies suggest the presence of a thin crust and lithosphere; the thickness of the Moho should not exceed 25 km (Dorbath et al., 1984; Poudjom-Djomani et al., 1995). The present study aims at improving our knowledge of the structural geology of the Adamawa Plateau through exploitation of existing magnetic data over an area comprised between longitudes 12.27°E and 13.41°E and latitudes 6.26°N and 6.98°N. The application of a potential-field method such as magnetism in geophysical prospecting can allow the mapping of tectonic structures such as faults, and reveal geological structures that do not appear on the ground surface. This is made possible by: (1) computing the local maxima of the horizontal gradients of magnetic anomalies (Blakely and Simpson, 1986; Cordell, 1979; Cordell and Grauch, 1985) and the amplitude of the analytic signal (Nabighian, 1972, 1984); as well as (2) direct modelling of magnetic sources. Many authors e.g. Grauch and Hudson (2007) Phillips (2000, 1998) Roest et al. (1992), Khattach et al. (2004) to name but a few, have demonstrated the effectiveness of these techniques in detecting geological contacts and faults. These methods are used here to highlight and characterize the fault system in the study area. Since, on the Adamawa Plateau, river courses and thermo-mineral springs follow paths traced by fractures and faults (Le Maréchal, 1976), the mapping of such features is of socio-economic importance as they can be used to identify possible flow patterns of ground water and to locate the positions of thermo-mineral springs, whose waters are sought after by cattle breeders and populations due to their particular mineralogical properties. The thermo-mineral springs documented in the region (Le Maréchal, 1976) have a fairly weak flow rate, varying between 5 and 100 l/min, and would require work to develop their flow rate to an optimum value. The use of geophysical methods to guide hydrologists and mineral engineers in the search for inventory, industrial exploitation and/or development of groundwater and thermo-mineral springs in the Adamawa region appears necessary because they would provide useful information about the state and the relative size of subsurface fractures and help to identify locations where it would be possible to permanently exploit the groundwater. In addition, the results of geophysical studies allow a better understanding of the mineralogical constitution of thermo-mineral springs and groundwater by reconstructing the geological history of the region.
2 Geological and hydrogeological setting
Geologically, the area studied (Figs. 1 and 2) is part of the central domain of the Cameroonian portion of the Pan Africa Belt, which has a complex structure. The granite-gneiss basement is made up of undifferentiated granites and gneisses. The granitic rocks are essentially syntectonic, and are abundant in the region where they outline the Foumban Shear Zone (FSZ) (Njanko, 1999; Nzenti et al., 1998). The FSZ is the Cameroonian part of the Central African Shear Zone (CASZ), a dextral shear zone that extends some 2000 km from West Cameroon to Sudan (Cornacchia and Dars, 1983; Ngako et al., 1991). Structural data in Cameroon show that the dextral shear interferes with the left shear (Ngako, 1999; Soba, 1989). Another tectonic structure characterizing the studied area is the Djerem sedimentary basin, which is sub-parallel to the FZS and filled with red clay and sandstone (Le Maréchal, 1976).
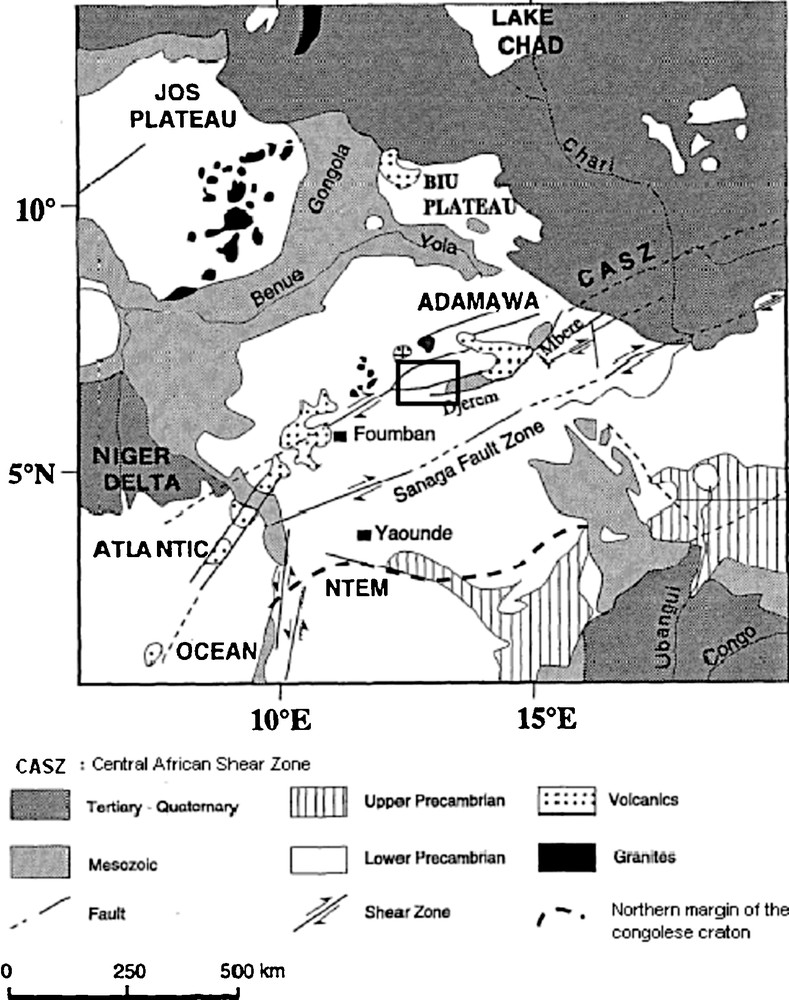
General geological sketch of Adamawa (after Poudjom-Djomani et al., 1995). The box delimitates the studied area.
Schéma géologique général de l’Adamaoua (d’après Poudjom-Djomani et al., 1995). Le secteur d’étude est encadré.

Geological sketch of the studied area. Dots are positions of known thermo-mineral springs. 1: syntectonic granites (Panafrican); 2: gneiss; 3: Cretaceous sedimentary cover; 4: mylonites; 5: faults of the Foumban Shear Zone.
Schéma géologique du secteur d’étude. Les points représentent les positions des griffons des sources thermo-minérales reconnues. 1 : granites syntectoniques (panafricains) ; 2 : gneiss ; 3 : couverture sédimentaire crétacée ; 4 : mylonites ; 5 : failles du Cisaillement Centre-Camerounais.
The hydrological setting of the Adamawa Plateau is characterized by a dense hydrographical network, constituting the headwaters of a majority of the rivers flowing along the entire length of Cameroon from north to south. Thus the name, “the Cameroon Watershed” is given to the region. The flow paths of the water are generally those created by basement fissures, faults or fractures. The main thermo-mineral springs documented in the region (see Table 1) have been identified by Le Maréchal (1976), after interviewing the local population that exploits them for watering cattle. The outflow of water in this region is usually at the intersection of faults and the valley axis, since this is the easiest pathway. The mineral content in the water varies between 250 mg/l and 380 mg/l, while dry residues fall between 140 mg/l and 358 mg/l.
Localisation des sources thermo-minérales (Le Maréchal, 1976).
| Noms des sources | Localisation | |
| Longitude Est | Latitude Nord | |
| Damfiri | 13° 00’ 00″ | 6° 96’ 00″ |
| Darso | 13° 07’ 30″ | 6° 46’ 45″ |
| Mayo Sufi | 12° 40’ 00″ | 6° 47’ 00″ |
| Minim | 12° 48’ 40″ | 6° 57’ 35″ |
3 Filtering of magnetic anomalies and interpretation of transformed maps
3.1 The data
The magnetic data of Cameroon are a compilation of data collected during various magnetic surveys in the country, mostly from airborne surveys carried out by different organizations between 1970 and 1976. Over the Adamawa region, the data were recorded in 1970 during an aeromagnetic survey carried out by the Canadian company SURVAIR (contractor) for the Canadian International Development Agency (client). The aeromagnetic survey specifications were: flight spacing = 750 m; flight height = 235 m; flight direction = north-south. After correction of the measurements for the temporal variations of the magnetic field, the total magnetic intensity (TMI) anomaly was deduced by subtracting the theoretical geomagnetic field or IGRF (International Geomagnetic Reference Field) at each station at the date of 01/01/1973. The TMI anomaly data were then prolonged to a height of a mean clearance of 1 km before they were merged into a unified digital grid, which has a cell size of 0.01 degree (i.e. 1.1 km); all grid-based processing used GETECH's GETgrid software. This grid of values was put at our disposal thanks to the UK Geophysical Society GETECH Group Plc. This grid enabled us to establish a magnetic-anomaly map for the studied area.
3.2 The TMI anomaly map
This map (Fig. 3) shows the sum of the effects of all magnetic materials irrespective of their orientations, the nature and the intensity of the magnetization. The map reveals that the magnetic anomalies have a general N70°E direction, which is one of the characteristic structural directions of the Adamawa Plateau. This suggests that the TMI anomalies are strongly influenced by regional tectonics. In some areas, these anomalies have maxima greater than 120 nT. The village of Tibati is situated on an axis, which has a WSW-ENE direction and clearly takes an east-west one at Tibati. This magnetic axis is sub-parallel to the FSZ, which crosses Tibati. Two individualized anomalies oriented SSW-NNE and east-west are also observed, respectively to the NW of Tibati at latitude 6°40’N and to the south-west of Bagodo. Locally, their magnitudes reach 170 nT.
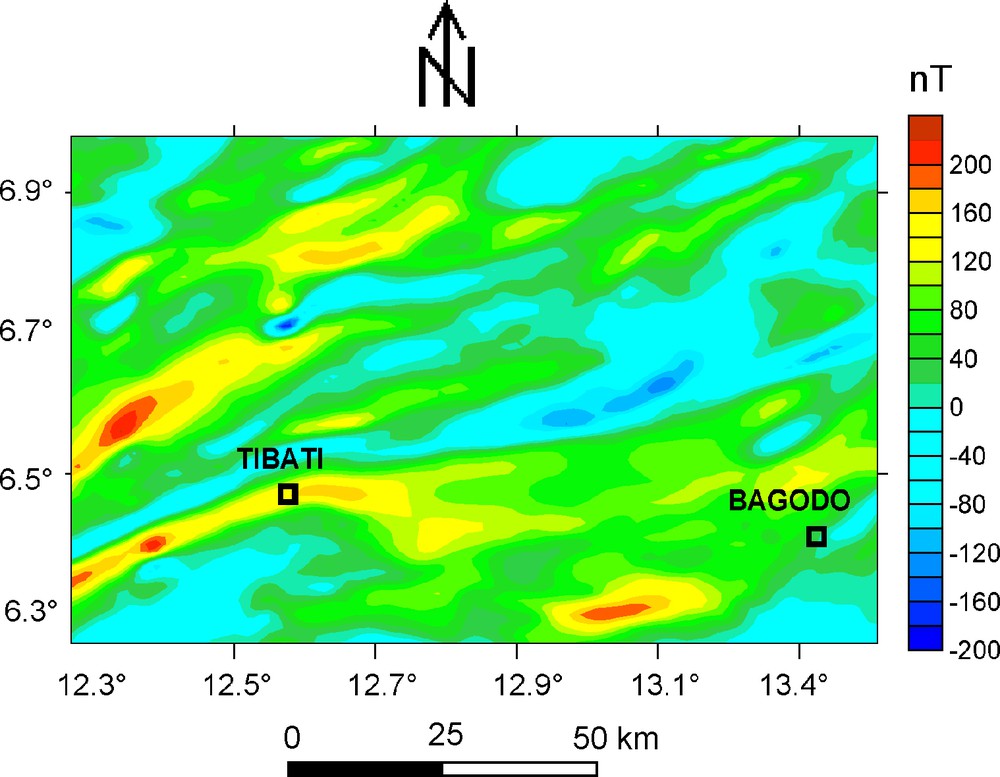
Total magnetic field anomaly map of the studied area.
Carte des anomalies du champ magnétique total du secteur d’étude.
At low magnetic latitudes (between 15°S and 15°N) as is the case here, it is not very easy to correlate the observed anomaly maxima and the positions of magnetic sources, due to the fact that the magnetic signatures of magnetized bodies at low latitudes always have two extreme values because of their bipolar nature. The consequence is that in the TMI anomaly map, the maxima are not found vertically above magnetic sources, thus making it difficult to link the observed anomalies with the sources. To facilitate the interpretation of the anomalies, we transform the analytic maps. In the space domain, these analytic transformations correspond to convolutions of the initial signal with a specific operator (filter). Calculations are generally done in the Fourier domain where the convolution is replaced by a simple multiplication. This is the case of the reduction-to-the-pole.
3.3 Reduction-to-the-pole
The reduction-to-the-pole (RTP) operation transforms the observed magnetic anomaly into the anomaly that would have been measured if the magnetization and ambient field were both vertical (inclination I = 90°). This puts extreme magnetic anomalies directly over their sources, like gravity anomalies, thus making magnetic interpretation easier and more reliable. In the frame of our study, the RTP operation was carried out with the software TRANS developed at the Canadian Geological Survey (Keating, personal communication), which allows RTP at low latitudes (Keating and Zerbo, 1996), assuming perfect induction, i.e. direction of magnetization parallel to the ambient field. The magnetic inclination and declination for the studied area were given by the IGRF (I = −9.6° and D = −4.6°). The magnetic anomalies observed after RTP (Fig. 4) remain strongly influenced by the structural direction of the Adamawa region oriented N70°E, as on the TMI anomaly map (Fig. 3). However, as generally occurs at low latitudes, significant changes are observed in the location as well as in the wavelength of the anomalies.
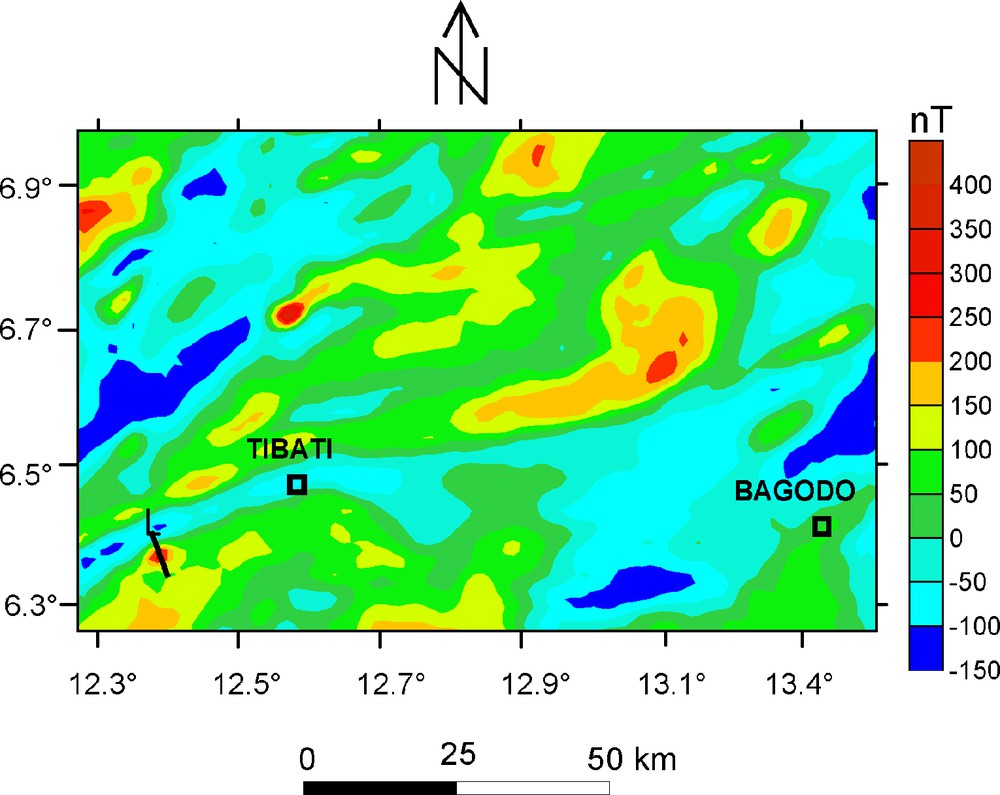
Reduce-to-the-pole map. The black line L corresponds to the profile selected for the quantitative interpretation (see Fig. 10).
Carte des anomalies du champ réduit au pôle. La ligne noire L correspond au profil choisi pour l’interprétation quantitative des anomalies observées (voir Fig. 10).
A strong correlation is observed between the anomalies and the geology, which shows a prominence of magnetism due to igneous formations over metamorphic formations. Indeed, positive anomalies overlie granitic zones while negative anomalies are observed over gneissic formations. This suggests that the magnetic anomalies observed in the area have their sources mainly within the granite–gneiss basement. We also observe some circular magnetic trends, with magnitudes above 300 nT. They are found for example in the north, north-west and south-east of Tibati along latitudes 6.7°N, 6.85°N and 6.36°N respectively, and also to the north-west of Bagodo at latitude 6.65°N. These circular trends with large magnitudes suggest the presence of highly magnetized cylindrical intrusive bodies within the basement. The mylonites along the FSZ do not show any particular magnetic signature. It is remarkable that the RTP anomaly map does not show any trend oriented along the direction of the geomagnetic declination; this is a good sign because such anomalies would have constituted artifacts on the map.
3.4 The total horizontal derivative
The total horizontal derivative (THD) map (Cordell, 1979; Cordell and Grauch, 1985) has its maximum magnitude directly over the top edge of the boundary of magnetic sources. This tool has been widely used in gravity and magnetic interpretation to mark geological contacts such as faults. In the spatial domain, the THD of the TMI anomaly T is given by the relation:
| (1) |
At low latitudes, we apply the THD operator to the RTP anomaly rather than to the TMI anomaly. The THD of the RTP anomaly map (Fig. 5) shows areas of high gradient which appear in the form of axes with amplitude peaks of 0.15 nT/m to the north and south-west of Tibati at latitudes 6.7°N and 6.85°N, respectively. These axes of maximum THD are superposed on the FSZ and correspond to a geological contact zone with a great magnetic susceptibility difference. In order to highlight the structural directions shown on the THD map, we drew the corresponding shaded relief map (Fig. 6a). This map shows the structural complexity of the studied area by revealing the various lines of fractures and/or contacts inside the basement (see Fig. 6b). Especially around Tibati, the configuration of the axes of horizontal maximum suggests the presence of a shear zone with a left-hand slide illustrated in Fig. 6a by black arrows. Some researchers admit that in the Adamawa region, the slide to the left is anterior to the dextral shear (Ngako, 1999; Njanko, 1999). Therefore, it would be plausible that magnetic anomalies have kept the memory of the slide to the left.
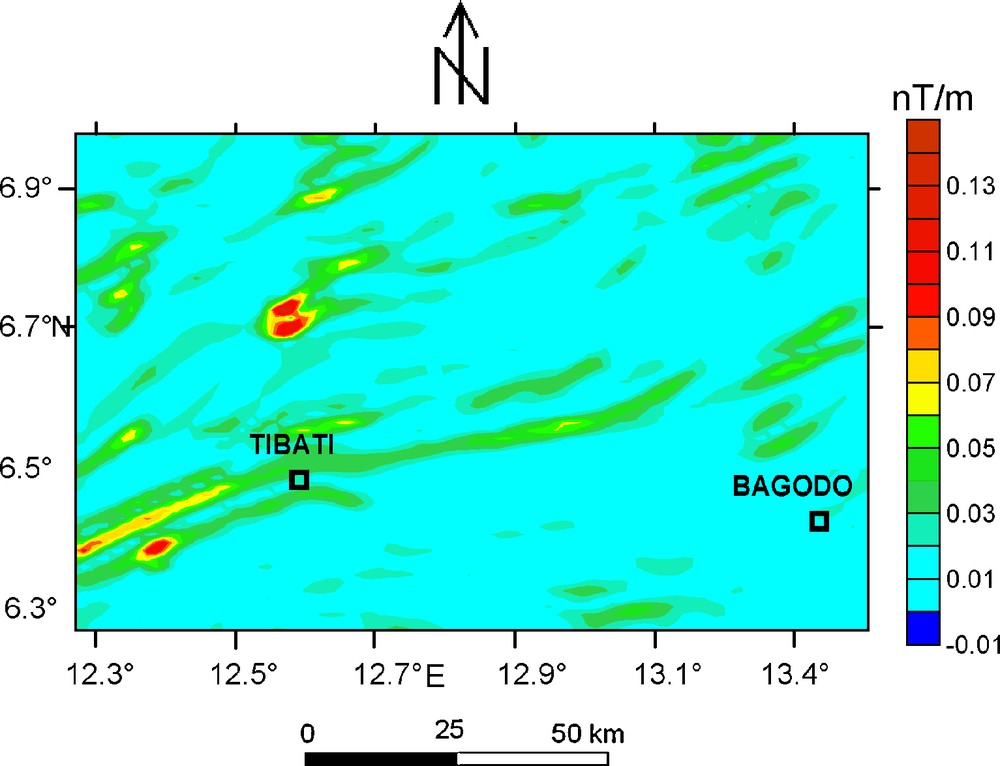
Total horizontal derivative (THD) map.
Carte du gradient horizontal total.
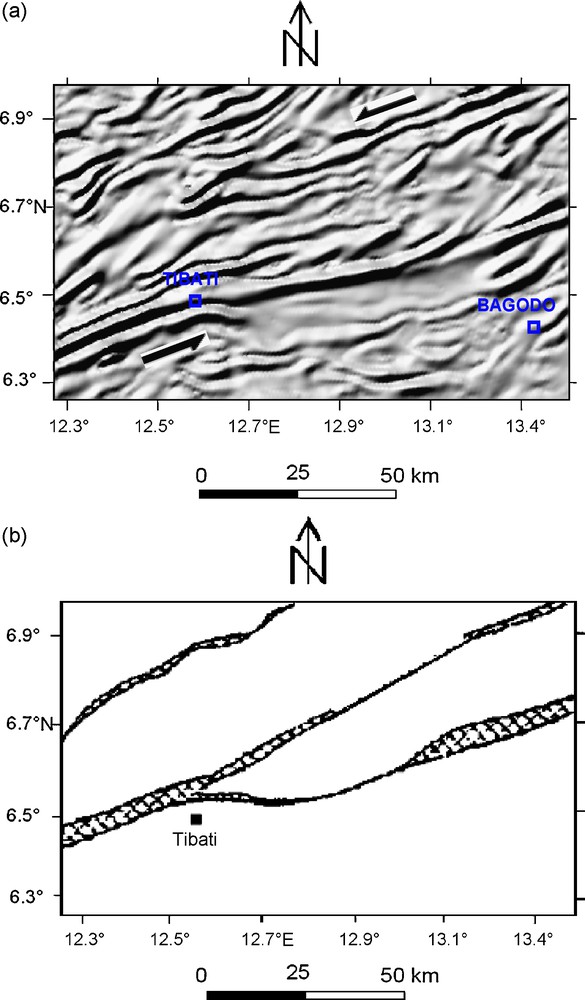
(a) Shaded relief map of the THD; the black arrows show shearing direction. (b) Sketch of the Foumban shear zone in the studied area; partitions are mylonites.
(a) Carte du relief ombré du gradient horizontal total; les flèches noires indiquent le sens du décrochement. (b) Schéma du cisaillement centre-camerounais dans le secteur d’étude ; les cloisons représentent les mylonites.
3.5 3-D Analytic signal amplitude
In Cartesian coordinates, the 3-D analytic signal amplitude (ASA) of the TMI anomaly T is defined by the relation (Roest et al., 1992):
| (2) |
Unlike the THD, the ASA depends very little on the direction of magnetization (Blakely, 1995; Roest et al., 1992) and is totally independent in the case of vertical contacts (Nabighian, 1972). A gravity study carried out over the Adamawa Plateau (Noutchogwe Tachum et al., 2006) shows that the geological contacts of the study area are either sub-vertical, or have a very weak dip with respect to the vertical. Although the ASA is limited and does not allow forward modelling of the sources as the RTP does, an important advantage of the ASA is that it reaches a maximum over zones of contrasting magnetic susceptibility and allows the magnetic source location to be defined in the horizontal plane, independently of the remnant or induced nature of the magnetization. That is why the ASA operator is applied directly on the TMI anomaly map, without first processing with the RTP. Indeed, when the magnetic sources present a remnant magnetization, with a direction of the magnetization different from that of the geomagnetic field, the outlining of contacts via the THD operator can lead to misleading results at low latitudes, due to the fact that the hypothesis of perfect induction adopted during the RTP operation is no longer valid. Some authors, e.g. Roest and Pilkington (1993) have instead used the degree of correlation between the THD and ASA maps as a reconnaissance criterion for the remnant or induced nature of the magnetized sources.
As shown on the ASA map (Fig. 7), there are analogies between it and the THD map (Fig. 5). The location of the maxima and the major directions underlined on the THD map are well represented on the ASA map, where they are illustrated by amplitudes of between 0.05 nT/m and 0.2 nT/m. The amplitude peaks observed to the north and south-west of Tibati on the THD map and on the RTP anomaly map are well demarcated and reinforce the hypothesis of the presence of intrusive bodies with a higher magnetic susceptibility than the imbedded formations.
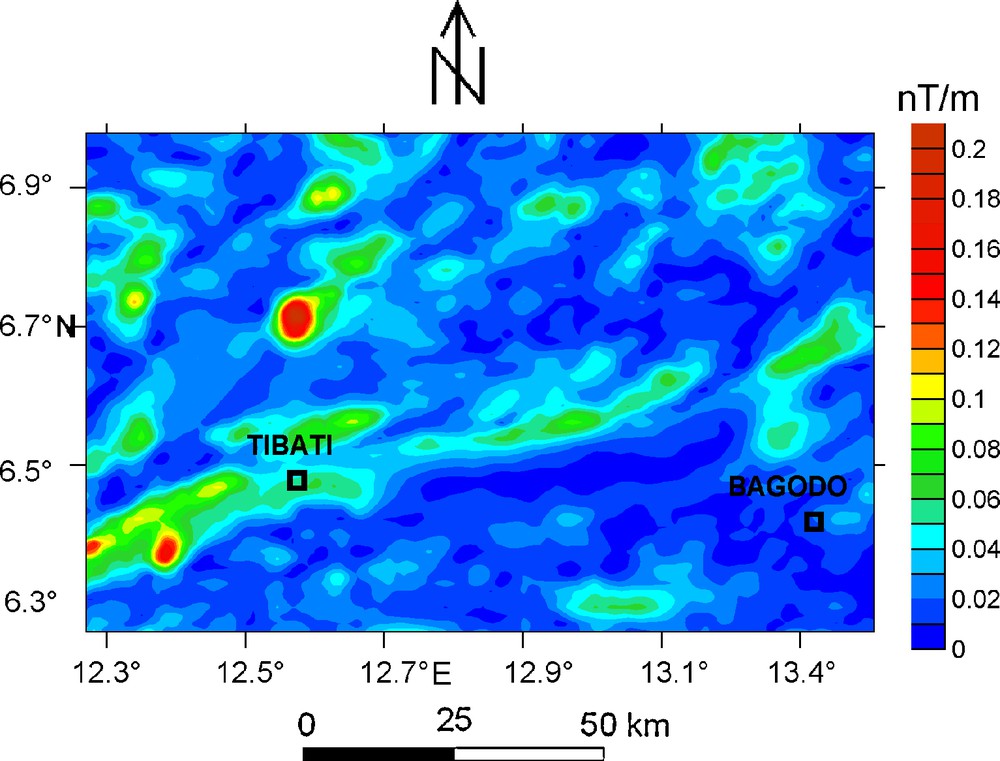
3-D Analytic signal amplitude (ASA) map.
Carte du gradient total 3-D.
To determine the degree of similarity between the two maps, we computed the correlation coefficient between the two data sets using the formula proposed by Dannemiller and Li (2006):
| (3) |
The positions of the maxima of the THD and ASA maps were determined with the algorithm proposed by Blakely and Simpson (1986), and were superimposed on the same map (Fig. 8a) in order to illustrate the principal and secondary structural directions. An interpretative structural map is drawn to highlight the different lineaments (Fig. 8b). This map shows a predominance of directions included between N60°E and N70°E. Secondary directions of less importance are also underlined, notably the direction N20°E and directions located between N105°E and N110°E.
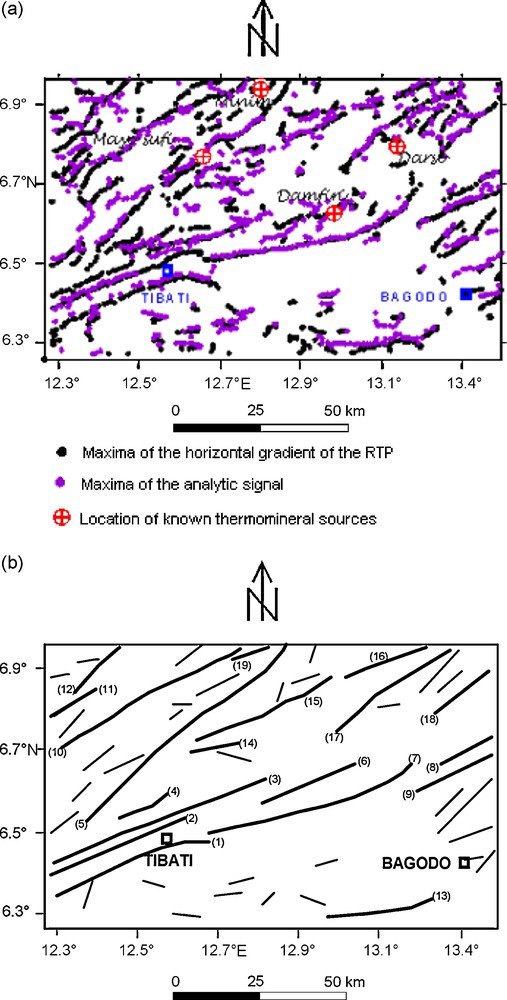
(a) Location of the maxima of the THD of the RTP anomaly map and analytic signal amplitude; encircled crosses indicate the positions of documented thermo-mineral springs (Le Maréchal, 1976). (b) Interpretative structural map.
(a) Maxima locaux du gradient horizontal total du champ réduit au pôle et du signal analytique ; les croix encerclées indiquent les positions des sources thermo-minérales identifiées (Le Maréchal, 1976). (b) Carte structurale interprétative.
4 Quantitative interpretation
In order to determine the geophysical characteristics of the intrusive body suspected southwest of Tibati, a profile directed N22°W (Fig. 4) was modelled after subtracting the regional trend (Fig. 9). To better constrain the interpretation, the depth of the source was first estimated by the Euler deconvolution (Reid et al., 1990; Thomson, 1982). A window size equal to 11 was used and the Euler solutions were determined for different values of the structural index N, which depends on the geometry of the body responsible of the observed anomaly. When the source has a regular and known geometry, the corresponding structural indication (see Table 2) is introduced as a parameter and solutions give the depth and the horizontal position of the source along the profile (Durrheim and Cooper, 1998). In the case of the present study, we have no information about the form of the source produced by other geophysical methods; however, a qualitative analysis of the RTP map suggested the presence of a vertical cylinder-like body. All solutions corresponding to N = 0.5, N = 1, N = 1.5 and N = 2 were displayed (Fig. 10). As we can see, no solution exists for structural indices 0.5 and 2. Structural index N = 1 gives two solutions: 601 m and 609 m, while the structural index N = 1.5 gives 9 closer solutions corresponding to a mean depth of 1338 m with a standard deviation of 25 m. Because real geological structures seldom present a simple geometry, the adequate structural index is not always a whole number. For a vertical intrusive body, the value of N should therefore be strictly included between 1 and 2. Thus, the structural index N = 1.5 would better explain the anomaly generated by the body.
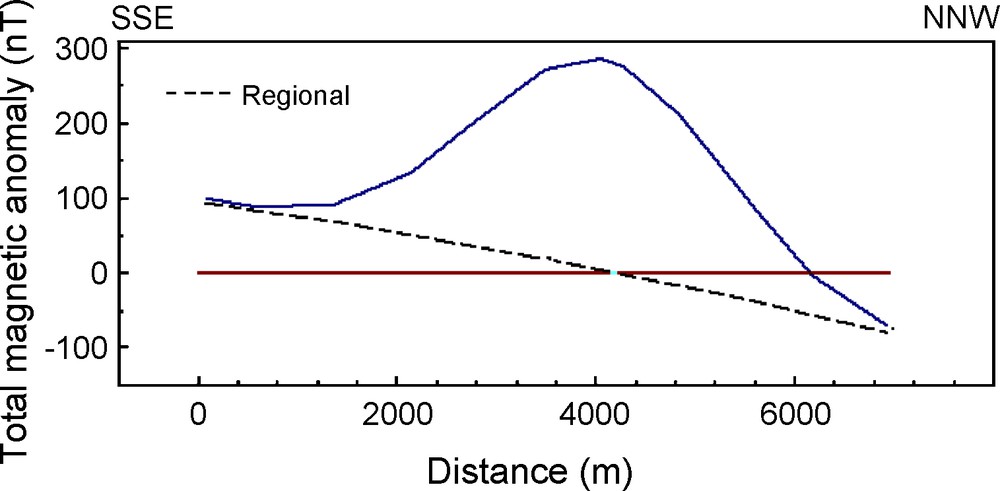
Magnetic profile L over the RTP map (see Fig. 4).
Profil magnétique L sur la carte du champ réduit au pôle (voir Fig. 4).
Indices structuraux pour les sources magnétiques (Reid et al., 1990 ; Thomson, 1982).
| Source | Indice structural |
| Contact | 0 |
| Dyke vertical et sill | 1 |
| Cylindre vertical et pipe | 2 |
| Sphère | 3 |

Euler deconvolution of the residual magnetic field along profile L, after removal of the regional trend. Symbols “+” are solutions corresponding to the structural index N = 1 whereas symbols “x” are solutions corresponding to the structural index N = 1.5.
Déconvolution d’Euler de l’anomalie magnétique résiduelle le long du profil L, obtenue après soustraction de la tendance régionale. Les symboles + sont les solutions correspondant à l’indice structural N = 1, tandis que les symboles x sont les solutions correspondant à l’indice structural N = 1,5.
The 2D1/2 modelling of the intrusive body was carried out with the gravity and magnetic modelling software GeoModel by Gordon Cooper, by taking into account the value of the depth derived by Euler deconvolution. The mean terrain clearance was set at a height of 1 km and the transversal extent of the body fixed at 4 km, corresponding to the mean lateral extension of the observed anomaly. The calculated model (Fig. 11) shows a mushroom-like body with a roof located at a depth of 700 m with a high-enough contrast of magnetic susceptibility, 0.01 (CGS unit). By taking into account the geological setting of Adamawa, characterized by the presence of large Precambrian faults, i.e. the FSZ and the existence of a Cenozoic volcanism widely represented by basalts associated with the volcanism of the Cameroon Volcanic Line (CVL), such a contrast is typical of a basic formation, probably basaltic rocks. The reactivation of the FSZ would have favoured the ascent and installation of the magma within the basement; the magma would have cooled down without reaching the surface. This result is similar to that found on the Darfur in Sudan (Thordarson, 1990) which, like Adamawa, is an associated dome affected by Cenozoic volcanism. It would be therefore possible to think on a similarity in the geodynamical evolution of these two domes.
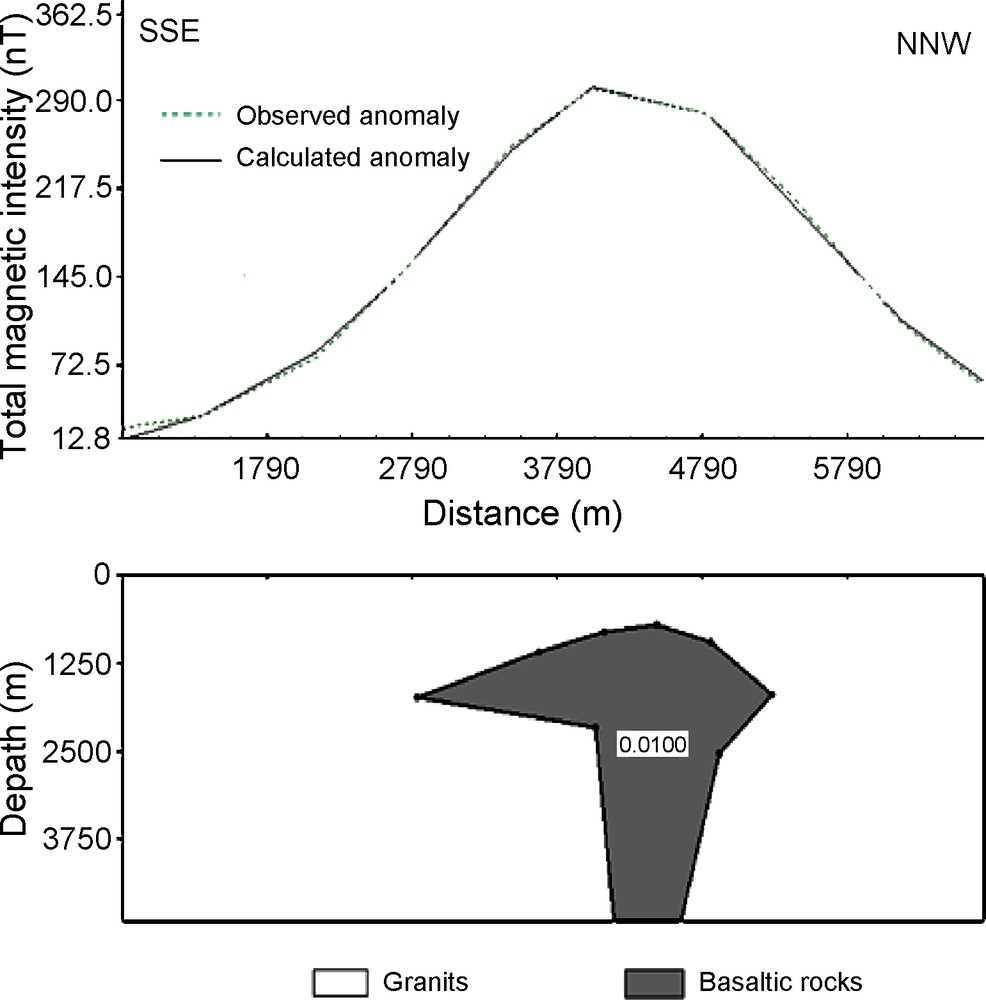
Magnetic modelling of the basaltic intrusion within the granitic basement.
Modélisation magnétique de l’intrusion basaltique dans le substratum granitique.
5 Hydrogeological implications
The interpretative structural map of the studied area (Fig. 8b) shows that the thermo-mineral springs are located on the faults n° 5, n° 6 and n°19, and on the fracture connected to fault n° 17. This map can therefore help us to:
- • locate favorable positions for the existence of thermo-mineral springs;
- • map out the favourable paths for the lateral flow of groundwater sources, which can be exploited by boreholes.
6 Conclusion
This study allowed us to highlight the fault system of the studied area by interpreting the transformed map of the TMI anomaly. The configuration of the identified lineaments suggests a slide to the left of the FSZ. The reactivation of faults would have favoured ascent and consolidation of volcanic rocks of the CVL within the basement. The interpretative structural map shows a preponderance of directions N60°E to N70°E and constitutes an important document which could serve as a guide for further investigations and exploration of thermo-mineral springs and groundwater in the studied area, by facilitating the locating of their likely points of existence and/or emergence.
Acknowledgements
We are grateful to GETECH Group plc (Leeds, UK) and its President and Founder, Prof. J.D. Fairhead for providing the data used in this study. We also thank P. Keating of the Canadian Geological Survey for his kind collaboration as well as Professors M. Munschy and M. Villeneuve for their reviews which led to significant improvements in the manuscript.