

1 Introduction
Fragile arid and semi-arid areas are particularly prone to environmental problems including salinization (Debenham, 1992). Soil salinity is an in situ form of soil degradation due to the build up of soluble salts at or near the surface of the soil (Schofield et al., 2001). It is one of the oldest environmental problems and is considered one of the seven main paths to desertification (Kassas, 1987). Roughly 20% of irrigated agriculture worldwide is affected by salinization (Ghassemi et al., 1995).
Monitoring and mapping of salt-affected areas is required to quantify the salinization phenomenon. Many studies have described and assessed salt-affected soils using satellite, airborne video imagery and land radiometric techniques. These take advantage of the correlation between the reflectance of salt emergences and soil salinity indicators (Csillag et al., 1993; Everitt et al., 1988; Long and Nielsen, 1987; Verma et al., 1994). A major challenge of remote sensing is to detect different levels of soil salinity and sodicity (Fraser and Joseph, 1998). The potential of this technique is the ability to study salinity problems on a large scale. Several authors demonstrated the advantage of combining data from remote sensing with ground-based geochemical measurements (Bishop and McBratney, 2001; Bouaziz et al., 2011; Carré and Girard, 2002). One of the major remote sensing techniques used to monitor crucial environmental problems like salinization is the linear spectral unmixing (LSU) method. It is widely used to estimate the number of reference materials (also called endmembers), their spectral profiles (Fig. 1), and their fractional abundances (Bioucas-Dias and Figueiredo, 2010).
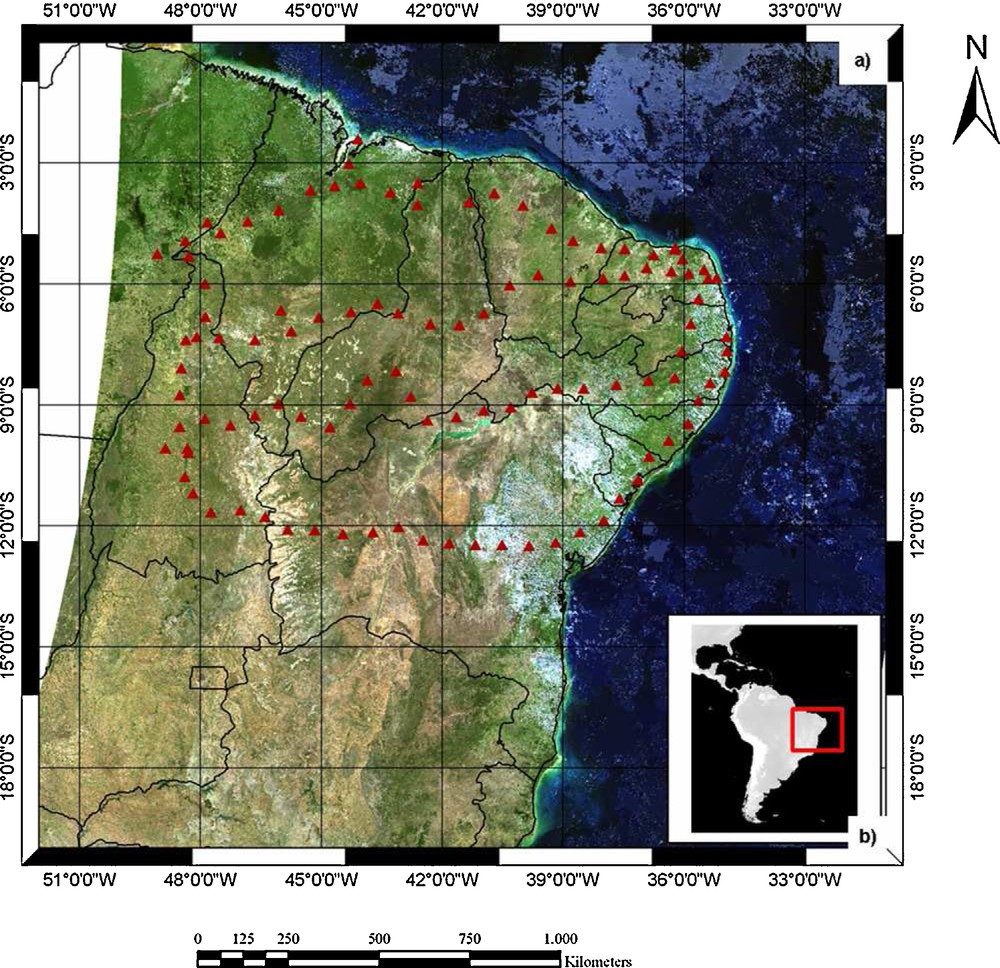
Location of the study area: (a) composite MODIS image of Brazil acquired in July 2008; (b) composite SRTM image of South American continent.
Localisation de la zone d’étude : (a) composite de l’image MODIS du Brésil acquise en Juillet 2008 ; (b) composite de l’image SRTM de l’Amérique du Sud.
Previous studies focused on detailed investigations of restricted areas (< 100 km2). Here, we present the first attempt to detect and quantify soil salinization over a large area by using wide swath MODIS data. This approach allows unprecedented coverage by sacrificing the spatial resolution compared with other types of satellite data. The MODIS data are being compared with geochemical data from field samples to test the reliability of the approach.
Our objectives are: (1) to explore the potential and limits of MODIS Terra data in discriminating salt-affected areas; (2), to assess salt-affected soil through a combination of LSU and soil geochemistry; and (3) to predict soil salinity through linear regression analysis.
2 Materials and methods
2.1 Study area
The study area (Fig. 1) lies in north-eastern Brazil and incorporates 17% of the Brazilian territory (N-S, 00°00’-20°00’ and E-W, 30°00’-52°00’). The area includes wetlands and steppe plains as well as agricultural land. Climate here varies from humid conditions in the north (close to the equator) to a warmer arid to semi-arid south. A semi-arid climate prevails for most of the region. The region yields some of the oldest soils in the world, underlain by Pre-Cambrian bedrock (Vasconcelos et al., 1994). These soils include acrisols, arenosols, ferralsols, plinthosols and luvisols (WRB, 2006). Approximately 5000 km2 of this region is irrigated agricultural land, 25 to 30% of which is affected by salinization (Heinze, 2002).
During the field work in the summer of 2008, 112 samples were taken from top soils (10 to 15 cm) of the investigated area.
2.2 Remote sensing data and processing specifications
Our models have the following inputs: (1) 18 spectral indices (these indices were generated from four different remote sensing indicators (a) salinity (Table 1), (b) intensity (Table 2), (c) vegetation (Table 3), and (d) spectral bands from MODIS; (2) Chemical analysis of 112 samples (EC and pH measurements) which reveal the salt content in the top layer of soil: 0 to 15 cm depth).
Indices de salinité appliqués dans la zone d’investigation.
| Indices | ||
| SI1 |
|
(1) |
| SI2 |
|
(2) |
| SI3 |
|
(3) |
| SI-11 |
|
(4) |
| Aster_SI |
|
(5) |
Indices d’intensité appliqués dans la zone d’investigation.
| Indices | ||
| Int1 |
|
(6) |
| Int2 |
|
(7) |
| BI |
|
(8) |
Indices de végétation appliqués dans la zone d’investigation.
| Indices | ||
| SAVI |
|
(9) |
| NDVI |
|
(10) |
| EVI |
|
(11) |
2.2.1 MODIS Terra data
Studying the Earth across a large region is inherently challenging due to the quantity of data and information that must be processed. In such cases, remote sensing is a good approach, especially in conjunction with MODIS data due to the wide extent of the swath (2330 km). We use the MODIS Terra Surface-Reflectance Product (MOD 09) in this study. This is computed from the MODIS Level 1B land bands 1, 2, 3, 4, 5, 6, and 7 (centered at 470 nm, 555 nm, 648 nm, 858 nm, 1240 nm, 1640 nm, and 2130 nm, respectively). MOD09 Terra data is corrected for atmospheric scattering and absorption as standard, which is an important advantage over other types of satellite data (Vermote et al., 2002). A combination of two different MOD09 data are used in this study, the MOD09A1 surface reflectance within 7 bands and a spatial resolution of 500 m and the MOD09Q1 surface reflectance, providing a better spatial resolution of 231 m.
2.3 Proposed integrated approach
Several authors have demonstrated the advantage of combining data from remote sensing with ground truth measurements (Bishop and McBratney, 2001; Carré and Girard, 2002; Cazenave and Boucher, 2006 and references therein, especially Calmant and Seyler (2006) about the Amazon Basin). Considering the complexity of the salinization process, the identification of salty regions and especially of slightly low and moderately affected areas (the case of our field area) remains challenging.
Our approach displays an attempt to predict salt-affected areas in the Northeast of Brazil through several remote sensing techniques (Fig. 2). Salinity in the top soil is determined by measuring electrical conductivity (EC) which is the most common way to assess soil salinity. EC is usually expressed in microSiemens per cm at 25 °C (μS/cm).
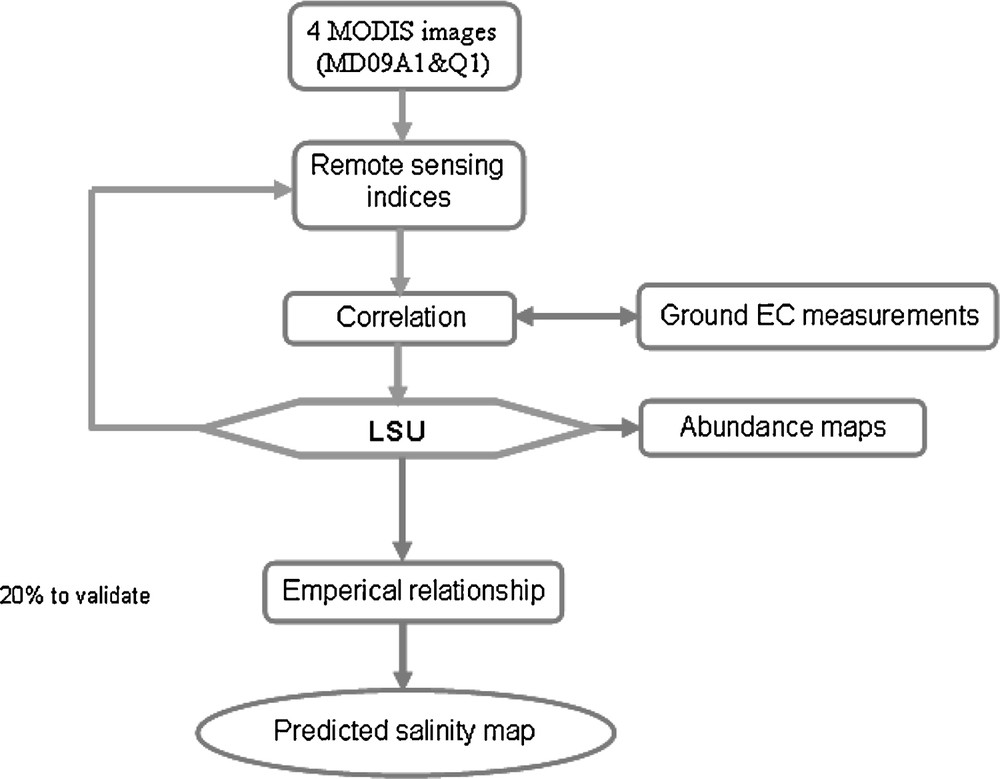
Simplified flow diagram of the spatial estimation approach.
Diagramme simplifié de l’approche d’estimation spatiale.
Both samples and remote sensing data were acquired during the dry season in July and August 2008. Accumulation of salts at the surface is at a maximum during this period, making salt detection easier. Ground samples from Brazilian soil were analyzed in the laboratory using 1:5 diluted extracts (USSL, United State Salinity Laboratory Staff, 1954), which is a convenient method of estimation of soil salt content. Prediction maps derived from several statistical methods (Kriging, Co-kriging and Inverse Distance weighting) were created using the ground truths of electrical conductivity and pH measurements. Eighteen indices are used with the MODIS Terra data to map salt-affected soil. A Pearson correlation between the remote sensing indices and the electrical conductivity measurements from the field was used to assess the efficiency of each index in discriminating soil salinity. The LSU method is applied to determine the relative abundance of materials that are depicted in the multispectral MODIS image. Based on the three abundance maps (vegetation, soil and clouds), each pixel is considered as a linear combination of the reflectance of these three components. Furthermore, LSU is used to distinguish if the pixel of each sample is representative for the soil. For this purpose, we explored all the pixels representing the location of the samples. Then, we considered only the pixels incorporating more than 55% of soil (computed from the abundance maps, see in the results Section 3.2). This step is made to ensure that the spectral signature from the sample is emitted mainly from a soil. Subsequently, the correlations between the EC and the remote sensing indices are recomputed. The impact of the LSU method is discussed in Section 3.1.
Multiple Linear Regressions (MLR) is a multivariate statistical technique and one of the most widely used techniques to determine the correlation between a response variable and some combination of two or more predictor variables. Several multiple linear regressions (MLR's) are explored in this study to predict soil salinity. To build the MLR models, 80% of the samples are randomly selected. The remaining 20% are used to validate the salt prediction relationships. All the statistical operations (computing of correlation, conducting of MLR and random sample selection) were done using SPSS software.
The flow chart in Fig. 2 is a simplified description of the succession steps followed in this research. The samples are split into two parts: the highly and very highly salt-affected samples, and the low and moderately affected samples (89% of all the samples).
2.3.1 Spectral indices for salinity mapping
Remote sensing approaches are being increasingly applied to detect salt-affected areas (Bannari et al., 2008; Csillag et al., 1993; Everitt et al., 1988; Verma et al., 1994). Several spectral combinations are highlighted in the literature and used as indices for the mapping of salt-affected regions. Khan et al. (2001) proposed three spectral band combinations from the LISS-II sensor of the IRS-1B satellite in order to discern patterns of salt-affected areas: salinity index (SI), normalized difference salinity index (NDSI), and brightness index (BI). SI-1, SI-2 and SI-3 are remote sensing salinity indices proposed by the Indo-Dutch Network Project (IDNP 2002) to assess soil salinity conditions based on Landsat-TM data. Khaier (2003) combined band 4 and 5 from the ASTER image and proposed the salinity index ASTER-SI. Some of these indices and others are considered in this research and conducted within the MODIS09 Terra images to detect slightly and moderately affected soil in north-eastern Brazil. Eighteen spectral band combinations from MODIS09 are conducted in this study. These indices are divided into four groups: salinity indices, vegetation indices, MODIS09 Terra bands, and spectral intensity indices. Table 1 presents the different indices applied in Northeast Brazil as well as the specific coefficients integrated in these indices.
2.3.2 Endmember extraction
Before modelling the linear mixture for unmixing, endmembers for the given study area have to be extracted. The endmember determination step consists in identifying and delineating typical regions in the scene. Various techniques such as the Pixel Purity Index (PPI), Orasis (Optical real-time Adaptative Spectral Identification System), Iterative Error Analysis (IEA), Convex Cone Analysis (CCA), Automated Morphological Endmember Extraction (AMEE), have been developed to extract endmember spectra automatically from remotely sensed data. PPI is selected for this study to find the most spectrally pure pixels in the MODIS Terra multispectral image in the Environment for Visualizing Images (ENVI) software. PPI is one of the most successful approaches for defining the pure pixels (Boardman et al., 1995). PPI method is based on the geometry of convex sets (Ifarraguerri and Chang, 1999) and considers spectral pixels as vectors in an N-dimensional space.
2.4 Spectral unmixing
Every image pixel has rarely one component. It is always a mixture of different components (Tompkins et al., 1997). The idea behind the LSU method is to decompose the pixel spectra into a collection of constituent spectra, or spectral signatures, and their corresponding fractional abundances that quantify the proportion of endmembers present in the pixel. The technique is useful for extracting information from data with low spatial resolution, and would thus be ideal for free MODIS data with large ground coverage (Cross et al., 1991).
The LSU method is widely used to estimate the number of endmembers, reference materials (or endmembers), their spectral profiles (Fig. 3) and fractional abundances.

Schematic view of the spectral linear unmixing process (adapted from Bioucas-Dias and Figueiredo, 2010).
Vue schématique de l’approche de démélange linéaire spectral (adaptée par Bioucas-Dias et Figueiredo, 2010).
Each spectrum from the four MODIS images is modelled as a linear combination of a finite set of known endmembers:
| (12) |
We used the LSU approach based on four assumptions defined by Settle and Drake (1993):
- • there is no significant occurrence of multiple scattering between the different surface components;
- • each surface component within the image has sufficient spectral contrast to allow its separation;
- • in each pixel the total land cover is unity;
- • each surface component is known.
3 Results and discussion
3.1 Spectral characteristics of ground features
The complexity of soil properties makes the spectral identification of salt minerals in soils problematic (Csillag et al., 1993). In this section we discuss the spectral behaviour of the different classes of salt-affected soil in north-eastern Brazil. Depending on the spectral regions provided by the MODIS Terra data, visible, near-infrared (NIR) and shortwave infrared (SWIR) are the investigated spectral regions. Reflectance in the SWIR reveals mostly stressed spectral information (i.e.: spectral profiles from soil sample locations are close to each other in the SWIR spectrum interval) regarding the salt-affected soil (Fig. 4). However, reflectance from the visible and near-infrared region is a good indicator, showing more sensitivity to the varieties of slightly and moderately salt-affected soil. Reflectance profiles from Fig. 4 show a ranking of the salinity classes. Within the visible and NIR-range, the five samples represented in Fig. 4 show a good distinction between the different categories of salt-affected soil from the MODIS multispectral data. In general, as shown in the ranking of reflectance in Fig. 4 and as Metternicht and Zinck (2003) and Rao et al. (1995) revealed, reflectance increases with increasing quantity of salts at the terrain surface. According to the investigated samples in this study area, salt-affected soil (high electrical conductivity) shows a relatively higher spectral response in the NIR and the first 200 nm of the SWIR than in the visible spectrum. Fariftteh et al. (2005, 2007) found that increases in soil salinity induced changes in soil reflectance for wave bands higher than 1,300 nm, particularly in the water absorption bands between 1400 and 1600 nm. This is in agreement with the findings of Metternicht and Zink (1997).
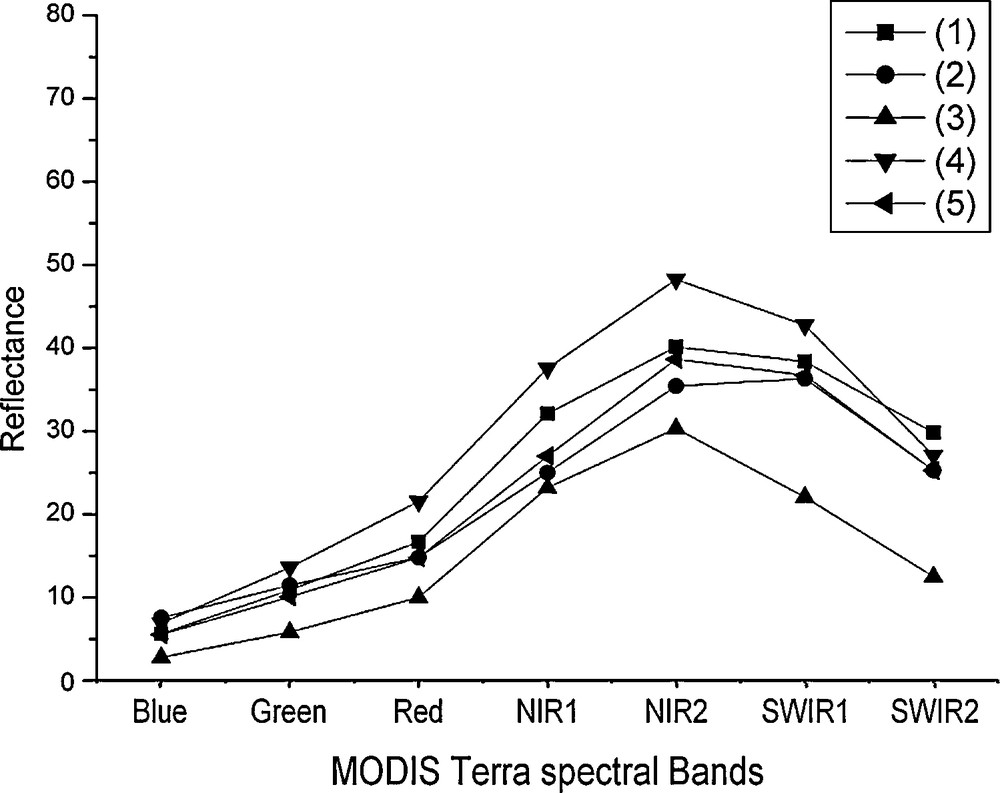
Spectral signature variation of different soil surface features due to differences in electrical conductivity: (1) EC = 132 μS cm−1; (2) EC = 51 μS cm−1; (3) EC = 14 μS cm−1; (4) EC = 556 μS cm−1; (5) EC = 74 μS cm−1.
Variation de la signature spectrale de différentes surfaces de sol, causée par la différence de la conductivité électrique : (1) EC = 132 μS cm−1 ; (2) EC = 51 μS cm−1 ; (3) EC = 14 μS cm−1 ; (4) EC = 556 μS cm−1 ; (5) EC = 74 μS cm−1.
3.2 Remote detection of soil salinity from Spectral indices
MODIS Terra spectral bands are incorporated into a spectrum range varying from 450 nm (blue) to 2150 nm in the SWIR. The seven spectral bands of MODIS Terra (Fig. 5) were considered as indices of soil salinity. A Pearson correlation between the electrical conductivity values and the MODIS Terra spectral bands was conducted to evaluate which spectrum interval could reveal more about the salt-affected area. Figs. 6–8 present the resulting correlation coefficients computed at a significance level of P < 0.01 level (2-tailed).
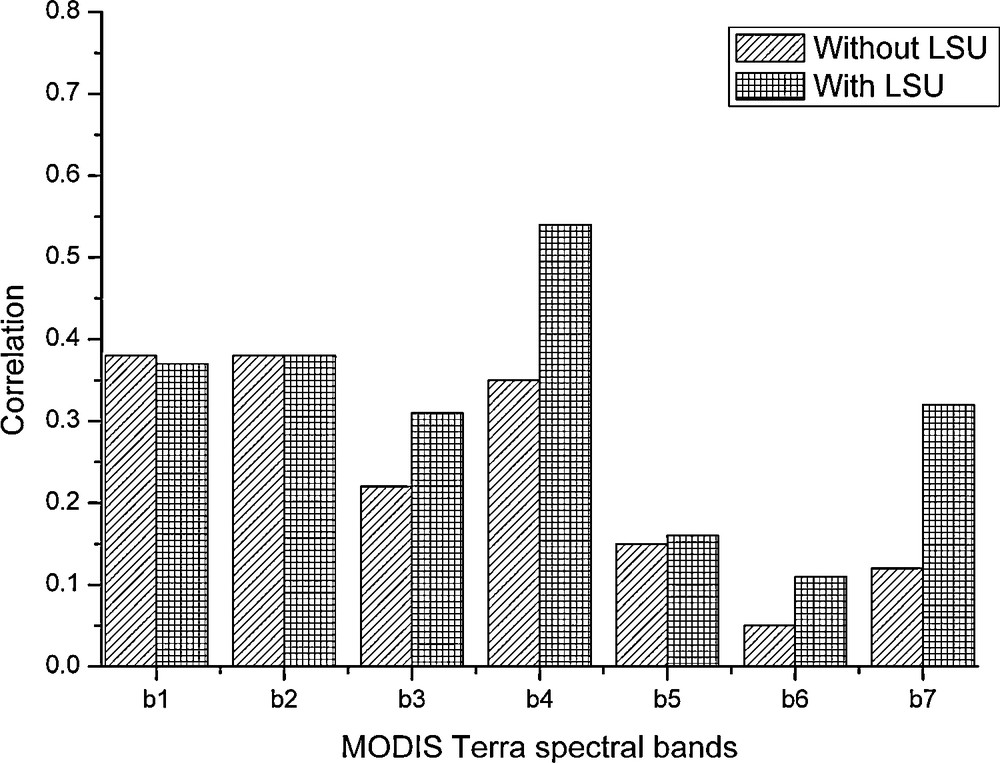
Correlation between the MODIS Terra spectral bands and the EC.
Corrélation entre les bandes spectrales du MODIS et EC.
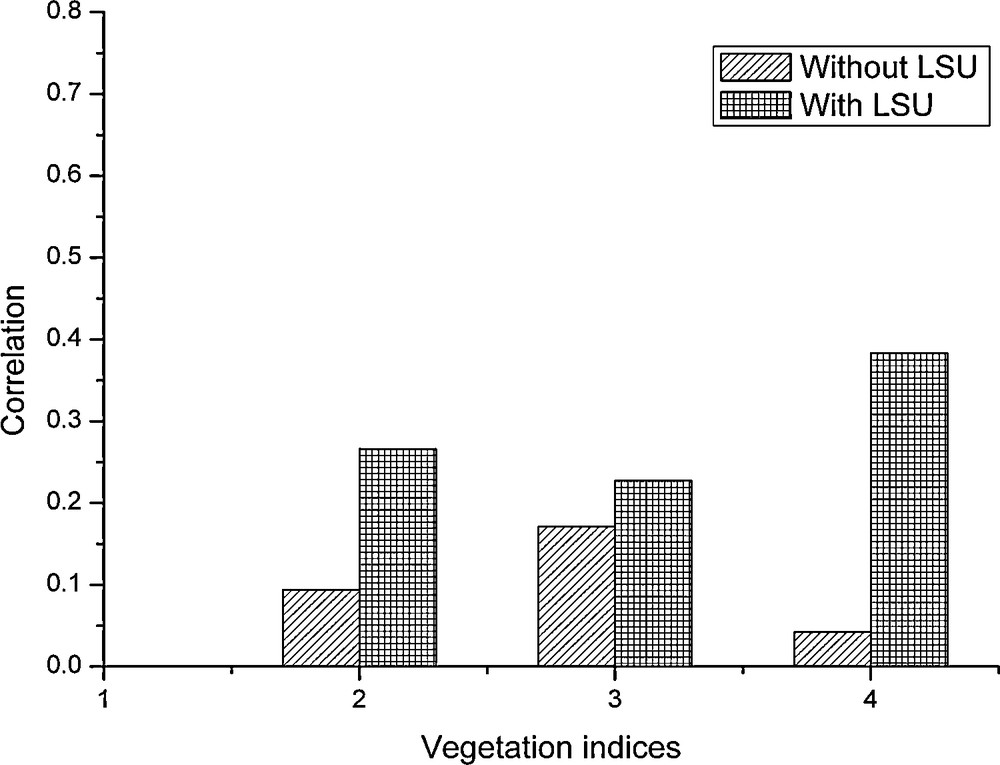
Correlation between vegetation indices and EC.
Corrélation entre les indices de végétation et EC.

Correlation between intensity indices and EC.
Corrélation entre les indices d’intensité et EC.
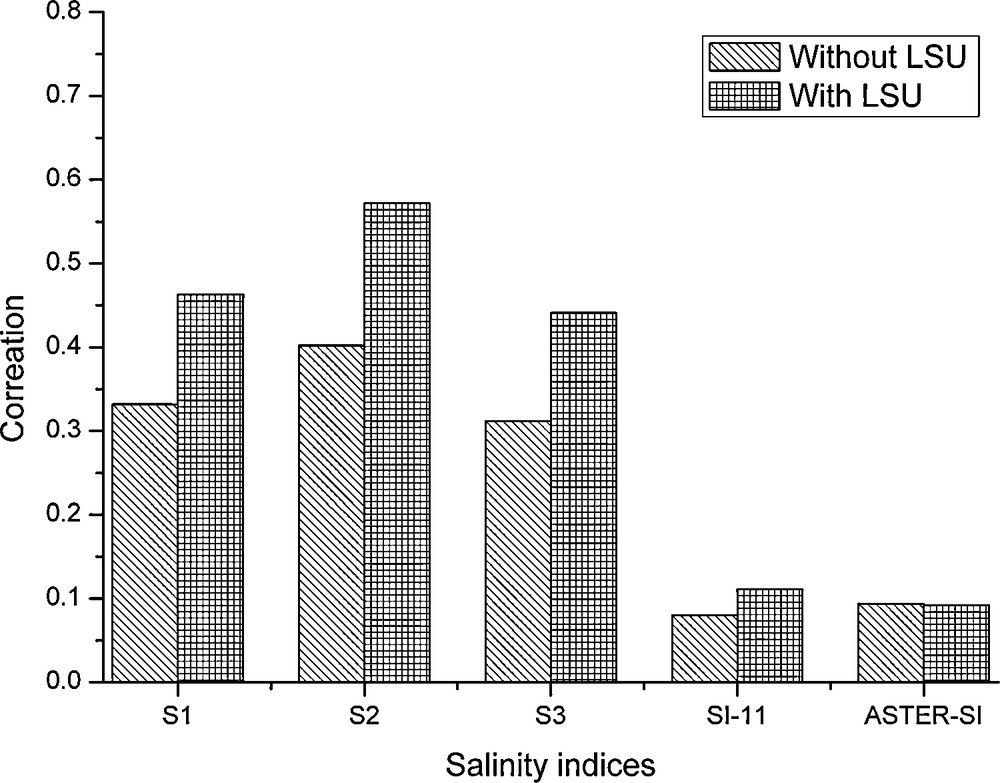
Correlation between salinity indices and EC.
Corrélation entre les indices de salinité et EC.
Correlation between the MODIS terra spectral bands and EC from the ground truth shows a higher correlation in the VIS and NIR region of the spectrum interval (Fig. 6). Among the MODIS spectral bands, band 4 (NIR) gives the highest correlation (58%). The use of LSU improves the correlation within most of the applied remote sensing indices on the MODIS Terra data. There is clear improvement in band 4 where the correlation increases by 23%. Nevertheless, bands 1 and 2 of the VIS interval did not show any improvement in correlation, remaining at 38% (Fig. 6).
Intensity indices show low correlation with the EC, varying between 32 and 40%. The use of LSU increases the correlation by up to 10%. Hence, the three intensity indices used in this study do not show potential for discriminating salt-affected soil. Moreover, vegetation indices offer a low correlation, especially before the use of LSU (Fig. 7). This suggests that the density of vegetation cover is not significant in terms of soil salinity monitoring. The coefficients of correlation improve as a result of LSU, but not enough to provide accurate information regarding soil salinity. EVI shows the highest correlation at 40%. EVI is a widely used vegetation index in this region ; it takes into consideration the aerosol resistance term and transfer through a canopy using the coefficients L, C1 and C2 (Eq. (11)). When correlating the performed salinity indices (Table 1) and the EC of the soil samples, salinity index 2 (SI2, Eq. (2)) provides the highest correlation, not only among the salinity indices but among all the spectral indices performed in our work. SI-2 is among a cluster of salinity indices where only the G, R and NIR are combined. These indices show the highest correlation compared to other indices where the SWIR bands are used. This is due to the high performance of G, R and NIR bands in retrieving patterns and features of soil salinity in the investigated area (i.e.: high correlation between the G, R, and NIR MODIS spectral bands with the EC from ground truth). The MODIS SWIR bands showed a low correlation with EC ; therefore the salinity indices computed from these bands have a limited potential for detecting soil salinity. The low spatial resolution of the MODIS Terra data is one of the main reasons for such a weak correlation. Furthermore, the collected samples cannot be completely representative of the pixels because one sample represents only one point on the relevant 231 × 231 m pixel.
The generated abundance maps display the fractional amount of material present at each pixel (Fig. 9). The three abundance maps (e.g. vegetation, clouds, and soil) were generated through the application of the LSU method. These maps show the spatial density distribution of the main three components composing the investigated region. The soil abundance map shows the predominance of bare soil in the study area. The vegetation abundance map reveals a high vegetation density to the north-west where the Amazon biome is found (indicated by an arrow in Fig. 9b). The derived cloud abundance map from the LSU method was helpful to delineate areas with clouds (indicated by an arrow in Fig. 9a). Cloud abundance is focused on the eastern coast, so samples from this area were avoided when building the MLR relationship.
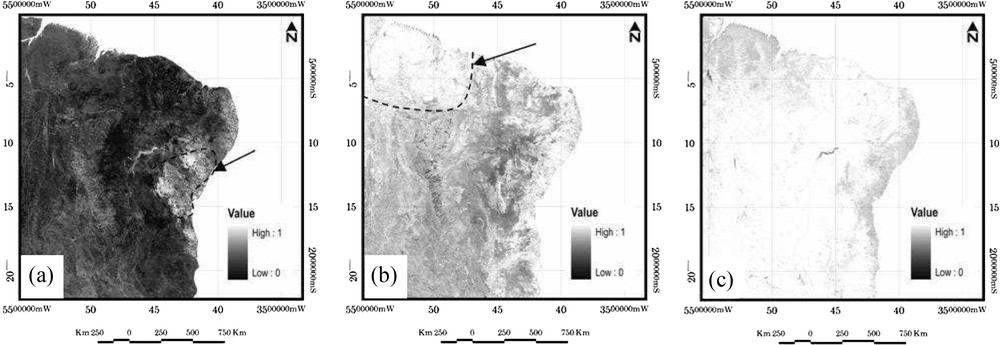
Gray-scale abundance maps for clouds (left), vegetation (center), and soil (right).
Carte d’abondance des nuages (à gauche), de la végétation (au centre) et des sols (à droite).
3.3 Multiple linear regression to predict salt-affected areas
MLR estimates the coefficients of the linear equation, involving one or more independent variables that best predict the value of the dependent variable. In this paper, a multiple linear regression model is developed to predict low and/or moderately salt-affected soils.
The model is based on the data of the best spectral salinity indices (as predictor variable) and the EC from ground truth measurements (as response variable). From several explored models of MLR, the best MLR approach found involves a combination of the salinity predictors (salinity indices 2, band 4 from MODIS spectral bands) and was used to model the empirical relationship between electrical conductivity and soil salinity as indicated by remote sensing indices. To build up the MLR relationship, 80% of the samples are selected randomly by the software. The remaining samples are used for validation. The choice of the best model was based on the coefficient of multiple determination (R2) computed by the model (Draper and Smith, 1998; Wijaya et al., 2010).
The best R2 value in the regression output indicates that only 40.5% of the total variation of the predicted EC values can be explained by the predictor variables used in the model.
The regression empirical relationship is given by the following formula:
| (13) |
The best MLR empirical relation is based on the salinity index 2 and the spectral band 4 (NIR) of MODIS Terra image. These two indices show the highest correlation with the EC from the ground truth. Combining these salinity indices helps to build a more reliable MLR empirical relationship to predict soil salinity. The standard error (also known as the root mean square error) of the estimate is the square root of the residual mean square. It is shown that the standard deviation of the data about the regression line is about 12 μS/cm. This error decreases with increasing soil salinity, which means the higher the electrical conductivity the closer the predicted conductivity will lie to the ground truth measurement (Fig. 10).
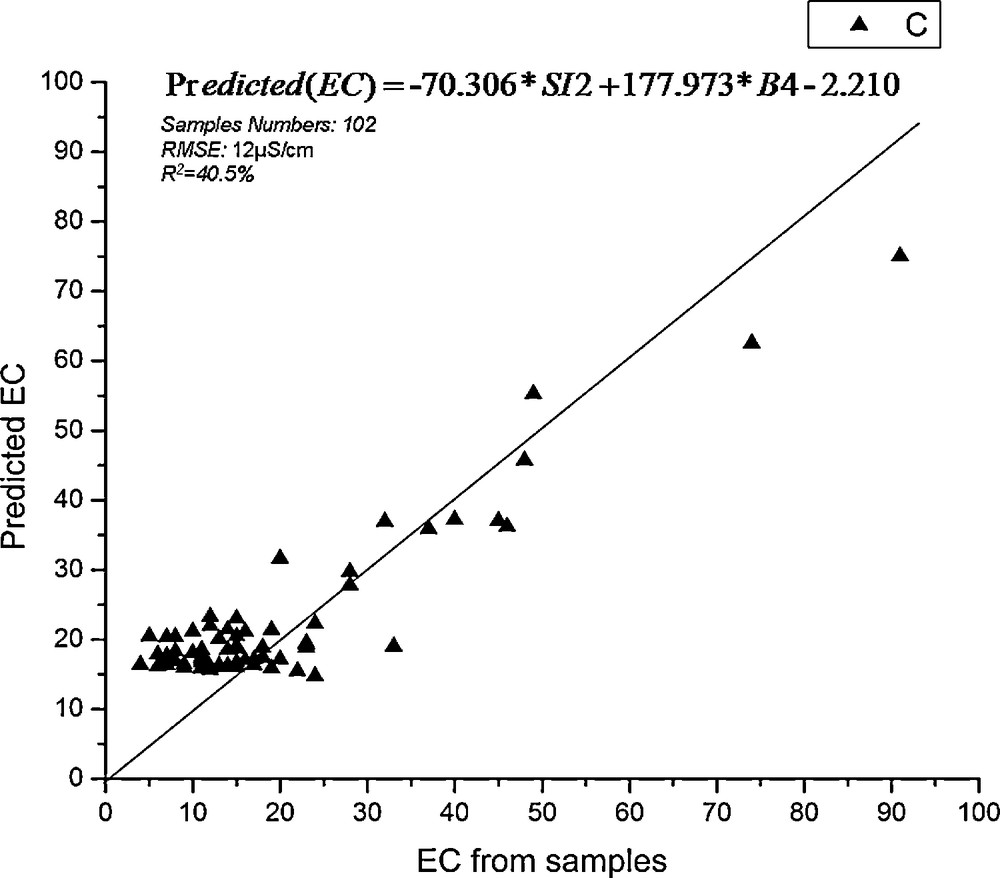
Relationship between measured and estimated electrical conductivity (EC) values (linear regression).
Relation entre les valeurs de conductivité électrique (CE) estimées et mesurées (régression linéaire).
The empirical relationship between measured and estimated EC values showed an overestimation of the predicted electrical conductivity values. Fig. 10 shows that predicted values of electrical conductivity are often higher than the values from the ground truth measurements.
4 Conclusion
The present study evaluates the potential of using the LSU technique combined with remote sensing indicators from MODIS Terra data for the assessment and monitoring of salt-affected soil over a large area. Our remote sensing methodology provides a reliable variety of indicators to address land degradation by salinization. Although the correlations found in this study are not strong, they reveal the potential of various spectral indicators to predict salt- affected areas in north-eastern Brazil. A moderate correlation was found between electrical conductivity and the spectral indices. An improvement occurs in most of the correlations after applying the LSU method. This suggests the LSU plays an important role in retrieving more accurate information regarding soil salinity. The use of LSU on MODIS Terra data has great potential despite the low spatial resolution of the MODIS images.
We propose that the combination of spectral indices and ground truth measurements is an efficient way to create a large-scale predicted soil salinity map.
An MLR analysis with SI2 and B4 was conducted to predict soil salinity, which gave a moderate coefficient of multiple determination (R2 = 40%). Further research by means of non-linear methods should enable refinement of the model and reduce the error of predicted electrical conductivity values.
Acknowledgements
The authors gratefully acknowledge the DAAD (German Academic Exchange Service) for honouring the first author with the scholarly award to pursue his PhD at the Technische Universität Bergakademie Freiberg, Germany. The authors express also their gratitude to Dr. Adam Szulc for reading and correcting earlier drafts of this paper.