

1 Introduction
The Lesser Antilles arc is a zone of convergence between the American plate and the Caribbean plate at a rate of about 2 cm/yr (Lopez et al., 2006). This movement is absorbed by the subduction of the American plate below the Caribbean plate and deformation of the wedge of the upper plate on a 100-250 km-wide zone, producing an extended system of active crustal faults (Fig. 1 insert, (Feuillet et al., 2002)). It results in a high seismicity level (about 1000 detected events per year) located on the subduction interface and within the slab with hypocentral depths ranging from 10 km up to 220 km, and within the deformed Caribbean plate with shallow crustal seismicity from 2 km up to 15–20 km in depth. Very shallow earthquakes occurring below/or very close to Guadeloupe archipelago islands can be felt sometimes with magnitude less than 2.0.
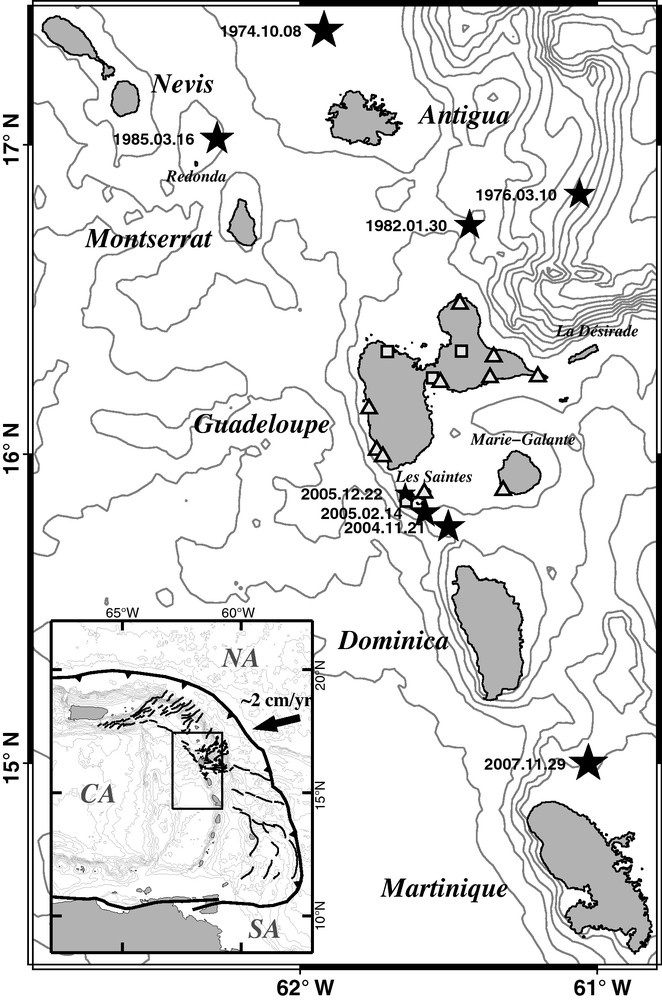
Permanent network of digital accelerometers (TITAN AGECODAGIS, see http://www-rap.obs.ujf-grenoble.fr/) in Guadeloupe: soil (squares) and rock (triangles) site conditions (see Bengoubou-Valérius et al. (2008) for further details). Epicenters of some recent instrumental earthquakes are shown as black stars with dates (see text for details). Insert: Tectonic context of Lesser Antilles. CA = Caribbean plate, NA = North American plate, SA = South American plate. Black thick line with triangles: accretionary prism frontal thrust. Black lines: crustal faults from Feuillet et al. (2002). NA Euler vector of Lopez et al. (2006). Bathymetry data are 500 m contour lines (Smith and Sandwell, 1997). Masquer
Permanent network of digital accelerometers (TITAN AGECODAGIS, see http://www-rap.obs.ujf-grenoble.fr/) in Guadeloupe: soil (squares) and rock (triangles) site conditions (see Bengoubou-Valérius et al. (2008) for further details). Epicenters of some recent instrumental earthquakes are shown as black stars ... Lire la suite
Réseau permanent d’accéléromètres du Rap (numériseurs Titan Agecodagis, voir http://www-rap.obs.ujf-grenoble.fr/) en Guadeloupe: conditions de site type sol (carrés) ou rocher (triangles) (voir (Bengoubou-Valérius et al., 2008) pour plus de détails). Les épicentres de quelques séismes instrumentaux sont indiqués par des étoiles avec dates (voir texte). Encart: contexte tectonique des Petites Antilles. CA = plaque Caraïbe, NA = plaque Nord-Américaine, SA = plaque Sud-Américaine. Courbe noire avec triangles: fosse frontale du prisme d’accrétion. Lignes noires: système de failles crustales d’après Feuillet et al. (2002). Vecteur d’Euler pour la plaque NA d’après Lopez et al. (2006). Données de bathymétrie: courbes de niveaux 500 m (Smith et Sandwell, 1997). Masquer
Réseau permanent d’accéléromètres du Rap (numériseurs Titan Agecodagis, voir http://www-rap.obs.ujf-grenoble.fr/) en Guadeloupe: conditions de site type sol (carrés) ou rocher (triangles) (voir (Bengoubou-Valérius et al., 2008) pour plus de détails). Les épicentres de quelques séismes instrumentaux sont ... Lire la suite
Since the French volcanological and seismological observatories (OVSG and OVSM) located in the Lesser Antilles are maintaining operational real-time seismic networks, they are responsible for detecting and informing local authorities and public of any felt earthquake occurrence and main event characteristics: location (epicenter and depth), type (tectonic or volcanic), magnitude, and maximum reported intensity in Guadeloupe and Martinique islands. Location and magnitude calculation are determined in a systematic way, using hand-picked phase arrivals and hypocenter inversion, and are available within few tens of minutes after an event, thanks to observatory permanent duty. Macroseismic intensities are determined later, as a result of detailed investigations in the field. However, in the case of a strongly felt earthquake, the first need of the local authorities is to get practical information on event location and maximum possible effects in the living areas. If this information can be delivered rapidly, it may be used to evaluate and focus assistance in the most affected zones.
On November 21, 2004, the occurrence of Les Saintes event,
In this article, we present the modeling strategy, dataset, results and applications of our empirical model. This work has been previously described in an internal report (Beauducel et al., 2005), named
2 Methodology
Our goal is to produce a predictive model of macroseismic intensities with a final uncertainty of about one intensity level, paying special attention to the maximum values that will be published after each earthquake. To be usable in an operative way, the model must be applicable to a wide range of magnitudes and hypocentral distances, and, ideally, independently from its tectonic context or depth.
Due to insular configuration of Lesser Antilles, most of epicenters occur offshore: it concerns 95% of
Many empirical relations to predict earthquake ground motions have been developed for engineering purposes (see Abrahamson and Shedlock (1997), Bommer et al. (2010), Douglas (2003), Strasser et al. (2009) for a short review). Due to the necessary high precision for these specific applications (like building damage studies), models are developed using very selected datasets for specific applicability ranges of site conditions, magnitude and depth. Moreover, none of them is valid for magnitudes lower than 4.
Furthermore, a recent study Douglas et al. (2006), shows that ground motions observed on Guadeloupe and Martinique are poorly estimated by commonly-used GMPE, having smaller and more variable amplitudes than expected.
In this work, we do not intend to produce a new GMPE for the engineering community; we need a more general model with certainly higher uncertainty, but applicable over a wide range of earthquakes to be used in an operative way. In the following, we check results and residuals of our obtained PGA model as an intermediate stage, but in order to validate the choices made to produce automatic reports, we emphasize tests of the final intensity model performance in terms of medians across full range of intensity and distance applicability and beyond.
3 Intermediate PGA predictive equation
3.1 Formulation and dataset
Due to the limited database and model purpose, we use one of the simplest form of GMPEs with only 3 parameters (Berge-Thierry et al., 2003):
| (1) |
This functional form implies many hypothesis. In particular, a radial distribution of ground motion around a point source, neglecting geological heterogeneities, tectonic origin, source extension and radiation pattern. Fukushima (1996) also points out that a linear
To inverse the three parameters, we use seismic data recorded at 14 strong-motion permanent stations in Guadeloupe (see Fig. 1), with mixed site conditions, rock and soil (details about the seismic stations can be found in (Bengoubou-Valérius et al., 2008)), in the period from November 21 to December 28, 2004. The dataset includes about 400 earthquakes associated to 1430 triggers of 3-component acceleration waveforms. These events correspond to Les Saintes main shock
Locations and magnitudes come from the seismic catalog of the Guadeloupe observatory (OVSG-IPGP). Magnitudes were computed using the classical formula of duration magnitude from Lee et al. (1975) for events
For each event, a value of PGA is calculated as the maximum amplitude of horizontal acceleration signals, using the modulus of a complex vector defined by the two horizontal and orthogonal components
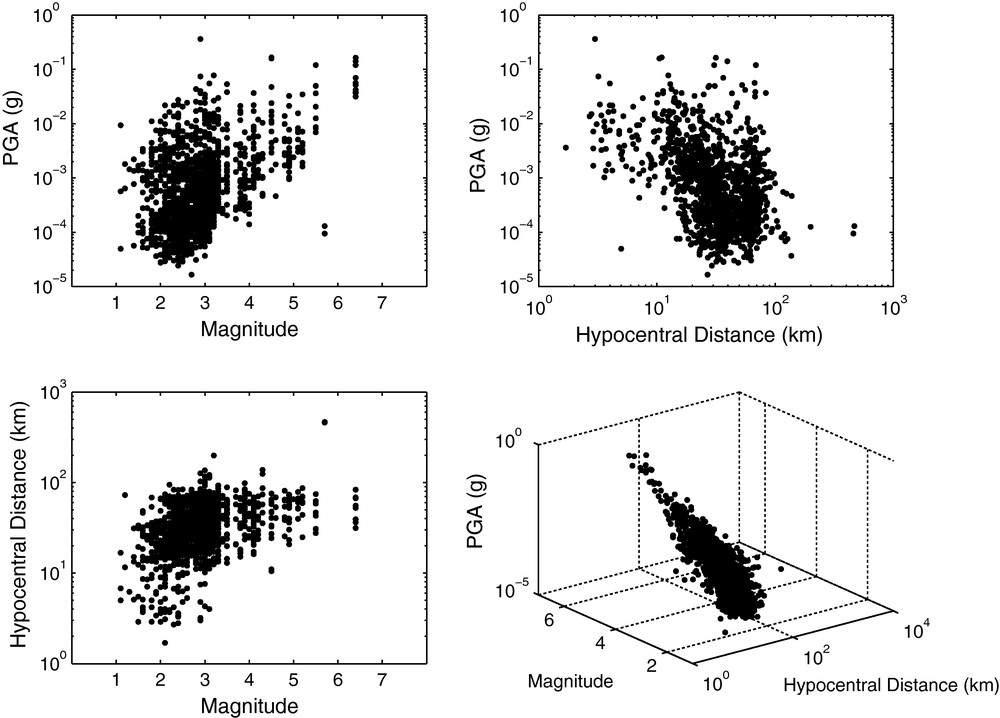
Presentation of the seismic events dataset: 1430 triggers recorded by 14 permanent accelerometer stations from 2004.11.21 to 2004.12.28. Data are presented in 3-D view for different X-Y combinations of magnitudes, hypocentral distances (in km) and PGA values (in g). In the 3-D graph the view angle has been chosen to highlight the planar characteristic of the dataset.
Données sismiques utilisées: 1430 déclenchements enregistrés par 14 stations accélérométriques permanentes entre le 21 novembre 2004 et le 28 décembre 2004. Les données sont présentées pour différentes combinaisons X-Y de magnitudes, distances hypocentrales (en km) et valeurs de PGA (en g). Sur le graphe 3D, l’angle de vue a été ajusté pour mettre en évidence l’aspect planaire du jeu de données.
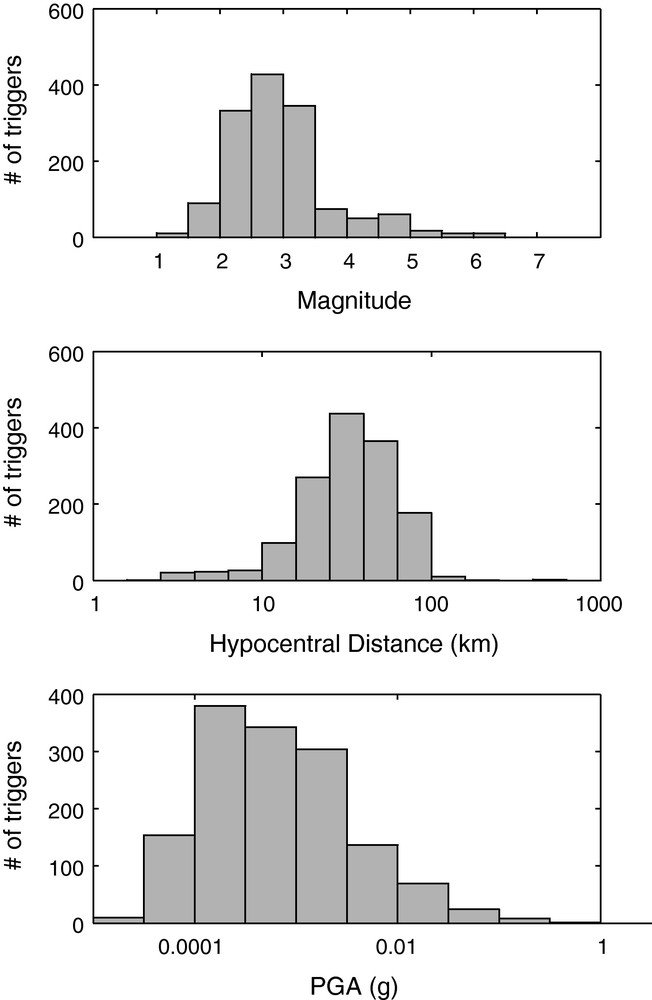
Histograms of the seismic dataset: number of trigger versus magnitude, hypocentral distance (in km) and PGA value (in g).
Histogrammes des données: nombre de déclenchements en fonction de la magnitude, de la distance hypocentrale (en km) et du PGA (en g).
3.2 Best model determination and residuals
To calculate the 3 parameters in Eq. (1), we minimized a misfit function using the
The inversion scheme yields the following parameters:
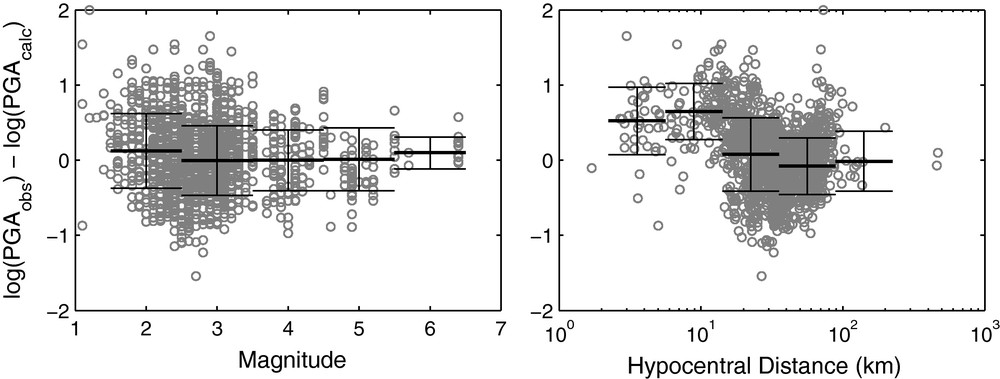
PGA model residuals distribution: difference between observed and calculated log(PGA) versus magnitude and hypocentral distance (km). Horizontal segments with error bars stand for median values and associated standard deviations for each corresponding intervals. Global sigma of PGA residuals equals 0.47 (a factor of 3).
Résidus du modèle PGA: différence entre log(PGA) observé et calculé en fonction de la magnitude et de la distance hypocentrale. Les segments horizontaux avec barres d’erreur représentent les valeurs médianes et l’écart-type associé pour chaque intervalle. L’écart-type global des résidus est égal à 0.47 (un facteur 3).
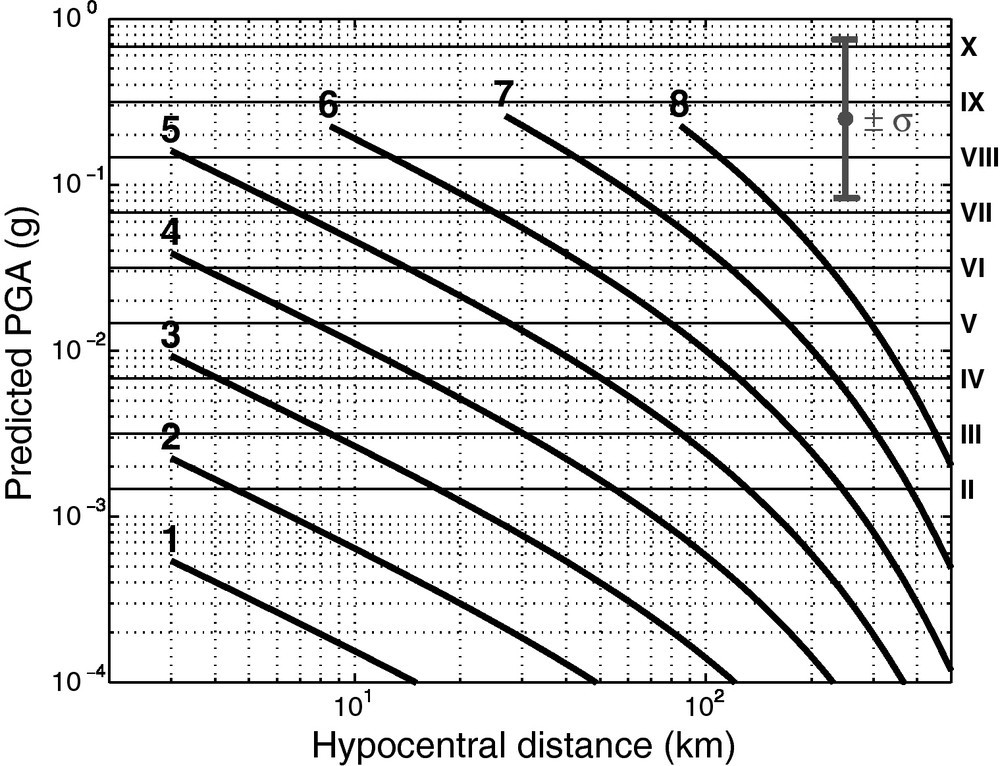
Eq. (1) with the parameters found is represented as an abacus in Fig. 5 showing calculated PGA as a function of hypocentral distance (from 3 to 500 km) and magnitudes 1 to 8.
The
Modèle
Modèle
Note that we voluntarily limited the minimum hypocentral distance for each magnitude, as we do not take into account the near fault saturation term. It is reasonable to assume that this minimum hypocentral distance is greater than rupture size. Earthquake magnitude reflects the seismic moment which is proportional to the total displacement averaged over the fault surface (Aki, 1972; Kanamori, 1977). Many authors propose a simple formula to express the relationship between magnitude and fault length or rupture area (Liebermann and Pomeroy, 1970; Mark, 1977; Wells and Coppersmith, 1994; Wyss, 1979). Here we use Wyss's formula (Wyss, 1979):
| (2) |
3.3 Examples of predicted and observed PGA
Fig. 6 shows representative events with observed PGA compared to our model predictions. We do not limit examples to the events from the dataset which reflects the previous residual analysis (Fig. 4), but present events in the period 2004 to 2007 with various depths, in crustal or subduction context, and for which sufficient triggers were available. As seen in Fig. 6, most of PGA values are predicted within the model uncertainty. Medians of
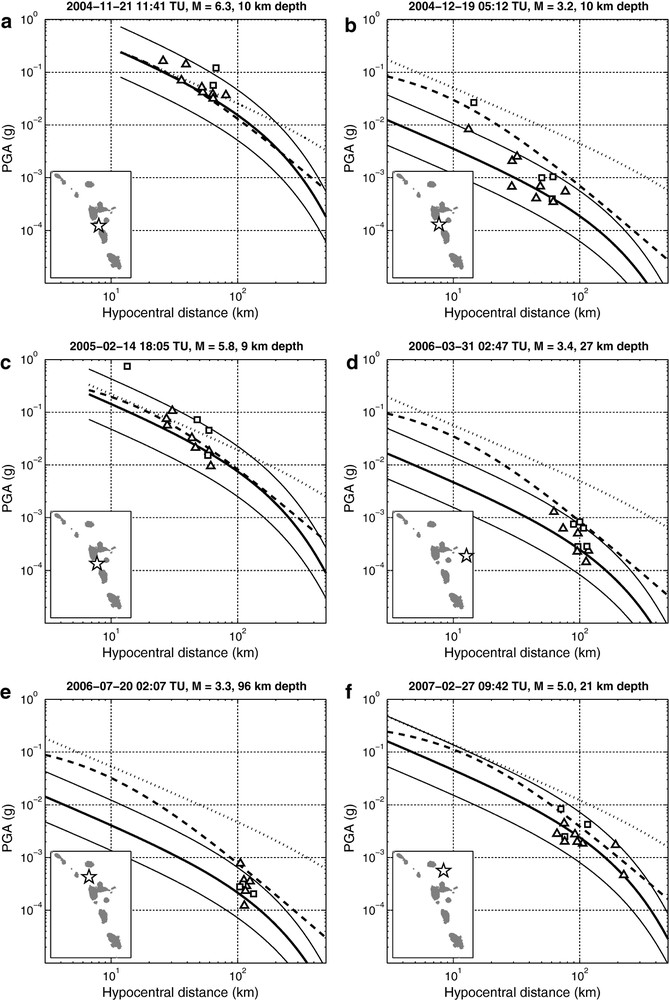
PGA prediction (solid thick curve) and uncertainty (solid thin curves) for various magnitudes and depths. The recorded PGA values are presented in squares in the case of soil site condition and in triangles for rock site condition. Are also shown other attenuation laws: Sadigh et al. (1997) (dashed curve) and Ambraseys (1995) (dotted curve). Inset maps show epicenter location for each event (star).
PGA prediction (solid thick curve) and uncertainty (solid thin curves) for various magnitudes and depths. The recorded PGA values are presented in squares in the case of soil site condition and in triangles for rock site condition. Are also shown ... Lire la suite
Prédiction des PGA (courbe épaisse) et incertitudes (courbes fines) pour différentes magnitudes et profondeurs. Les PGA observés sont présentés par des carrés pour les conditions de site type sol, et par des triangles pour les conditions de site type roche. Sont aussi indiquées d’autres lois d’atténuation: Sadigh et al. (1997) (courbe tiretée) et Ambraseys (1995) (courbe pointillée). Les cartes en encart indiquent la position de l’épicentre pour chaque événement (étoile).
Prédiction des PGA (courbe épaisse) et incertitudes (courbes fines) pour différentes magnitudes et profondeurs. Les PGA observés sont présentés par des carrés pour les conditions de site type sol, et par des triangles pour les conditions de site type roche. ... Lire la suite
We also compare these results with two published GMPE adapted to shallow crustal events: Sadigh et al. (1997) and Ambraseys (1995). The Sadigh et al. (1997) model is very similar to our PGA model for magnitudes
4 Macroseismic intensities
4.1 Formulation
Although we know that the spectral frequency content of ground acceleration and peak velocity have important implications on building damage, establishing a direct relation between a single PGA value and macroseismic intensity has proved its efficiency in many cases (Chiaruttini and Siro, 1981; Margottini et al., 1992; Murphy et al., 1977; Wald et al., 1999). For the Lesser Antilles, we follow the suggestion of Feuillard (1985) who studied the historical and instrumental seismicity using the simple empirical relation of Gutenberg and Richter (1942):
| (3) |
| (4) |
Note that following the MSK scale, intensity must be an integer value. In this article, we decided arbitrarily to round
The resulting model for intensities is presented as right
4.2 Intensity model residuals
We test our model on a database of 20 recent earthquakes for which we have intensity reports (a total of 254 observations) as well as instrumental magnitudes and hypocenter locations. Events are from various origins with magnitudes 1.6 to 7.4, distances from 4 to 500 km, and observed intensities from I to VIII. This wide panel of event characteristics allows us to check our model applicability.
We present in Fig. 7 the intensity residuals versus observed intensity and hypocentral distance. Global standard deviation equal 0.8, with a near zero median value. Residuals are also well distributed over the intensity and distance ranges. Since this database is not statistically sufficient, we will keep uncertainty on intensities deduced from the PGA residuals, i.e.,
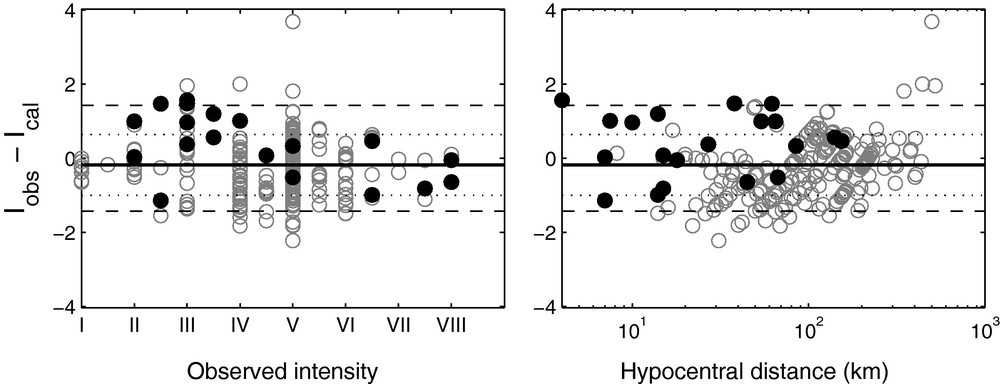
Intensity model residuals distribution for 20 earthquakes (254 macroseismic observations): difference between observed and calculated intensities versus observed intensity and hypocentral distance (km). Solid black circles indicate the maximum observed intensity for each event. Thick black line = median value (
Distribution des résidus du modèle prédictif des intensités pour 20 séismes (254 observations macrosismiques): différence entre intensité observée et calculée en fonction des intensités observées et de la distance hypocentrale (km). Les disques noirs indiquent l’intensité observée maximum pour chaque événement. Ligne épaisse = valeur médiane (
4.3 Examples of simulated and observed intensities
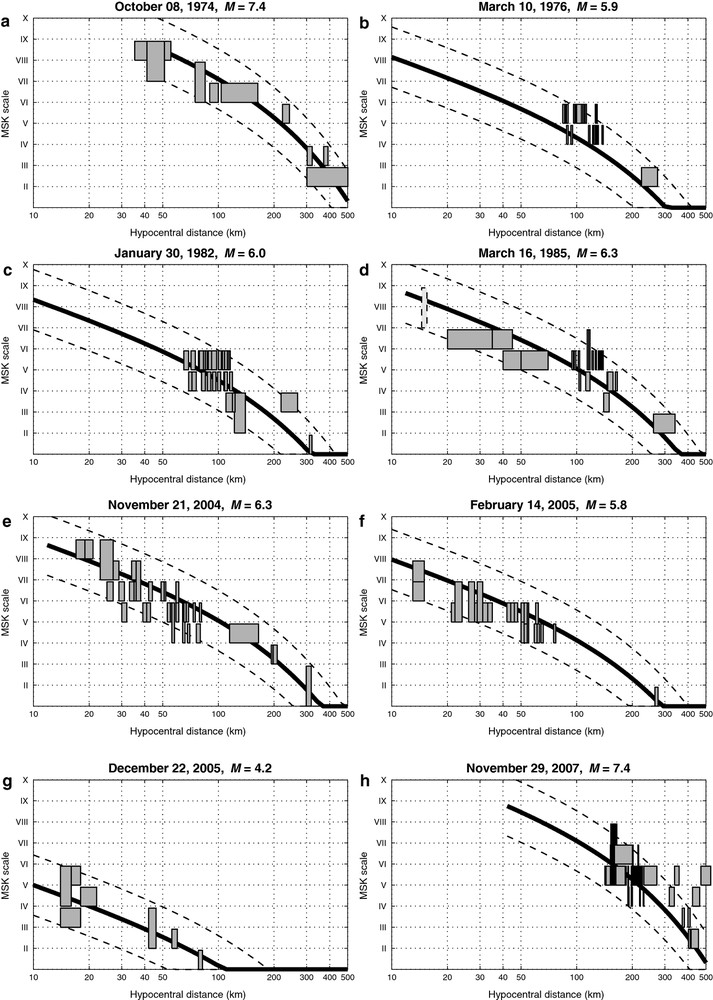
In Fig. 8, we detail eight examples of the most significant events with observed and predicted intensities (see epicenters in Fig. 1).
Examples of
Examples of
Exemples des intensités prédites
Exemples des intensités prédites
Fig. 8a shows the October 10, 1974 “Antigua” earthquake (McCann et al., 1982; Tomblin and Aspinall, 1975),
Fig. 8b shows the March 10, 1976 earthquake, a magnitude
Fig. 8c shows the January 30, 1982 earthquake, a magnitude
Fig. 8d shows the March 16, 1985 “Redonda” earthquake (Feuillet et al., 2010; Girardin et al., 1991), a magnitude
Fig. 8e shows the November 21, 2004 Les Saintes main shock earthquake of magnitude
Fig. 8f shows the largest Les Saintes aftershock, on February 14, 2005 of magnitude
Fig. 8g shows one of the numerous Les Saintes aftershocks, on December 22, 2005 of magnitude
Fig. 8h shows the November 29, 2007 Martinique intermediate-depth (152 km) intraslab earthquake of magnitude
These eight examples confirm that
5 Automatic intensity report
These good results and the apparent robustness of the
This simulation allows us: (1) to confirm that inhabitants may have (or not) felt the event when intensity interval varies from II to III in a town; and (2) to publish immediately and blindly (without any testimonies) the information of a possible felt earthquake when the predicted maximum intensity reaches IV, which means a 68% confidence level for an intensity between I-II and IV.
The report (see an example in Fig. 9) includes a synthetic text resuming the date, location and type of event, the maximum intensity prediction value and corresponding town name and distance. To better take into account potential site effects and increase the precision of the result, the average prediction is given together with the upper limit value (
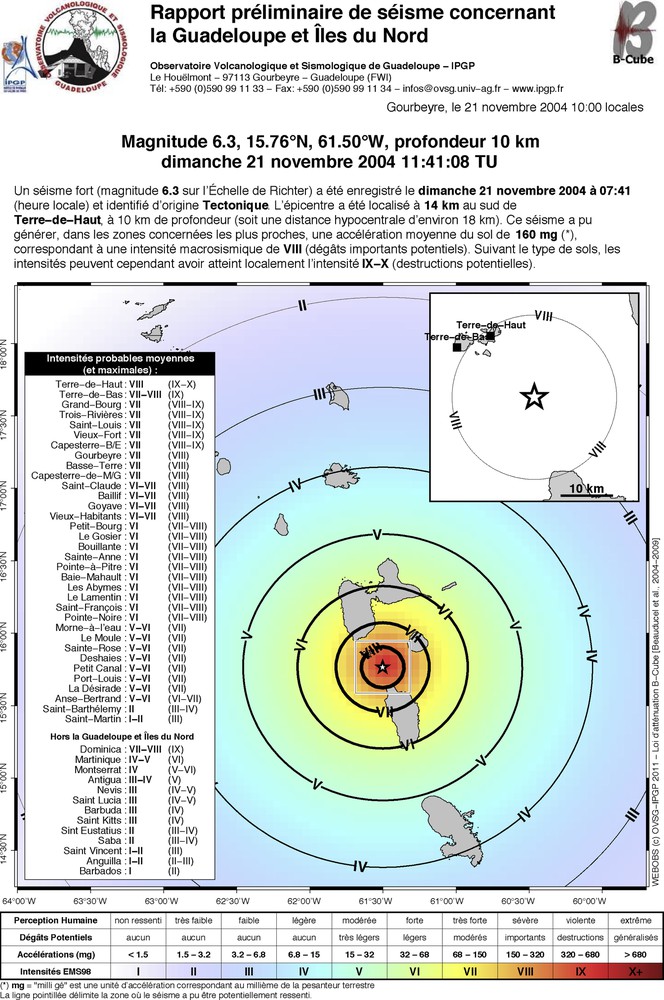
Example of observatory communiqué published in case of potential felt event: here an a posteriori simulation of Les Saintes main shock (data from OVSG-IPGP). The
Title: “Preliminary report of earthquake in Guadeloupe and Northern Islands”
Main text: “A strong earthquake (magnitude 6.3 on the Richter Scale) was recorded on Sunday, November 21, 2004 at 07:41 (local time) and identified with tectonic origin. The epicenter was located 14 km south of Terre-de-Haut, 10 km-depth (hypocentral distance of about 18 km). This earthquake may have generated, in the closest areas from epicenter, an average ground acceleration of 160 mg (*), corresponding to macroseismic intensity of VIII (severe potential damages). However, depending on the type of soil, the intensities may have reached locally an intensity of IX-X (potential destructions).” Masquer
Main text: “A strong earthquake (magnitude 6.3 on the Richter Scale) was recorded on Sunday, November 21, 2004 at 07:41 (local time) and identified with tectonic origin. The epicenter was located 14 km south of Terre-de-Haut, 10 km-depth (hypocentral ... Lire la suite
Towns list: “Average (and maximum) probable intensities:”
Table: “Human perception / Potential damages / Accelerations (mg) / MSK Intensity”
Note: “(*) ‘mg’ is a unit of acceleration equal to one thousandth of Earth's gravity”
Exemple de communiqué publié par l’observatoire en cas de séisme ressenti: ici une simulation a posteriori du séisme des Saintes (données OVSG-IPGP). Le modèle
The report also includes a location map that presents the islands and towns, earthquake epicenter and theoretical isoseist curves using a shaded color map. A detailed table legend explains the MSK scale and corresponding name, color, PGA interval, potential damage and human perception.
6 Discussion and conclusions
We propose a simple empirical model for macroseismic intensities prediction for observatory operational purpose. The model is based on intermediate PGA model that has been adjusted using a shallow crustal normal-fault sequence of events. The functional form is only 3-parameters dependent which implies many assumptions and simplifications, but makes it also extremely robust with an uncertainty higher than usual GMPE (a factor of 3). This can be explained also by the fact that we do not select specific site conditions in the database, mixing rock and soil stations. The obtained PGA model has strong potential limits and may not be very useful for engineering purposes, but it exhibits a better fit than previous existing GMPE for Lesser Antilles. Its application domain should be limited to crustal events, magnitude range up to 6.3, and distance range up to 100–200 km.
The deduced intensity model is tested on a wider range of magnitudes, distances and source types of earthquakes. We suggest that the
This model is currently used to produce automatic reports in Guadeloupe (since January 2005) and Martinique (since September 2008) observatories in order to anticipate potentially felt events immediately after the location and magnitude calculation. On a total amount of about
During more than 5 years of continuous seismic monitoring and thanks to inhabitants testimonies, the
The reports were also used for seismic hazard awareness and education of the public and local authorities. Particularly, explaining the fundamental difference between magnitude and intensity of an earthquake, the MSK scale, the uncertainty of prediction due to the law's empirical aspect and simplicity, and the potential site condition effects, thus earthquake-resistant construction advice.
Acknowledgments
FB thanks Pascal Bernard and Nathalie Feuillet for useful discussions, Victor Huerfano and Fabrice Cotton for very constructive comments that helped us to greatly improve the initial manuscript. Acceleration data come from the French national strong motion permanent network Réseau Accélérométrique Permanent (RAP), available at http://www-rap.obs.ujf-grenoble.fr/. Stations have been installed and maintained from 2002 to 2004 thanks to the effort of technicians from the observatory of Guadeloupe (OVSG-IPGP): Alberto Tarchini