

1 Introduction
This study is focused in locating, characterizing and quantifying small topographic deformations caused by the collapse of the underground mines in the southern Atlas of Tunisia.
The studied area is located in South-central Tunisia (Fig. 1). It is characterized by the abundance of human mining activity: more specifically the presence of underground phosphate mines.

Location, morphological and seismotectonic contexts of the studied area and towns, outcrops and mines of phosphates (superimposed on altitudinal SRTM data): fault (Hfaiedh et al., 1991); instrumental (for the 1975–2010 period) seismological data were provided by the National Meteorological Institute (Tunis); names of major folded units. (Shading parameters of SRTM data: Azimuth = N315°E, Altitude = 45°).
Localisation et contextes morphologique et sismotectonique de la zone d’étude et villes, affleurements et mines de phosphates (superposé sur les données altitudinales SRTM) : failles (Hfaiedh et al., 1991) ; données sismologiques instrumentales (pendant la période 1975–2010) de l’Institue nationale de météorologie (Tunis) ; principales structures plissées dans le secteur d’étude. (Paramètres d’estompage des données SRTM : Azimut = N315°E, Altitude = 45°).
The environment of these mines is generally unstable and depends upon several factors, such as the geological (Contrucci et al., in press), or tectonic contexts (Li et al., 2004); as well as the structure of the mines (Hewitson, 1995; Wang et al., 2008); etc. The distribution of this stability may appear by the subsidence of the outcropping surrounding grounds (Wang et al., 2008). Also, in most of cases, mines are located near urban areas, so our work is considered as a risk study (Taboada Castro et al., 1994) especially in urban vicinities. The study of this risk goes through by the precise location of the collapsed zones.
These small displacements of the topography are very difficult to measure through classical methods (leveling comparisons, GPS repeated measurements, etc.), as they are time consuming and rather expensive, and they have only a local spatial representation.
So, the method adopted here is radar interferometry (DInSAR) using ERS 1 and 2 radar images frequently used to study mines subsidence (Massonnet et al., 1993; Carnec et al., 1996; Guéguen et al., 2009; Herrera et al., 2010; Jiang et al., 2011; Ng et al., 2009; Perski et al., 2009; Yang et al., 2010).
2 Characteristics of the South-central Tunisia
To study hazard mine workings, we need to know the geological, seismologic, tectonic and morphological context of the studied area.
2.1 Geological, seismotectonic and geomorphological context
As shown in the Fig. 1, the study area is truncated by several well known faults; the most important is the Gafsa fault, which played a major role during the Mesozoic and Cenozoic time periods (Boukadi, 1994; Saïd et al., 2011). The different orientations of faults reflect a succession of tectonic cycles (Zouari, 1995) that are closely linked with the global tectonic setting (Delteil et al., 1991; Martinez and Truillet, 1987). But the major event responsible for implementing most of the present reliefs corresponds to the post-Villafranchian period (Ahmadi, 2006).
In the southern Atlas of Tunisia, this tectonic setting, associated with erosion, led to the creation of large plains and Chotts (Coque, 1962; Roudaire, 1977) and of the four Chain (Boukadi, 1994; Zargouni, 1985): the Gafsa Chain, the Moulares Chain, the Metlaoui Chain and the North of Chotts Chain (Fig. 1).
From the Instrumental seismological data (for the 1975–2010 period) provided by the National Meteorological Institute (Fig. 1), the study area is characterized by an important earthquake potential proved by the remarkable concentration of the epicentres.
According to the Tunisian geological map at 1/500,000 scale, carried out by the National office of the Mines published in 1985, the geological outcrops of the study area vary from Triassic to Quaternary times (Castany, 1951). The litho-stratigraphic series of the southern Atlas (Chaabani, 1995) shows herein a remarkable predominance of clays, evaporites and carbonates alternance.
2.2 Mining of phosphates
The phosphate deposits correspond to rocks of sandy aspect, generally friable, the color of which clearly varies from yellowish or graywish to brownwish. Their density varies from 2 to 2.2.
In Tunisia, the phosphated deposits, in which apatite is the predominant mineral, were discovered in 1885 by Philippe Thomas in Foum Thelja located in the Gafsa-Basin near the Metlaoui city. The principal phosphatic deposits are fini-Paleocene to Lower Eocene in age (Burollet, 1956). They correspond mainly to the Chouabine formation.
Their exploitation began in 1896 with the creation of “The Phosphates and Railroad Company of Gafsa”. Since this date and until the end of the 1970s, the exploitation was done by underground mines and the principal centers of exploitation were Metlaoui (opening in 1899), Moulares (opening in 1904), Redeyef (opening in 1903) and Mdhilla (opening in 1920) (see location on Fig. 1).
In these places, the depth and slope of the phosphate layers can vary very considerably, which is mainly explained by the geological and tectonic context of this area, that is the case shown in Moulares area (Fig. 2).
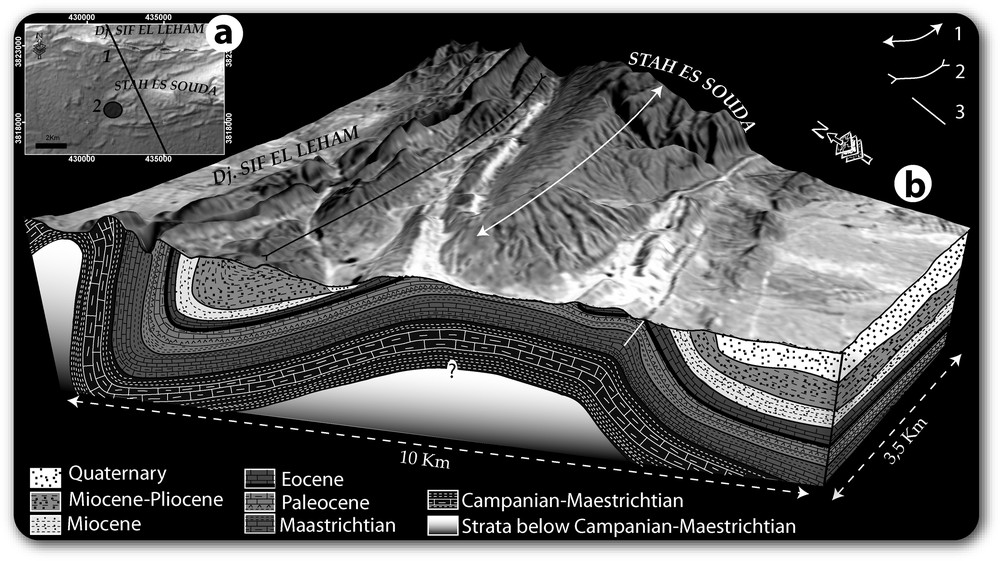
Sub-surface geology of the Moulares area: a: situation of the geological section (1: location on the DEM; 2: subsidence area); b: geological section, realized from a geological map of Moulares and Metlaoui at 1/100,000 scale, showing the phosphates distribution (black layer in the Lower Eocene) 1: anticline; 2: syncline; 3: fault.
Géologie en sub-surface de la zone de Moulares : a : situation de la coupe (1 : situation de la coupe sur le MNT ; 2 : zone de subsidence) ; b : coupe géologique, réalisée à partir des cartes géologiques de Moulares et de Metlaoui à l’échelle de 1/100 000e, montrant la répartition des phosphates (en couche noire à la base de l’Eocène) 1 : anticlinal ; 2 : synclinal ; 3 : faille.
The phosphatic series includes nine phosphatic layers numbered I to IX (Sassi, 1974). Only layers II, V-VI and VII-VIII were subject to intense exploitation (Fig. 3).
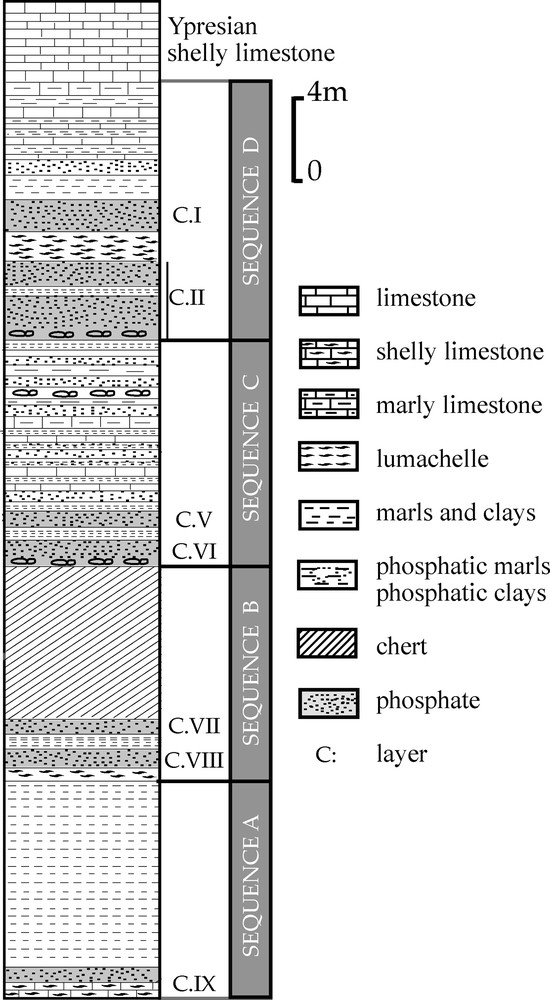
Lithologic profile of the main phosphate series of Gafsa-Basin showing the sequential deposits (modified from Sassi (1974)).
Profil lithologique de la série phosphatée principale du Bassin de Gafsa montrant les différentes séquences (modifié d’après Sassi (1974)).
The yield of the exploitation depends especially on the adopted mining method; this one depends on the properties of the roof and on the conditions of exploitation (e.g. location of water table from the mine, depth of phosphates layers and so on).
Thus the underground exploitation, for example in the Moulares mines (Fig. 4), by the traditional method, has a low yield (> 40%). Since the 21st century, with the evolution of the means of extraction, the exploitation was progressively developed up to the surface mining exploitation.

Phosphates exploitation in Moulares mines: a: disposition of exploited layers in the studied area; b: schematic structuration of mines (spacing between pillars and their dimensions are variable).
Exploitation des phosphates dans les mines de Moulares : a : disposition des couches exploitées dans la zone d’étude ; b : structure schématique d’une mine (l’espacement entre les piliers ainsi que leurs dimensions sont variables).
But, often, the underground work is accompanied by small visible collapse visible on the surface (e.g. Hoffmann et al., 2003; Jiang et al., 2011; Kuenzer et al., 2007; Yang et al., 2010). The collapse extension depends on the extracted volume thus created. This “disturbance” involves visual negative impacts and damage of the basic infrastructure in an urban area.
3 Processing differential interferometry data
Radar Interferometry uses the phase information contained in the radar images in order to measure the time of the two ways route of the signal then transformed into a distance (Graham, 1974). It is based on the difference in phase pixel to pixel of two radar images acquired at the time of two passages of a radar satellite above the same zone in similar conditions of image acquisition (Gabriel et al., 1989; Hanssen et al., 1999; Rosen et al., 2000; Zebker and Goldstein, 1986). This difference in phase makes it possible to measure the relief of the ground, but also to reach possible to monitor the displacements of the ground, which took place between two acquisitions. The phase-difference pattern over the imaged area can then be visualized by color fringes that contain several types of information (Massonnet and Feigl, 1998; Rosen et al., 2000;…):
The DinSAR technique made it possible to detect and prove small displacements of the ground related to many causes e.g., volcanic monitoring, earthquake, urban subsiding activities (Fruneau et al., 2005; Massonnet et al., 1993, 1994; Meyer et al., 1998; Pathier, 2003), especially those that are caused by mining activity (e.g. Guéguen et al., 2009; Jiang et al., 2011; Ng et al., 2009).
During the selection of the radar images, several parameters were taken into account: the relative Doppler centroid difference, the magnitude of the perpendicular baseline, the temporal extension between the two image's acquisition, the relief geometry and the shade effects.
In this study, we used 17 radar images acquired by both ERS-1 and ERS-2 satellites (C-band, 56 mm wavelength) between 1992 and 2001 (Table 1), and processed differential interferograms, removing the topographic contribution with a SRTM DEM (90 × 90 m resolution) provided by NASA. Interferometric pairs have been selected according to their perpendicular baseline: they all have ‘good’ baselines, lower than 300 m.
Images radar utilisées d’après l’Atlas méridional de la Tunisie (Trace : 394, Quadrant : 2907, Trajet : D).
| Date | Orbit | Mission | |
| 1 | 24/04/1992 | 4046 | ERS-1 |
| 2 | 29/05/1992 | 4547 | ERS-1 |
| 3 | 07/08/1992 | 5549 | ERS-1 |
| 4 | 05/03/1993 | 8555 | ERS-1 |
| 5 | 14/05/1993 | 9557 | ERS-1 |
| 6 | 11/06/1995 | 20,422 | ERS-1 |
| 7 | 17/07/1995 | 1250 | ERS-2 |
| 8 | 25/09/1995 | 2252 | ERS-2 |
| 9 | 08/01/1996 | 3755 | ERS-2 |
| 10 | 30/06/1996 | 25,933 | ERS-1 |
| 11 | 14/10/1996 | 7763 | ERS-2 |
| 12 | 16/02/1998 | 14,777 | ERS-2 |
| 13 | 10/08/1998 | 17,282 | ERS-2 |
| 14 | 08/03/1999 | 20,288 | ERS-2 |
| 15 | 17/01/2000 | 24,797 | ERS-2 |
| 16 | 01/05/2000 | 26,300 | ERS-2 |
| 17 | 01/01/2001 | 29,807 | ERS-2 |
The estimate of displacement passes by several stages: extraction of the data, update of the orbits radar, multilooked of radar images, generation of the interferograms, interferogram flattening, the creation of the coherence images, unwrapped phase (Costantini and Rosen, 1999), geocoding and the cartography of displacement.
For update of the orbits radar, we employed the precise orbits (DEOS) produced by the “Delft Institute for Earth-Oriented Space Research” (http://www.deos.tudelft.nl/ers/precorbs). The orbit correction, by taking account of the error, will involve the correction of the parameters of the radar images (Scharroo and Visser, 1998).
The SAR of the ERS-1 and ERS-2 satellites provides an amplitude and a phase value for every resolution cell of approximately 4 m in azimuth and 20 m in range (Hanssen, 2002). Since this original resolution, the data must be multilooked. During this treatment, the interferograms were multilooked by five in azimuth direction (Perski et al., 2009). So, the final resolution obtained of the interférogram analyzed here and the deformation results is approximately 20 × 20 m.
The elimination of the topographic fringes was done through the introduction of a Digital Elevation Model (Massonnet et al., 1993). We tested two types of DEM: the Shuttle Radar Topography Mission (SRTM) with a resolution of 90 × 90 m and the ASTER Global Digital Elevation Model (ASTER GDEM) of a 30 × 30 m ground resolution.
Our treatment showed that the SRTM is ready to eliminate more of the topographic fringe although some persist. This may be explained by the succession of treatments to improve the quality SRTM data (Rabus et al., 2003).
In this study, we calculated, with SARscape Modules in ENVI® Environment (www.sarmap.ch), 37 interferograms using 17 radar images from 1992 to 2001 (Fig. 5). This choice has been limited to interferograms with spatial and temporal baselines smaller than 300 m and 1000 days, respectively, and Doppler centroid differences below 300 Hz.
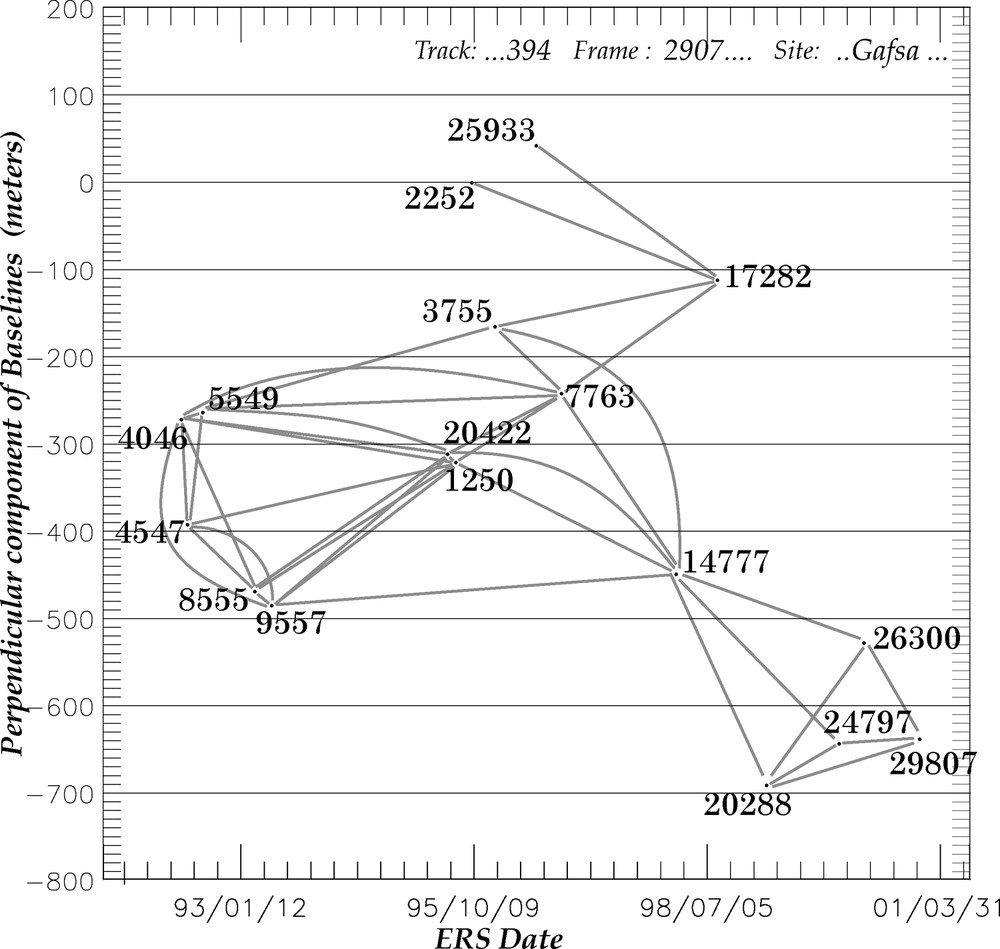
Diagram of available ERS-1/2 images for descending track 394, frame 2907. Relative. perpendicular baselines are plotted as a function of acquisition dates. The 17 SAR images are combined into 37 interferograms (grey segments).
Diagramme des images ERS-1/2 disponibles pour la trace descendante 394, quadrant 2907. Les lignes de base perpendiculaires sont tracées en fonction des dates d’acquisition. 37 interférogrammes (segments gris) sont calculés à partir des 17 images radar.
In most of these interferograms, we observed many artefacts. This major disadvantage is due to the varying atmospheric conditions between the two radar images used to form an interferogram (Fruneau et al., 2005; Goldstein, 1995; Hanssen et al., 1999).
The analysis of the coherence images shows that the coherence persists in hard formations e.g. the limestones and the dolomites and decrease in soft ground e.g. the alluvia and silt.
4 Results
Through the DinSAR method, two zones of subsidence were identified. These two zones are located in the southern part of the Moulares chain and more exactly at 500 m to the north of the Moulares city (cf. Fig. 6). These subsidence areas are located above the phosphates mining area.
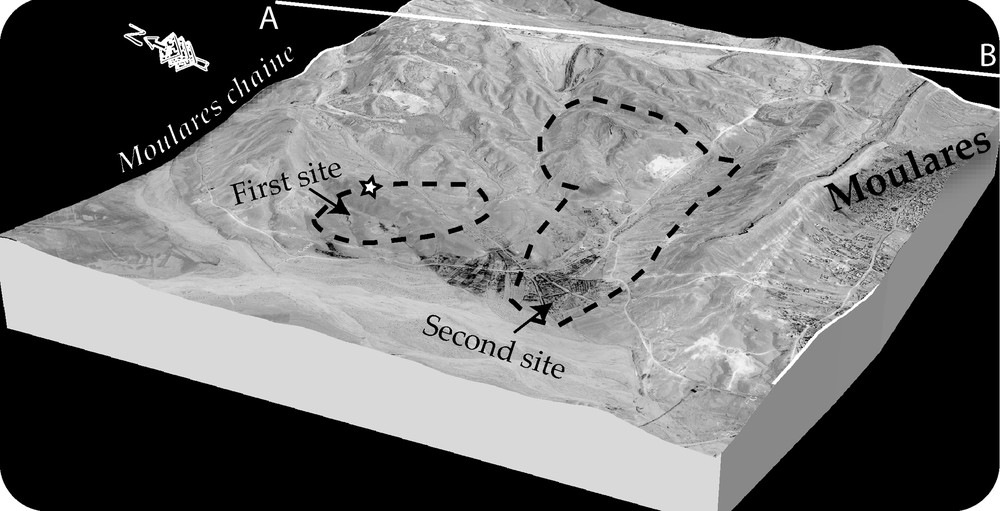
Location and extension of the two Moulares sites of subsidence on 3D view (the star indicates the observation shown in Fig. 8; AB: location of the geological section shown in Fig. 2).
Localisation des deux sites présentant des mouvements de terrain sur le bloc 3D (l’étoile indique l’observation schématisée à la Fig. 8 ; AB : emplacement de la coupe géologique illustrée à la Fig. 2).
Based on interferometric processing, we can confirm that displacement developed between 24/04/1992 (orbit 4046) and 14/05/1993(orbit 9557). However, because of absence of the radar images before 1992, we do not know when this phenomenon started.
To monitor these collapses, we choose, to represent the variation of displacements between only three data (Fig. 7): Figs. 7a and b show that between years 1992 and 1993 subsidence progressed in altimetric (max = 7 cm) and planimetric dimensions (1.3 km2). The monitoring displacements along profile during the analysed period are shown in Fig. 7c. These profiles indicate a non-linear deformation: a small deformation in the northeastern side and a relatively high subsidence in the southwestern side and in the central area.

Evolution of the subsidence with three interferograms: a: interferograms; b: deduced displacement maps; c: example of displacement profile (along the black line on b).
Évolution de la subsidence à partir de trois interférogrammes: a : interférogrammes ; b : carte des déplacements ; c : exemple de profil de déplacements (cf. localisation sur carte b).
The major part of the collapse zones herein is located on a silty zone of Upper Holocene; therefore the coherence decreases through long time scale. This loss of radar coherence (Zebker and Villasenor, 1992), limits the use and interpretation of some interferograms, for example the interferogram 9557–20422 between 14/05/1993 and 11/06/1995 and the interferogram 9557–1250 between 14/05/1993 and 17/07/1995.
From 14/05/1993 to 11/06/1995, this loss of coherence prevents to verify the presence of any displacement of the topography.
All the interferogramms calculated using two images acquired after 11/06/1995 (Orbit 20422), show no indication of displacement.
For the other mining sites covered by the full interferograms (Mdilla, Metlaoui, Redeyef), the technique DInSAR has not revealed any subsidence during the period covered by the 17 radar images (from 24/04/1992 to 01/01/2001). This may partly be explained by the loss of radar coherence in these zones.
5 Discussion
The subsidence revealed by DInSAR is clearly linked to the mining activity on this area. The phosphates exploitation in mines of Moulares started in years 1975 and stopped, in the collapse zone, in the late 1990s. So the collapse observed, took place after the stoppage of exploitation activity.
The underground mines of phosphates, as for other mining products, in the majority of the cases are structured in levels. In the case of the Moulares mine, the mining method used is that of the rooms (exploited space) and of the pillars (which are used for roof supporting) (Fig. 4). Spacing between the pillars like their dimensions, vary according to the nature and the mechanics characteristics of the exploited rock and the importance of the roof supporting. In the Moulares mine, the exploitation was first manual, semi automatic and automatic.
After exploitation, the underground mines often remain during years in a metastable state. Their collapse could be caused also by:
- • natural or antropic seismic activity, even of small amplitude (Phillips et al., 1996; Plattner et al., 2010; Taylor, 1994). In the study area, the National Meteorological Institute (Tunis) is reporting an earthquake with a magnitude of 4.20 that struck on 30/08/1989 in 5 km east of Moulares city (Fig. 1). This earthquake can be a trigger for the subsidence of land;
- • intensive water infiltration which can involve the swelling of argillaceous materials (Chaplin et al., 2007);
- • gone up piezometric level of a water table (O’Connor and Murphy, 1997; O’Connor et al., 2004). Indeed, in the case of the Moulares mine the exploited phosphates reach the Eocene ground water. The level of water is maintained rather low by a continuous pumping during the workflow to facilitate the exploitation. The stop of this water pumping, following the closing of the mine, would have involved a raise of the water table and the flood within the galleries of the mine that may caused the acceleration of the topographic subsidence.
On the field, the collapse of the underground mines of phosphates is manifested on the surface by the arcuate geometry of the scarp associated with a vertical component (e.g. Fig. 8). Many measurements were taken, they have permitted to quantify a variable rate of vertical displcament (from 1 cm to 5 cm). The highest value (5 cm) is observed in the first site (indicated by the star in Fig. 6 and schematized in Fig. 8).

Observed site of subsidence (location indicated by the star in Fig. 6): a: subsidence on the ground; b: schematic 3D view of the origin of subsidence (the subsidence affects only the layers above the phosphates mines).
Subsidence avérée (localisation indiquée par une étoile sur la Fig. 6) : a : subsidence sur le terrain ; b : bloc diagramme 3D proposant un modèle pour la subsidence. (la subsidence n’affecte que les couches situées au-dessus des couches de phosphates exploitées).
6 Conclusions
In this article, we first applied the DinSAR method in Tunisia in order to detect and monitor the ground displacements due to post-mining activities of the phosphates extraction at depth, in South-central Tunisia. This paper described an approach to map the mining subsidence by using 17 images radar in the southern Atlas of Tunisia.
The results of DInSAR method reveal two localized subsidence areas. This subsidence, verified and confirmed on the ground is likely to, represents the post-mining consequences of the production stoppage, in the collapse zone, in the late 1990s. The analysis of a cross section of displacement profile in this zone shows that, the spatial extension of the deformation submitted to underground mining, is very large and is non-linear. This total subsiding displacement may reach a value of 7 cm locally in one year (from 29/05/1992 to 14/05/1993).
The collapse can trigger a series of local events as is the case of the retsof salt mine collapse in the Genesee Valley, New York, occurred in 1994 (Kappel et al., 1999) or the case of collapse of the Merkers mine in Volkershausen, Germany, occurred in 1873 (Whyatt and Varley., 2008). This same phenomenon can occur in our study area and may affect Moulares city for two reasons:
- • the area of subsidence is located near (at 500 m) from this urban area;
- • the Moulares city is located on layers of phosphates (Fig. 2) that can be exploited already.
Then this phenomenon represents a real landslide risk, which requires a real monitoring to be able to better understand it and to develop prediction models of ground subsidence, which is possible by implantation of a GPS network survey, which covers the mining zone in southern-central Atlas of Tunisia.
Acknowledgements
We thank Salem Trabelsi and Jean Mark Houssey from the CGG-Veritas-Tunisia company for their contribution in this study through the purchase for the images radar ERS 1/2. We also thank the inhabitants of the Moulares city for their kind co-operation. Finally, we appreciate the work of the two anonymous reviewers that improve this manuscript.