

1 Introduction
Hydrological processes are usually regarded as stationary; however, there is growing evidence of trends, which may be related to anthropogenic influences and natural features of climate system (IPCC, 2007). Serious concerns are drawn on the catastrophic nature of floods, droughts and storms, caused due to the significant variations in the regional climate including the rainfall pattern taking place on regional level. Trends in precipitation have been observed for last one century in many parts of globe. Over this period, precipitation increased significantly in eastern parts of North and South America, northern Europe and northern and central Asia whereas precipitation declined in the Sahel, the Mediterranean, southern Africa and parts of southern Asia (IPCC, 2007). Increasing trends were reported by Suppiah and Hennessy (1998) over Australia and by Burns et al. (2007) over New York, USA. On the other hand, decreasing trends in rainfall are reported by Buffoni et al. (1999) in Central-South Italy, in Kenya (Kipkorir, 2002) and in Northeast of Brazil (Silva, 2004). While mixed trends of increasing and decreasing rainfall are observed by Modarres and Silva (2007) in Iran and more.
The Asian monsoon circulation influences most of the tropics and subtropics of the eastern Hemisphere and a major portion of the Earth's population. The southwest (summer) and the northeast (winter) monsoons influence weather and climate between 30 N and 30 S over the African, Indian and Asian land masses (Reddy and Salvekar, 2003). The variability in the monsoon rainfall depends heavily upon the sea surface temperature anomaly over the Indian Ocean (Clark et al., 2000). The elements of the monsoon system include (Krishnamurti and Bhalme, 1976):
- • the pressure of the monsoon trough, pressure of the Mascarene high;
- • the cross-equatorial low-level jet, Tibetan high, tropical easterly jet;
- • the monsoon cloud cover, monsoon rainfall, dry static stability of the lower troposphere;
- • the moist static stability of the lower troposphere.
In the context of climate change, it is important to determine whether the characteristics of Indian summer monsoon are changing as well. The necessity for trend analysis of Indian summer monsoon rainfall has been emphasized by Guhathakurta and Rajeevan (2008). Rainfall trend over the Indian subcontinent and its relation with El Niño and the Southern Oscillation has been discussed in Sarkar et al. (2004), where it has been revealed that the effect of the El Niño and the Southern Oscillation has increased in recent years but has failed to influence the Indian rainfall because of the stronger circulation pattern prevailing over India during the last few decades. Bhaskaran et al. (1995) and May (2002) revealed a considerable increase in moisture transport into India and identified this increase as a possible cause of increase in extreme precipitation events over India. Sen Roy and Balling (2004) observed an increase in extreme rainfall events in India and also found that the increase is strongest in a region extending from the northwestern Himalayas in Kashmir through most of the Deccan Plateau in the southern peninsular region of India. Goswami et al. (2006) showed that the Northeast and the west coast of India are regions of high mean and high variability of rainfall events and revealed the strong influence of local orography on the rainfall over both regions. Trends in rainfall in the regional scale over India were investigated by Parthasarathy and Dhar (1974), where the trends in rainfall over 31 subdivisions of India were investigated using the sixty years data. Parthasarathy and Dhar (1974) witnessed positive trends over the central India and parts of Northeast and Northwest India. Likewise, some studies on rainfall analysis over different parts of India are also available in literature (Kothyari and Singh, 1996; Mirza et al., 1998; Parthasarathy, 1984; Parthasarathy and Dhar, 1978; Rupa et al., 1992; Singh et al., 2008). Malaria is major public health concern in the Northeast India that continues to dampen the equitable socio-economic development of the region (Dev et al., 2003). Among seven sister states of Northeast India, Assam witnessed much of the research investigations related to malaria epidemiology and control (Dev, 2009). A significant temporal change in the rainfall pattern of a subtropical region plays an important role in the seasonal and annual variability of mosquito-borne parasitic disease like malaria (Pascual et al., 2008; Zhou et al., 2004). The focal outbreaks of Plasmodium falciparum malaria frequently occur in the Northeast India particularly during the rainy season, i.e., during the months of April to September. It is believed that any rise in the minimum temperature caused by global warming might increase the incidence of P. falciparum malaria substantially (Dev and Dash, 2007). A handful of studies have indicated the usefulness of studying the influence of climate change on vector production and malaria transmission over various parts of India. Some significant examples in this direction are: Bhattacharya et al. (2006); Dev (2009); Dev et al. (2010); Singh and Sharma (2002); Singh et al. (2004). Dev (2009) reported no significant association between absolute rainfall and inter annual variation in malaria cases in Assam, Northeast India. Given these studies, the necessity for studying the rainfall pattern and investigation of the intrinsic trend with the summer monsoon rainfall time series over Assam is urgently required. However, the rainfall trend analysis over different sites of subtropical Assam under the humid climatic conditions is not available in the literature. On the other hand, studies related with pan evaporation (Jhajharia et al., 2009; McVicar et al., 2012), reference evapotranspiration (Jhajharia et al., 2011; McVicar et al., 2012), wind speed (McVicar et al., 2012), temperature (Chattopadhyay et al., 2011; Jhajharia and Singh, 2011; Jhajharia et al., 2007), and diurnal temperature range and sunshine duration (Jhajharia and Singh, 2011) over the subtropical and bio-diversity rich region of the Northeast India are available in the literature. Jhajharia et al. (2009), Jhajharia et al. (2011) and McVicar et al. (2012) report decreasing trends in pan evaporation and reference evapotranspiration over different sites of the Northeast India, respectively. Jhajharia et al. (2011) have reported that the seasonal decreases in ETO have been more significant in the pre-monsoon season, which indicates the presence of an element of a seasonal cycle over Northeast India. Steady decreases in wind speed are witnessed in almost all the time scales over most of the sites as well. Temperature increases were observed mainly in the monsoon and post-monsoon seasons, whereas decreasing trends in sunshine duration were observed mainly on annual, seasonal (winter and pre-monsoon) and monthly (January, February and March) time scales in Northeast region (Jhajharia and Singh, 2011). However, a detailed study of trends in rainfall, rainy days and 24 h maximum rainfall is lacking to a large extent on monthly and seasonal time scales over Assam, Northeast India. Rainfall, mainly in the monsoon season, causes severe damage to human life, crops, and disruption of life and infrastructure in the Northeast region. Mitra (2004) assessed the total damage caused by the floods during 1953 to 1995 in Assam and reported that the floods of 1987, 1988, 1992 and 1995 were quite severe and had devastating effects on the fragile ecosystems in the region. The natural causes may have contributed marginally to the changes in vegetation type. However, it is the activities of man that may have led to the irreversible transformation in landscapes and resulted in the loss of regions’ unique bio-diversity. Thus, there is an urgent need to investigate the rainfall pattern of the region for making the long term strategic plan to minimize and or restore the damaged ecosystem. In the present study, the trends in rainfall, rainy days and 24 h maximum rainfall are investigated on monthly, seasonal and annual time scales through the non-parametric Mann-Kendall test at 5% of significance level at twenty fours sites of Assam from the northeastern region of India for last fifty years. The magnitude of the trend in rainfall is obtained by fitting a linear trend line using the least-squares regression method, and the slope of linear fit provides the rate of increase or decrease in rainfall. The trend determined is again tested in terms of its statistical significance using the t-test (parametric approach) at 5% significance level. The present work has the aroma of newness in the following aspects:
- • trend analysis of Indian summer monsoon rainfall has been executed in several studies (Kothyari and Singh, 1996; Mirza et al., 1998; Parthasarathy, 1984; e.g. Parthasarathy and Dhar, 1978; Rupa et al., 1992; Singh et al., 2008). Some studies are also available on the trend analysis of rainfall time series over South India (e.g. Raj and Azeez, 2010, 2011). However, a detailed study on the trend analysis of the summer monsoon rainfall over Northeast India is not available in the literature till date. Therefore, the present study has attempted to analyze the trends in rainfall in different durations: annual; month: January to December; and seasonal: winter, pre-monsoon, monsoon and post-monsoon over different sites of Assam located in the Northeast India;
- • most of the available studies on rainfall trend analysis are based on parametric approaches. However, the present study has adopted the non-parametric approach (the Mann-Kendall test) while carrying out the trend analysis. The trends are statistically confirmed by the parametric method as well.
2 Material and methods
2.1 Rainfall data of Assam
Assam, one of the seven-sister states of Northeast India, is located in the northeastern region of India (see Fig. 1). There is a rain-shadow effect in the Assam valley lying between the Himalayas to the north and other ranges to the south and east. On the southern slopes of the Khasi-Jaintia hills, annual rainfall is over 10,000 mm, while on the north in the Brahmaputra valley it decreases to less than 2000 mm (Rao, 1981). The northeastern region of India is one of the highest rainfall-receiving regions on the Earth. The region has some of the sub-continent's last remaining rain forests and the region represents a diverse monsoon rainfall regime under wet humid conditions. The monsoon rainfall increases from south to north and also from west to east over subtropical Assam. Pre-monsoon rains are caused mainly by the depressions moving from the west and by local convectional storms. Rainfall is quite low in the winter and post-monsoon seasons (Barthakur, 2004). The monthly data of rainfall and rainy days of twenty-four stations of Assam were obtained from India Meteorological Department (IMD), Pune and Tocklai Tea Research Station, Jorhat. The 24 stations of Assam, which were considered for the present study, are listed in Table 1. Fig. 1 shows the spatial distribution of all the twenty-four stations in the four zones (based on latitude and longitude) of Assam, i.e., lower Assam, middle Assam, upper Assam and southern Assam. The data of 24 h maximum rainfall of various sites were obtained from IMD Pune as well. The monthly datasets of rainfall and rainy days were used to compute the annual and seasonal (winter, pre-monsoon, monsoon and post-monsoon) time series as per the standard practice of IMD. It may be noted that the seasonal and annual time series were derived from the monthly datasets by averaging over the said seasons and years respectively.

Spatial distribution of rain gauge stations over different regions of subtropical Assam, Northeast India. Number IV represents the fourth region between 24°–26° N and 92°–94° E.
Distribution spatiale des stations à jauge pluviale sur différentes régions de l’Assam sub-tropical, en Inde nord-orientale. Le numéro IV représente la quatrième région entre 24 et 26° N et 92 et 94° E.
Détail des stations localisées dans les quatre régions d’Assam, en Inde nord-orientale.
| Sl. No | Station | District | Lat. (N) | Long. (E) | Period |
| Region I (Lat. 26°–28° N and Long. 89°–92° E) | |||||
| 1 | Dhubri | Dhubri | 26° 01′ | 89° 59′ | 1951–2003 |
| 2 | Goalpara | Goalpara | 26° 11′ | 90° 38′ | 1954–2003 |
| 3 | Goibargaon | Nalbari | 26° | 91° | 1976–2003 |
| 4 | Guwahati | Kamrup | 26° 11′ | 91° 45′ | 1951–2003 |
| 5 | Rangia | Kamrup | 26° 27′ | 91° 37′ | 1957–2003 |
| 6 | Mathungari | Barpeta | 26° | 90° | 1977–2003 |
| 7 | Panbari | Bongaigaon | 26° | 90° | 1976–2003 |
| Region II (Lat. 26°–28° N and Long. 92°–94° E) | |||||
| 8 | Dharmatal | Marigaon | 26° | 92° | 1976–2003 |
| 9 | Gohpur | Sonitpur | 26° 53′ | 93° 38′ | 1958–1999 |
| 10 | Golaghat | Golaghat | 26° 31′ | 93° 59′ | 1954–2003 |
| 11 | Majbat | Darrang | 26° 45′ | 92° 21′ | 1954–2001 |
| 12 | Tezpur | Sonitpur | 26° 37′ | 92° 47′ | 1951–2003 |
| 13 | Thakurbari | Sonitpur | 26° 48′ | 92° 42′ | 1973–2000 |
| Region III (Lat. 26°–28° N and Long. 94°–96° E) | |||||
| 14 | Digboi | Tinsukia | 27° 24′ | 95° 37′ | 1954–2003 |
| 15 | Lilabari | Lakhimpur | 27° 14′ | 94° 07′ | 1954–2003 |
| 16 | Margherita | Tinsukia | 27° 18′ | 95° 40′ | 1979–2000 |
| 17 | Neamatighat | Jorhat | 26° | 94° | 1976–2003 |
| 18 | Tocklai | Jorhat | 26° 47′ | 94° 12′ | 1965–2000 |
| 19 | Sibsagar | Sibsagar | 26° 59′ | 94° 38′ | 1951–2003 |
| Region IV (Lat. 24°–-26° N and Long. 92°–94° E) | |||||
| 20 | Halflong | N.Cachar Hills | 25° 10′ | 93° 01′ | 1951–2001 |
| 21 | Kheronighat | Karbi Anglong | 25° | 92° | 1976–2003 |
| 22 | Lumding | Nowgaon | 25° 45′ | 93° 11′ | 1951–2003 |
| 23 | Silchar | Cachar | 24° 49′ | 92° 48′ | 1951–2003 |
| 24 | Silcoorie | Cachar | 24° 50′ | 92° 48′ | 1965–2000 |
2.2 Methods of trend analysis
Trends in the data can be identified by using parametric or non-parametric methods, and both the methods are widely used. The non-parametric methods do not require normality of time series and are less sensitive to outliers and missing values. The non-parametric methods are widely used for analyzing the trends in several hydrologic series, for example, rainfall, temperature, pan evaporation, wind speed, etc. (Chattopadhyay et al., 2011; Dinpashoh et al., 2011; Fu et al., 2004; Hirsch et al., 1982; Jhajharia and Singh, 2011; Jhajharia et al., 2009, 2011; Tebakari et al., 2005; Yu et al., 1993). One of the problems in detecting and interpreting trends in hydrologic data is the confusing effect of serial dependence. Specifically, if there is a positive serial correlation in the time series, then the non-parametric test suggests a significant trend in a time series (Partal and Kahya, 2006). Lack of persistence in Indian rainfall is established in earlier studies like Chattopadhyay (2007) and Rakhecha and Soman (1994). Partal and Kahya (2006) suggested pre-whitening of persistent data before non-parametric test for trend. In the present case, because of lack of persistence, any such pre-whitening is not required. In the present, the non-parametric Mann-Kendall (MK) method (Mann, 1945; Kendall, 1975) is used for identifying the trends in rainfall because it is distribution-free and has a higher power than many other commonly used tests (Hess et al., 2001). The MK test, one of the most commonly used non-parametric method, is based on the test statistic, S, defined as follows:
| (1) |
| (2) |
The mean and variance of the S statistic, under the assumption that the data are independent and identically distributed, are given by the following expressions:
| (3) |
| (4) |
| (5) |
The values of MK test statistic are computed and it may be seen that, if the value lies within the limits (–) 1.96 and (+) 1.96, i.e., , then the null hypothesis of no trend can be accepted at the 5% (α) level of significance using a two-tailed test. Otherwise, the null hypothesis can be rejected and the alternative hypothesis can be accepted at the significant level of α, i.e., 5%. If Z > 1.96, there is increasing trend; and if Z < − 1.96, there is decreasing trend.
In this study, the trend-analyses were also carried out through linear regression test, a commonly used parametric method on annual, monthly and seasonal basis. A linear trend is fitted using the least-squares regression method and the slope of linear fit provides the rate of increase or decrease in rainfall. The linear trend is expressed as y(t) = a × t + b, where t is the time and ‘a’ and ‘b’ are constants. The trend determined, a, is tested in terms of its statistical significance using the t-test, where with σa the expected standard deviation of a. If
3 Results and discussion
The monthly data are used to compute seasonal and annual time series of rainfall and rainy days. The statistical parameters of total rainfall and number of rainy days, i.e., mean (M), standard deviation (S), coefficient of variation (CV), coefficient of skewness (CS) and coefficient of kurtosis (CK) are calculated to describe the characteristics of rainfall over subtropical Assam (Tables 2a–b). The average annual rainfall and the number of rainy days are 2321.5 mm and 110 for the considered period, which categorizes Assam as a high rainfall region. The pre-monsoon and monsoon rainfall contribute about 26% and 70% to the total annual rainfall. The mean rainy days in pre-monsoon and monsoon seasons are 32 and 70 respectively. The CV of annual rainfall (35.74%) and monsoon season (39.33%) is quite low as compared to the CV of the winter, pre-monsoon and post-monsoon seasons. Similarly, the variability in the rainy days is much higher during the winter and post-monsoon seasons compared to the monsoon season.
Paramètres statistiques de pluviosité totale, utilisés pour la caractérisation de la variabilité de la pluviosité sur l’Assam.
| Time scale | M (mm) | S (mm) | C V | C S | C K |
| Annual | 2321.5 | 829.7 | 35.74 | 0.70 | 0.60 |
| Winter | 65.60 | 66.00 | 100.61 | 1.80 | 3.50 |
| Pre-monsoon | 598.20 | 296.4 | 49.55 | 1.50 | 4.70 |
| Monsoon | 1606.5 | 631.8 | 39.33 | 1.20 | 3.00 |
| Post-monsoon | 51.14 | 62.10 | 121.43 | 3.50 | 16.80 |
| January | 28.36 | 41.71 | 147.07 | 3.49 | 17.05 |
| February | 37.24 | 42.26 | 113.48 | 2.38 | 8.20 |
| March | 92.77 | 117.00 | 126.12 | 3.74 | 18.23 |
| April | 178.13 | 115.14 | 64.64 | 1.82 | 7.22 |
| May | 327.33 | 183.44 | 56.04 | 0.80 | 0.51 |
| June | 429.19 | 261.42 | 60.91 | 1.53 | 5.51 |
| July | 422.89 | 231.42 | 54.72 | 1.38 | 3.37 |
| August | 338.73 | 177.79 | 52.49 | 1.32 | 3.78 |
| September | 271.82 | 172.39 | 63.42 | 2.15 | 11.15 |
| October | 143.87 | 108.49 | 75.41 | 1.46 | 3.35 |
| November | 36.01 | 56.26 | 156.23 | 4.06 | 21.47 |
| December | 15.13 | 18.41 | 121.68 | 1.60 | 3.08 |
Paramètres statistiques du nombre de jours de pluie sur l’Assam.
| Time scale | M | S | C V | C S | C K |
| Annual | 110 | 21.62 | 19.65 | 0.02 | –0.25 |
| Winter | 5 | 3.52 | 70.40 | 0.98 | 0.90 |
| Pre-monsoon | 32 | 8.39 | 26.22 | 0.06 | 0.45 |
| Monsoon | 70 | 14.45 | 20.64 | –0.11 | 0.11 |
| Post-monsoon | 3 | 2.28 | 76.00 | 0.74 | 0.17 |
| January | 2 | 1.71 | 85.50 | 1.04 | 0.69 |
| February | 3 | 2.54 | 84.67 | 1.08 | 1.05 |
| March | 6 | 3.87 | 64.50 | 1.00 | 0.96 |
| April | 11 | 4.36 | 39.64 | 0.38 | 0.10 |
| May | 15 | 4.91 | 32.73 | –0.04 | 0.10 |
| June | 17 | 5.09 | 29.94 | –0.36 | 0.03 |
| July | 18 | 5.26 | 29.22 | –0.34 | –0.08 |
| August | 15 | 4.81 | 32.07 | 0.13 | –0.12 |
| September | 13 | 4.10 | 31.54 | 0.10 | –0.32 |
| October | 7 | 3.52 | 50.29 | 0.52 | –0.04 |
| November | 2 | 1.63 | 81.50 | 0.98 | 0.71 |
| December | 1 | 1.40 | 140.00 | 1.23 | 1.20 |
The monsoon rainfall anomaly is also examined using the averaged monsoon data of whole Assam (Fig. 2). The excess rainfall is observed when the percentage monsoon rainfall departure is greater than 19% from its normal (Mooley et al., 1982). During the considered period, Assam experienced five excess (1974, 1983, 1987, 1988 and 1993) and seven deficient (1961, 1967, 1975, 1976, 1994, 2001 and 2002) monsoon. Mooley and Parthasarathy (1982) identified 1972, 1966, 1965 and 1951 among the worst monsoon failure years for India. Likewise, Mooley et al. (1982) observed 1961 and 1975 as the second and the sixth worst flood years for all India. Contrary to the All India observations, Assam received deficient monsoon rainfall in 1961 and 1975 and excess monsoon rainfall in 1966.

Anomaly in monsoon rainfall (% of mean) of Assam during the last half century.
Anomalie pour la pluviosité de mousson (% en moyenne) de l’Assam pendant le dernier demi-siècle.
3.1 Trends in rainfall
The Z statistic obtained through the MK test for the total rainfall in the annual and seasonal time scales are shown in Table 3 for the different sites of Assam. It can be inferred from Table 3 that both upward and downward trends were experienced for total rainfall at twenty different sites located in Assam. On annual time scale, the number of sites witnessing increasing rainfall is more or less equal to those witnessing decreasing rainfall. But, only three sites, namely, Haflong, Neamatighat and Goibargaon stations witnessed statistically significant trend obtained through the MK test at 5% level of significance. Out of these three stations, Neamatighat and Haflong (Goibargaon) observed significant decreasing (increasing) trends. The annual rainfall time series for two sites, which witnessed both increasing and decreasing trends (Goibargaon and Neamatighat) are given in Figs. 3 and 4, respectively. Similarly, the number of sites witnessing increasing rainfall is more or less equal to those witnessing decreasing rainfall in three different seasons, i.e., pre-monsoon, monsoon and post-monsoon under the humid climatic conditions of Assam. However, seven stations (one station, i.e., Neamatighat) witnessed statistically significant increasing (decreasing) trends in total rainfall in the following seasons: winter at four sites; monsoon at one site; and post-monsoon at two stations (pre-monsoon, monsoon and post-monsoon) located in the northeastern region of India. The sample time series of total rainfall in winter and post-monsoon seasons at different stations of Assam are shown in Figs. 5, 6 and 7, respectively. The dashed and solid lines represent the linear trend in seasonal rainfall, and the equation gives the magnitude of rates of changes (shown by the values of slope) in total seasonal rainfall at these sites. Jhajharia et al. (2007) reported decreasing trends in annual rainfall at the rate of 2.4 mm/year at Agartala (Tripura). The trends in annual rainfall at Agartala were in agreement with the decreasing trends observed in the cloud amount over Agartala. The results of trends in total rainfall witnessed in this study over twenty-four stations of Assam are in accordance with the findings of Jhajharia et al. (2009, 2011). Jhajharia et al. (2011) have reported no significant trends in rainfall in annual duration and all the four different seasons at Margherita, Thakurbari, Tocklai and Silcoorie. Similarly, Jhajharia et al. (2009) have reported no statistically significant trends in yearly rainfall at Chuapara (Nagrakata) and mixed trends in seasonal rainfall at Agartala of Northeast India.
Valeurs Z obtenues par utilisation du test Mann-Kendall pour la pluviosité totale à l’échelle annuelle et saisonnière sur l’Assam, Inde nord-orientale.
| S. No | Name of site | Annual | Winter | Pre-monsoon | Monsoon | Post-Monsoon |
| 1 | Dharamtalla | 0.36 | 0.39 | –0.55 | 0.47 | –0.67 |
| 2 | Dhubri | 0.83 | 2.85 | 1.24 | 0.30 | 2.35 |
| 3 | Digboi | –0.49 | –0.37 | 0.26 | –0.99 | 0.36 |
| 4 | Goalpara | 1.38 | 2.40 | –1.30 | 1.65 | 2.57 |
| 5 | Gohpur | –0.22 | 1.77 | –0.62 | –0.66 | 1.56 |
| 6 | Goibargaon | 2.05 | 0.00 | 1.07 | 2.09 | –0.10 |
| 7 | Golaghat | –1.00 | 0.26 | –0.82 | –0.19 | 0.13 |
| 8 | Guwahati | 0.78 | 1.80 | 0.97 | –0.18 | 0.69 |
| 9 | Haflong | –2.65 | –0.63 | 1.41 | 1.60 | –0.33 |
| 10 | Kheronighat | 1.20 | 2.10 | 1.02 | 0.26 | 1.05 |
| 11 | Lilabari | –0.54 | 0.60 | –1.55 | 0.20 | –0.90 |
| 12 | Lumding | 0.06 | 2.09 | 1.24 | –0.95 | 1.26 |
| 13 | Majbat | –1.19 | 0.48 | –0.97 | –0.52 | 0.00 |
| 14 | Mathungari | –1.82 | –0.92 | –1.76 | –1.62 | –1.80 |
| 15 | Neamatighat | –3.12 | 0.83 | –2.25 | –2.96 | –2.17 |
| 16 | Panbari | 1.72 | 0.29 | 1.19 | 1.40 | –0.55 |
| 17 | Rangia | –0.32 | 0.20 | –0.19 | –0.69 | –0.90 |
| 18 | Sibsagar | 0.18 | 1.63 | –0.35 | 0.10 | –0.06 |
| 19 | Silchar | 0.18 | 1.93 | 0.03 | –0.57 | 1.58 |
| 20 | Tezpur | 1.12 | 1.35 | –0.05 | 1.40 | –0.30 |
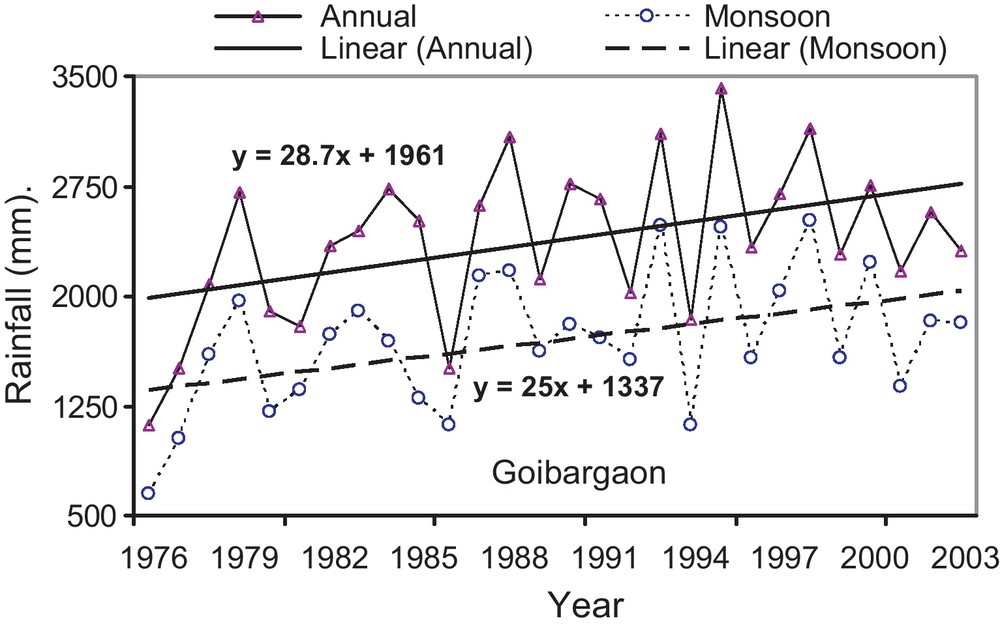
Annual and monsoon rainfall series over Goibargaon. The solid and broken curves represent the rainfall time series in annual and monsoon season, respectively. The solid and dashed lines represent the trends in annual and monsoon rainfall, respectively.
Séries de pluviosité annuelle et de mousson sur Goibargaon. Les courbes continues et discontinues représentent les séries temporelles de pluviosité par saison de mousson et par année, respectivement. Les lignes continues et en tiretés représentent les tendances pour les pluviosités annuelles et de mousson, respectivement.
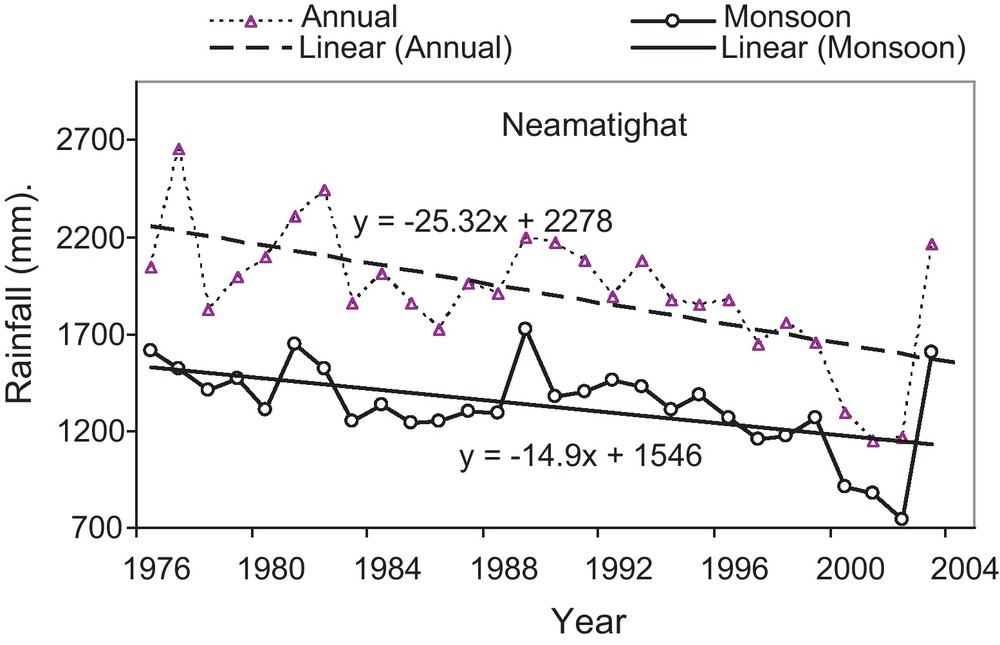
Annual and monsoon series of rainfall over Neamatighat. The broken and solid curves represent the rainfall time series in annual and monsoon season, respectively. The dashed and solid lines represent the trends in annual and monsoon rainfall, respectively.
Séries de pluviosités annuelles et de mousson sur Neamatighat. Les courbes continues et discontinues représentent les séries temporelles de pluviosité par saison de mousson et par année, respectivement. Les lignes continues et en tiretés représentent les tendances par saison de mousson et par année, respectivement.
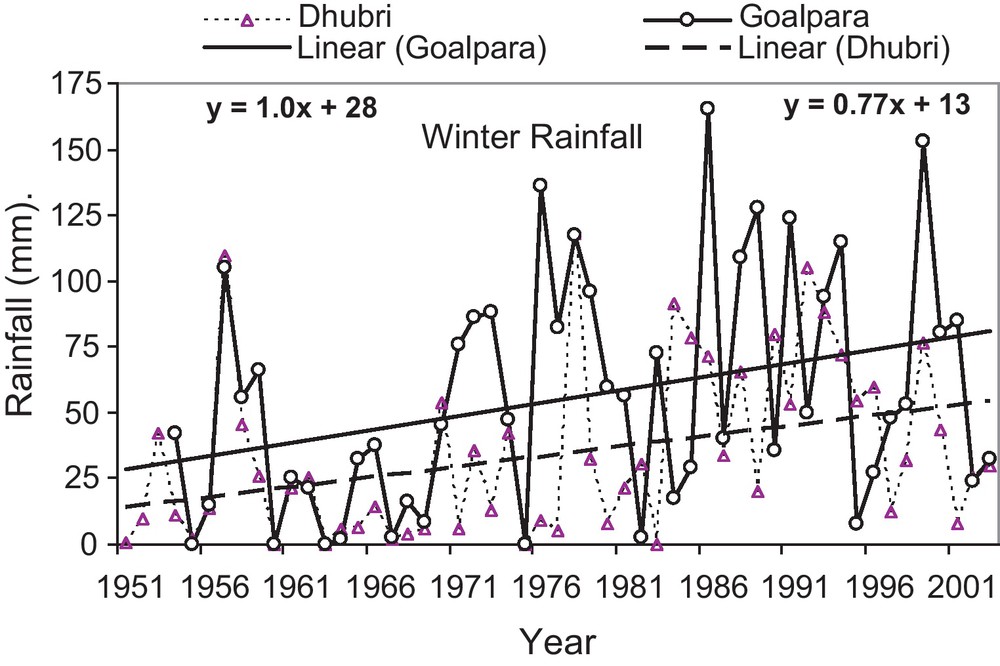
Rainfall series of two stations in winter season. The curves and the lines represent the actual rainfall time series and the linear trends in winter rainfall, respectively.
Séries de pluviosité pour deux stations pendant l’hiver. Les courbes et les lignes représentent les séries temporelles de pluviosité actuelles et les tendances linéaires de la pluviosité d’hiver, respectivement.
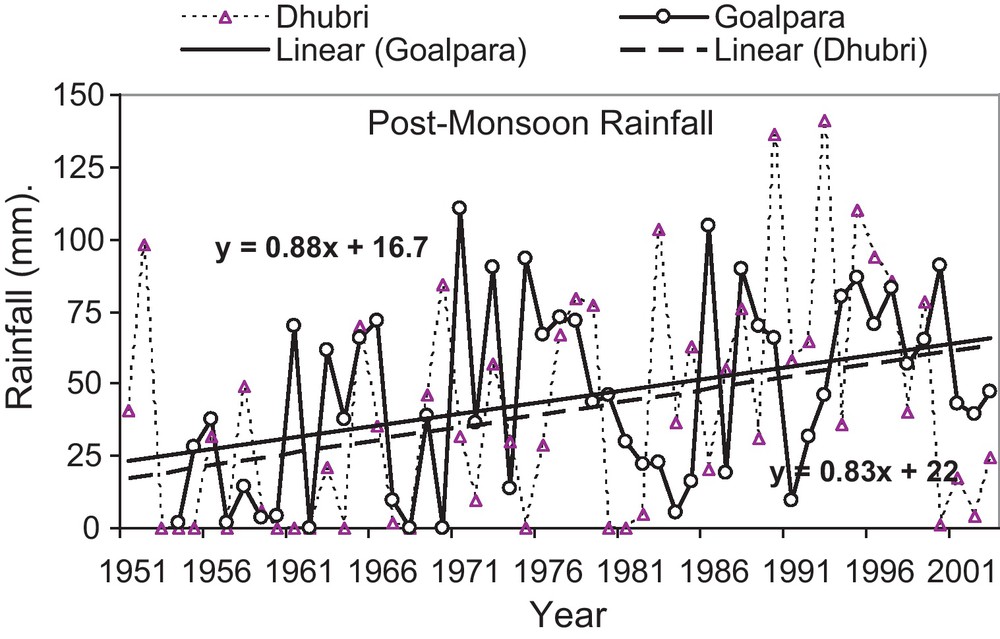
Post-monsoon rainfall series of two stations. The curves and the lines represent the actual rainfall time series and the linear trends in post-monsoon rainfall, respectively.
Séries de pluviosité post-mousson de deux stations. Les courbes et les lignes représentent les séries temporelles de pluviosité actuelles et les tendances linéaires de la pluviosité en période de post-mousson, respectivement.

Trends in rainfall in winter and post-monsoon seasons over two sites of subtropical Assam. Post M, GHY and MATHUNG denote post-monsoon, Guwahati and Mathungari, respectively.
Tendances de la pluviosité en saison hivernale et de post-mousson sur deux sites de l’Assam sub-tropical. Post M, Ghy et MATHUNG correspondent à la période post-mousson, à Guwahati et à Mathungari, respectivement.
On monthly time scales, sixteen and seventeen sites (seventeen sites) witnessed decreasing (increasing) trends in the total rainfall, out of which one and three trends (none) were found to be statistically significant in June and July, respectively (September). In the month of December (February), eighteen (twenty-two) sites witnessed decreasing (increasing) trends in total rainfall, out of which five (three) trends were statistically significant (for details see Table 4). The sample time series of total rainfall in different months at different stations of Assam are shown in Figs. 8 and 9. Therefore, the results of analysis of trends in monthly rainfall over different stations of Assam reveal similar kind of trend results as that of the seasonal rainfall, i.e., the majority of the stations observed statistically non-significant trends. The occurrences of reasonably stable trends witnessed in total rainfall over different sites in Assam are positive sign in view of the growing of crops, like, paddy, tea (Camellia sinensis L.) and forest products like bamboo that play a very important role in the economy of Assam. However, the observed increasing trends in temperature in monsoon and post-monsoon seasons, as reported by Jhajharia and Singh (2011), and Jhajharia et al. (2009, 2011), over different tea growing sites in Assam and other areas of Northeast India would affect the production of tea and other crops.
Nombre de stations observant des tendances significatives à la diminution et à l’augmentation de la pluviosité totale et des jours de pluie à l’échelle mensuelle, et utilisant le test Mann-Kendall.
| Month | Decreasing trends | Increasing trends | No trends | |||
| Rainfall | No. of rainy days | Rainfall | No. of rainy days | Rainfall | No. of rainy days | |
| January | 0 | 12 | 0 | 0 | 24 | 12 |
| February | 0 | 1 | 3 | 0 | 21 | 23 |
| March | 0 | 0 | 1 | 0 | 23 | 24 |
| April | 1 | 2 | 0 | 0 | 23 | 22 |
| May | 2 | 5 | 1 | 0 | 21 | 19 |
| June | 1 | 7 | 1 | 0 | 22 | 17 |
| July | 3 | 7 | 0 | 0 | 21 | 17 |
| August | 0 | 3 | 1 | 0 | 23 | 21 |
| September | 0 | 3 | 1 | 0 | 23 | 21 |
| October | 0 | 5 | 0 | 0 | 24 | 19 |
| November | 0 | 9 | 1 | 0 | 23 | 15 |
| December | 5 | 18 | 0 | 0 | 19 | 6 |
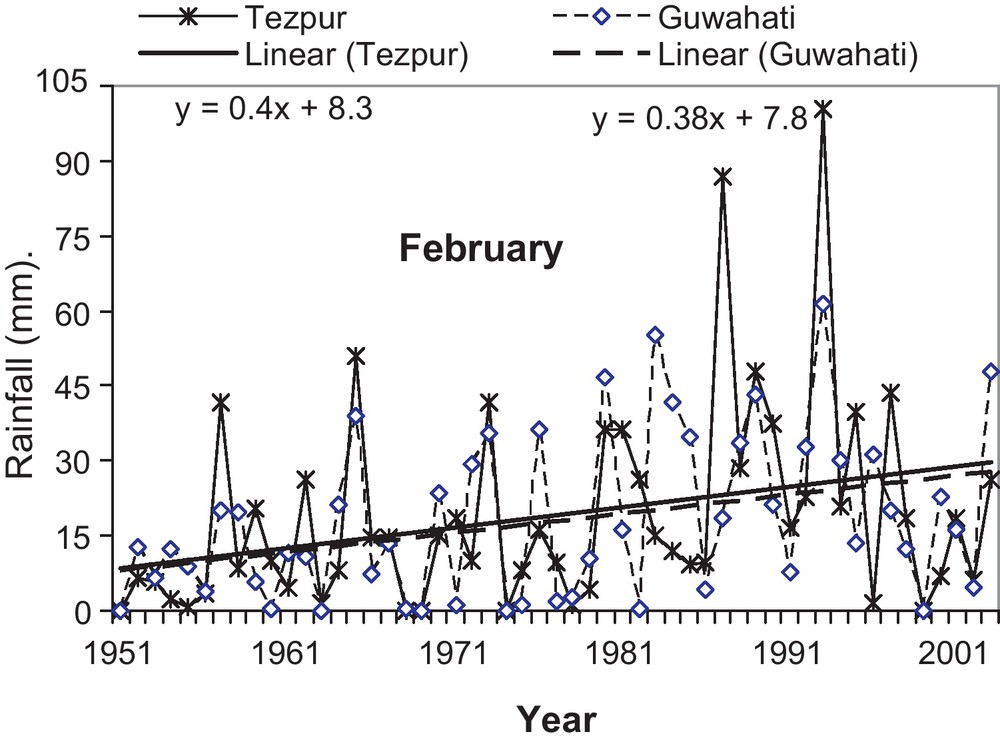
Rainfall series of Tezpur and Guwahati in the month of February.
Séries de pluviosité de Tezpur et Guwahati au mois de février.

Rainfall series of Goibargaon in the months of June and August.
Séries de pluviosité de Goibargaon aux mois de juin et d’août.
3.2 Trends in rainy days and 24 h maximum rainfall
As per the guidelines of IMD, a rainy day is defined as that day which receives rainfall amount of more than 2.4 mm. The Z statistic obtained through the MK test for the rainy days in the annual and seasonal time scales for twenty different sites of Assam are shown in Table 5. It can be inferred from Table 5 that both upward and downward trends were experienced in rainy days at different stations of Assam. On annual time scale, only two stations (Majbat and Mathungari) witnessed statistically significant decreasing trends in the rainy days at 5% level of significance. Similarly on seasonal time scale, eight and six stations witnessed statistically significant decreasing trends obtained through the MK test at 5% level of significance in the number of rainy days in monsoon and post-monsoon seasons, respectively. The results of analysis of trends in rainy days in winter and pre-monsoon seasons reveal that the majority of the stations observed statistically non-significant trends obtained through the MK test at 5% level of significance in the rainy days.
Valeurs Z obtenues grâce au test Mann-Kendall pour les jours de pluie et les chutes de pluie maximum en 24 h sur l’Assam, Inde nord-orientale.
| S. No. | Name of site | Rainy Days | 24 hours Max. rainfall | ||||
| Annual | Winter | Pre-monsoon | Monsoon | Post-monsoon | |||
| 1 | Dharamtalla | 0.04 | –0.29 | –0.92 | 0.72 | –1.58 | 0.50 |
| 2 | Dhubri | 0.15 | 1.04 | 0.10 | –0.63 | 0.35 | –1.32 |
| 3 | Digboi | –1.09 | –1.20 | –0.34 | –2.15 | –1.68 | –0.74 |
| 4 | Goalpara | 0.03 | 0.16 | –0.93 | –0.96 | –0.19 | –1.62 |
| 5 | Gohpur | 0.34 | –0.12 | –0.62 | –0.43 | 0.29 | 0.55 |
| 6 | Goibargaon | 0.83 | –1.03 | 0.75 | 0.32 | –1.97 | 1.19 |
| 7 | Golaghat | –1.61 | –1.23 | –1.30 | –1.40 | –2.00 | –1.23 |
| 8 | Guwahati | –0.42 | 0.06 | –0.75 | –1.67 | –1.67 | 0.17 |
| 9 | Haflong | –1.80 | 0.77 | –1.92 | –2.28 | –0.38 | –2.03 |
| 10 | Kheronighat | 0.02 | 1.43 | –0.04 | –0.68 | –1.09 | 0.55 |
| 11 | Lilabari | –0.06 | –0.96 | 0.13 | 0.54 | –2.12 | 0.11 |
| 12 | Lumding | –0.58 | 0.72 | 0.39 | –2.39 | –0.75 | –1.75 |
| 13 | Majbat | –2.80 | –1.16 | –1.52 | –2.82 | –1.69 | –0.49 |
| 14 | Mathungari | –2.17 | –2.53 | -0.52 | –2.22 | –2.25 | –0.75 |
| 15 | Neamatighat | –1.15 | 0.43 | –0.55 | –2.02 | –2.53 | –1.07 |
| 16 | Panbari | 0.40 | –0.66 | 0.24 | –0.24 | –1.45 | 0.03 |
| 17 | Rangia | –0.61 | –1.53 | 0.19 | –0.96 | –1.02 | –2.09 |
| 18 | Sibsagar | –1.37 | 0.11 | –0.20 | –2.75 | –1.44 | –1.07 |
| 19 | Silchar | –1.12 | 0.28 | –0.75 | –2.07 | 0.69 | –1.57 |
| 20 | Tezpur | –0.14 | –0.34 | –0.55 | –0.43 | –2.65 | 0.85 |
A list of station numbers observing different types of trends obtained by using the Mann-Kendall test in the number of rainy days on monthly time scales is given in Table 4. On monthly time scales, twenty-one sites each witnessed decreasing trends in the rainy days in June and July, out of which seven trends each were found to be statistically significant. Twenty-two or more sites witnessed decreasing trends for the rainy days during the months of November to January in Assam, but for nine (November), twelve (January) and eighteen (December) sites, these trends were statistically significant. Table 4 shows that the majority of statistically significant (decreasing) trends at 5% level of significance occurred in the months of December and January. The significant decreases in the number of rainy days over different sites of Assam for the months of January, June, July and December are given in Table 6. The most significant decreases in the rainy days occurred in the month of December in the range of 0.5 to 5, with a maximum decrease of 5 days over Margherita. The sample time series of the number of rainy days on seasonal, monthly and annual time scales for different stations of Assam, which witnessed significant trends at 5% level of significance, are shown in Fig. 10.
Diminutions significatives dans le nombre de jours de pluies, obtenues au moyen du test de régression linéaire, sur les stations d’Assam sub-tropical en Inde nord-orientale.
| Station | January | June | July | November | December |
| Goibargaon | –0.5 | n.s | n.s | –1 | –1 |
| Guwahati | –0.5 | –2 | n.s | –0.5 | –0.5 |
| Kheronighat | n.s | n.s | –2 | 0 | –0.5 |
| Lilabari | –0.5 | 0 | n.s | –1 | –1 |
| Margherita | –1 | –1 | –4 | n.s | –5 |
| Mathungari | –1 | n.s | n.s | n.s | –2 |
| Naematighat | n.s | –2 | –4 | –1 | –3 |
| Panbari | –0.5 | n.s | n.s | n.s | –1 |
| Silcoorie | –1 | –3 | –1 | –2 | –0.5 |
| Tezpur | –0.5 | –2 | –2 | –1 | –1 |
| Thakurbari | n.s | n.s | 0 | n.s | –1 |
| Tocklai | –1 | –1 | 0 | –3 | –1 |
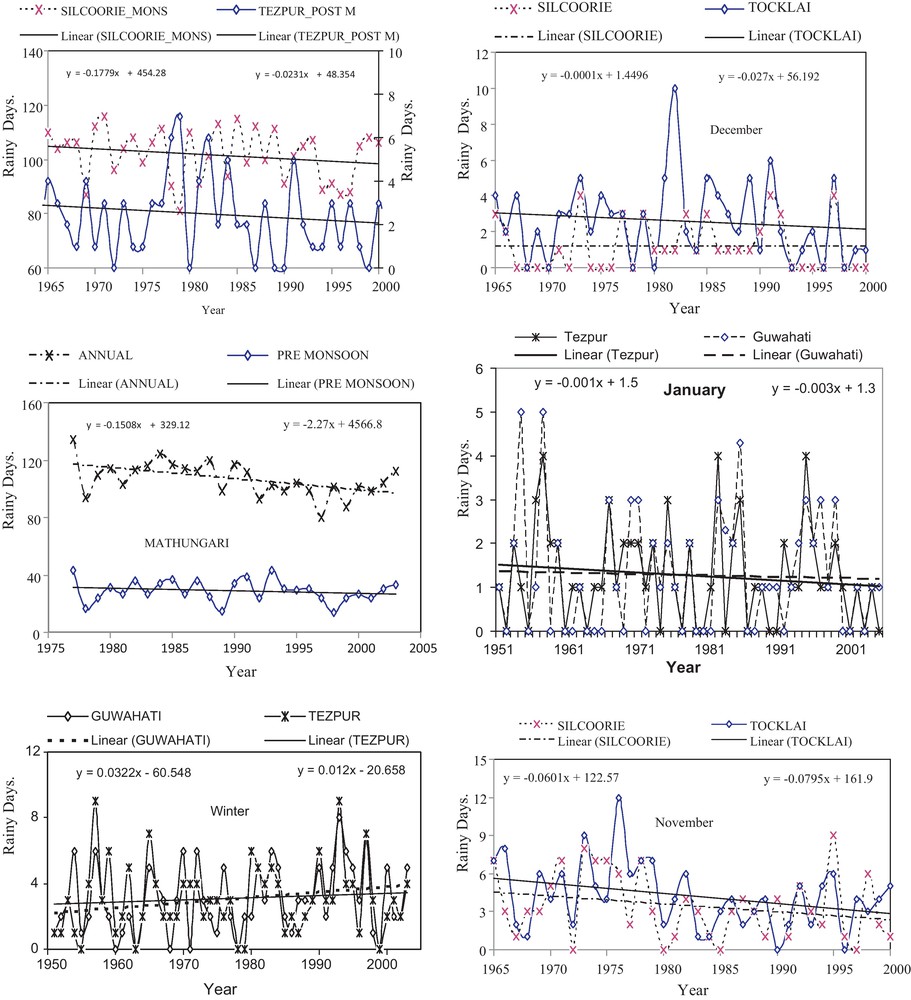
Tends in the number of rainy days in different durations at various sites over subtropical Assam in Northeast India. MONS and POST M denote monsoon and post-monsoon, respectively.
Tendances à propos du nombre de jours de pluie pour différentes durées sur des sites variés de l’Assam sub-tropical, en Inde nord-orientale. MONS et POST M désignent les périodes de mousson et de post-mousson, respectivement.
The 24 h maximum rainfall is defined as the highest amount of total rainfall (in millimeter) occurring in a day in particular year over a particular station. The data of 24 h maximum rainfall for twenty sites were obtained from IMD, Pune. The values of Z statistic obtained through the MK test for the 24 h maximum rainfall are shown in Table 5 for twenty sites of Assam. It can be inferred from Table 5 that both upward and downward trends are experienced in the 24 h maximum rainfall in Assam. Only two stations witnessed statistically significant trends obtained by using the Mann-Kendall test in the 24 h maximum rainfall over Assam. The decreasing trends in the 24 h maximum rainfall events at 5% level of significance were observed at Rangia and Haflong. The 24 h maximum rainfall has decreased to 43 mm at Rangia and 68 mm at Halflong for the total period of records available at these two sites of subtropical Assam.
4 Summary and discussion
The rainfall dataset of twenty-four stations from Assam are used to investigate annual, monthly, and seasonal (winter, pre-monsoon, monsoon and post-monsoon) trends in rainfall, rainy days and 24 h maximum rainfall. Trends in total rainfall and rainy days are identified using the Mann-Kendall non-parametric method, which are also confirmed by the parametric approach. On monthly time scale, at least sixteen sites of Assam witnessed decreasing trends in total rainfall in June, July and December, out of which a few trends were found to be statistically significant at 5% significance level. On the other hand, seventeen and twenty-two sites witnessed increasing trends in total rainfall in September and February, but only three trends were found to be statistically significant in February. Similarly on annual and seasonal time scales, both increases and decreases in rainfall were witnessed, however most time series were statistically non-significant at 5% significance level. Kumar et al. (2010) reported increasing trends in annual rainfall over half of the sub-divisions out of total 30 sub-divisions in India using the data of 135 years (1871–2005), but the trends were statistically significant for only three sub-divisions (Haryana, Punjab and Coastal Karnataka). On the other hand, only one sub-division (Chhattisgarh) indicated a significant decreasing trend out of 15 sub-divisions showing decreasing trend in annual rainfall over India.
In case of 24 h maximum rainfall, all but two sites witnessed no trend over Assam. Rangia and Haflong witnessed significant decreasing trends in 24 h maximum rainfall. At least twenty-one sites witnessed decreasing trends in rainy days during the months of June, July and November to January, but the trends were found to be statistically significant for seven or more sites in Assam in these months. On seasonal time scales, the majority of sites in Assam witnessed decreasing trends in rainy days, but the trends were statistically significant at about half of the sites in Assam mainly in the monsoon and post-monsoon seasons. Since the observed changes in rainfall and rainy days in Assam are not encouraging as the trends witnessed for most of the sites are statistically non-significant, therefore, the data of stations from the other states of the Northeast India may be used to identify the trends in rainfall to strengthen the findings of the present study.
Global warming arising from anthropogenic-driven emissions of greenhouse gases is an important issue that needs attention in view of the recent climatic changes. Most of the observed increases in temperature since the mid-20th century are very likely due to the observed increase in greenhouse gas concentrations (IPCC, 2007). Jhajharia and Singh, 2011; Jhajharia et al., 2007, 2009, 2011; MoEF, 2004, reported increasing trends in temperature over different sites of Northeast India. The CO2 emissions over Assam have increased from 590 thousand metric tons of Carbon in 1980 to 1470 in 1990 (Ghoshal and Bhattacharyya, 2008). This increase in CO2 emissions may be due to the increased use of fossil fuels, land use changes i.e. urbanization, deforestation, shifting cultivation, etc. The substantial decline in forest cover from 25,160 km2 in 1987 to 23,688 km2 in 1999 over Assam (FSI, 2001) is also a matter of concern due to its potential ability of carbon sequestering. Concurrently, the increase in the human population of Assam, rose from 8.029 million in 1951 to 26.659 million in 2001 has put tremendous pressure on land resources resulting in deforestation of the large areas in this region (Ramakrishnan, 1994, 2001). The area under shifting cultivation has increased from 4160 km2 to 7276 km2 over Assam from 1975 to 1984 (FSI, 1989). Therefore, the warming may be very likely response of the main anthropogenic drivers like population growth, deforestation, industrialization and changes in land use by altering the atmospheric concentrations of greenhouse gases in Assam. Also, the potential impact of the rising temperature may be linked with the rainfall pattern observed over Assam in the present study. Trenberth (1998) found that an increase in temperature leads to increase in moisture holding capacity of the air. This increased moisture content may favor more intense rainfall and decrease in rainy days keeping rainfall stable during the considered time span. Suppiah and Hennessy (1998) reported that inter-annual fluctuations in heavy rainfall, total rainfall and dry days were strongly related to changes in maximum temperature and cloud cover in Australia. The role of deforestation in the climate change is a highly contentious issue and it needs adequate attention. The species-rich subtropical rain forests of Northeast India recognized as one of the 25 global biodiversity hotspots are highly susceptible to man-made disturbances and human influences have pushed many species to the brink of extinction, which is a cause of great concern. The observed changes in rainfall along with the well-reported climatic warming in monsoon and post-monsoon seasons in Northeast India may have implications for human health and water resources management. A detailed study of climatic parameters, i.e. temperature, radiation, evaporation, humidity, etc. along with the observed rainfall patterns will help in combating the adverse impacts on rainfed agriculture and forest dependent communities due to climate change induced changes over subtropical Assam.
Acknowledgements
The authors also acknowledge the India Meteorological Department (Pune) and Tocklai Tea Research Station (Jorhat) for providing the data used in the present study. The authors thank the editor and two anonymous reviewers for their insightful comments.