

Liquid and plastic limits
IP and ILPlastic and liquid indices
e and wVoid ratio and water content
e poroVoid ratio value deduced from the MIP results
w natNatural water content
eL and ePVoid ratios corresponding to wL and wP
γ’Submerged unit weight medium-sized
γ s /γ wDensity of solid grains
c uUndrained cohesion
c uf , c uSUndrained cohesion measured by Fall cone and laboratory vane respectively
h0 and d0Height and diameter of the sample
σ’vVertical effective stress
σ’v0Overburden effective stress
Cc and CsCompression and swelling indices
MBVMethylene blue value
SEMScanning electron microscope
MIPMercury intrusion porosimetry
GoGGulf of Guinea
C.E.Ccation exchange capacity
Dcoefficient of cation desorption capacity
B.E.TS. Brunauer, P. Emmett, and E. Teller theory
EDSEnergy dispersive X-ray analysis
1 Introduction
Recent studies based on experimentation tests for mechanical investigations have shown that marine sediments exhibit evident cementation properties (Burland, 1990; Clayton et al., 1992; Hattab and Favre, 2010; Leroueil and Vaughan, 1990; Lunne et al., 2006; Prasad et al., 2007; Yin et al., 2010) which link particles and aggregates. Characteristics of this cementation, developed throughout the sedimentation and consolidation process in the seabed, can be strongly related to the presence of clay minerals and microfossils, microstructural arrangement of constituent particles, and environmental conditions under sedimentation (Rajasekaran, 2006; Rajasekaran et al., 1999; Tanaka et al., 2003).
From the purely mechanical point of view, the influence of the material structure, including fabric and bonding (Mitchell, 1976), can be approximated by comparing the difference between the mechanical responses of the natural structured sediment and the remoulded one under equal loading. The term “remoulded” is used to describe the sediment in which the structure and the bonding between particles have been on purpose destroyed in the laboratory. Thus the behaviour will only depend on the applied stress tensor. The intact sediment behaviour, during mechanical loading, has been described by Leroueil et al. (1979) as the destructuration phenomenon. Along the oedometric path, for instance, the cementation and structure is gradually destroyed, and the experimental curves tend to converge at high stresses towards the remoulded behaviour (Biarez and Favre, 1975, 1977) represented by the intrinsic compression line (Burland, 1990).
Many studies have been performed to understand the compressibility changes of clays as induced by pore fluid chemistry, such as Bolt (1956) and others (Chen et al., 2000; Di Maio, 1996; Olsen and Mesri, 1970; Ouhadi et al., 2006; Sridharan and Rao, 1973). From these studies, we can know that the physicochemical effects are more significant for sodium smectite clay. This is also confirmed by Yeliz et al. (2008) for marine sediments. They reported that seawater begins significantly affecting soil compressibility when soil liquid limit is greater than 110%. These seawater effects are most noticed for Na-bentonites compared to kaolinitic, chloritic and mixed mineral clays. Some studies are also interested in leaching effects on marine sediment compressibility. Al-Amoudi and Abduljauwad (1995) carried out conventional consolidation tests on undisturbed “sabkha” marine sediment specimens with and without distilled water percolation. The authors concluded that dissolution of sodium chlorides and leaching of calcium ions can result in a higher collapse potential of the tested sediment. Little attempt has been made to investigate the influence of the presence of sodium smectite gel on marine sediment compressibility.Extensive experimental studies were carried out to determine the geotechnical and mechanical properties of Guinea marine clay (De Gennaro et al., 2005; Hattab and Favre, 2010; Puech et al., 2005; Thomas et al., 2005) which show the influence of cementation in this material. Starting from these previous studies, especially those of Hattab and Favre (2010), this article aims at investigating the predominant cause of bonding highlighted in the behaviour of the Guinea Marine sediments. We will focus especially on the analysis of the bond which is located between “clusters” structuring the material. Yin et al. (2010) demonstrated that this bond plays a significant role in the damage process provoked by the mechanical loading. The approach proposed in this study is to firstly show, through mechanical loading and mercury porosimetry tests, the existence of interaggregate cementation. This analysis consists in comparing the properties of intact sediment with the remoulded one on the oedometric path (the damage process, which is largely discussed in Hattab and Favre (2010) and Yin et al. (2010), is not presented in this article). Then, physicochemical analysis leads to prove the presence of sodium smectite gel (which constitutes a type of glue) in the studied sediments. Finally, a conceptual microstructural model is proposed to describe the representative microstructure of the sediment taking into account their cementations.
2 Material and methods
2.1 The GoG sediment
The available samples come from a 17 m long core, taken at a depth of 700 m in the Gulf of Guinea from an oil-producing area. The material appears as a saturated, very plastic dark grey clay, with many shell fragments visible to the naked eye. The core was provided, cut into 1 m sections, numbered by depth and stacked vertically in a freezer. X-ray diffraction analysis according to Thomas et al. (2005) show the clay fraction amounts to 40 to 60%, with approximately 50% of kaolinite, and reaching from 15 to 25% of smectite. On the other hand, the organic substance content is 6% and the carbonate content is between 5 and 15%.
2.2 Experimental methods and apparatus
Different experimental methods have been used for geotechnical identification, mechanical analysis, and physicochemical investigations:
- • Liquid limit was determined from the fall cone method (Controlab–using NF P 94-052-1) which appears as more reliable than the Casagrande method (Koumoto and Houlsby, 2001). The plastic limit was determined by the usual method of soil-roller. The methylene blue analysis (using NF P 94-068 procedure) was also used for the measurement of MBV values;
- • The undrained cohesion was measured by two methods: the fall cone (using NF P94-113 procedure), and the laboratory vane test (using NF P 94-072 procedure);
- • Oedometric tests were performed on intact and remoulded GoG sediment, taken from at 10.8 m and 11.8 m depths using the following procedure.
The intact specimens were directly cut at those depths in subsections previously extracted from the core, and set up in the oedometer cell. For the remoulded specimens, a sample was first extracted from the subsection. It was gradually and gently mixed with distilled and desaired water in order to obtain a slurry with a water content w = 1.5 wL. The slurry was then poured into a rigid cylindrical mould (diameter = 40 mm) and consolidated under a vertical stress equal to 80 kPa. Finally, the sample was cut into cylindrical specimens and set up in the oedometer cell. The loadings are performed by stages up to 1200 kPa of the vertical effective stress, that is, 25 times more than the overburden effective stresses.
Samples for both intact and remoulded sediment were h0 = 24 mm of height and d0 = 70 mm of diameter.
Mercury intrusion porosimetry analysis (using a Micromeritics AutoPore IV 9500) can provide us the local porosity of the sample as well as an image of the pore size distribution. The principle is based on the Laplace-Young law (1) which connects the capillary pressure Pc to the capillary radius r.
| (1) |
Mercury intrusion porosimetry (MIP) tests require that the pore volume is accessible to the injected mercury. It is, therefore, necessary before the injection to remove the pore water from the samples without disturbing the microstructure. For this purpose, the method used consisted in freeze-drying small samples, taken from the tested specimens at the end of the mechanical tests after unloading. These small samples of about 1 cm3 in volume were extracted from the tested specimens by a simple cutting. The samples, initially saturated, were then introduced in liquid nitrogen (Delage and Lefebvre, 1984); a sublimation of ice was then carried out inside a freeze-dryer of compact flexi-dry type.
2.2.1 SEM observation
The samples were prepared by cutting intact sample into small cubes (0.5 × 0.5 × 0.5 cm). These small samples were immediately freezing-dried. Undisturbed fragments produced by breaking carefully the dried samples were directly analyzed for their microstructure by using a scanning electron microscope (SEM). Furthermore, elemental compositions of the samples corresponding to the SEM imaging were also identified by using energy dispersive X-ray analysis (EDS) analysis.
2.2.2 Surface area analysis (BET) and Cation exchange capacity analysis
Specific surface areas (SSA) of marine sediments were determined using nitrogen adsorption based on B.E.T method. Total Cation exchange capacity (CECtot) and cation exchange capacity for each exchangeable cation (Na+, Ca2+, K+) of these sediments were determined using Metson method according to the NF X 31-108 standard.
2.2.3 Thermal analysis
The samples were prepared by packing about 50 mg of the marine sediments in a platinum crucible. The prepared samples were immediately placed in the thermal balance. After 10 min of the balance stabilization, these samples were gradually heated from 20 °C to 1100 °C with a linear speed of heating (10 °C/min). According to the mass losses and the corresponding thermal spectra, we can quantitatively determine the mineral compositions of sediments.
2.2.4 Sequential extraction test with distilled water (batch test)
The sequential extraction tests were conducted with marine sediments and distilled water. Three identical samples were prepared by mixing 9 g of the natural sediment in 30 ml of distilled water with initial pH value of 6.3. The prepared samples were gently agitated for 48 h. And then, the samples were centrifuged for 30 min at 2450 g to separate the solid from the dissolved phases. The suspensions were subsequently filtrated with filters of 4.5 μm pore size. Finally, sodium and calcium concentrations in the dissolved phase were analyzed using an atomic adsorption spectrophotometer (Shimadzu AA-6300). Following the first extraction, the tested samples were dried in oven under temperature of 40 °C for 24 h. These dried samples were used to prepare the second set of samples according the first extraction procedure. The third extraction tests were sequentially conducted. The coefficient (D) of cation desorption capacity is defined and calculated as follows:
| (2) |
3 Results and discussions
3.1 Geotechnical identification
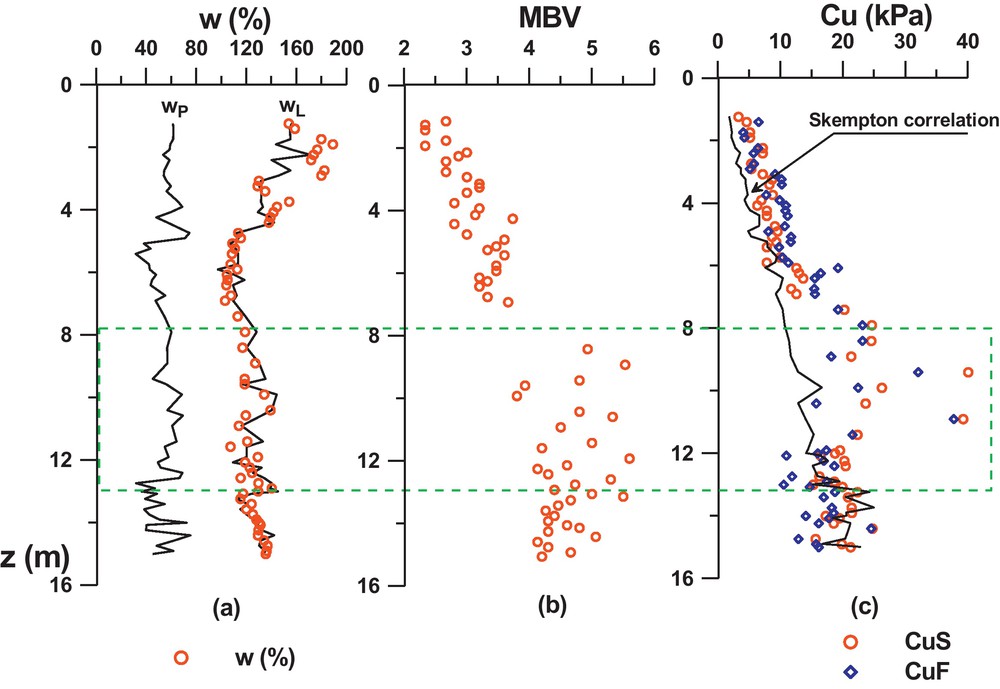
The geotechnical properties of GoG sediments, may be at first approach represented by the profiles in the Fig. 1a and b: of the liquidity limit, plastic limit, and the MBV (Methylene Blue Value). The profiles show that globally, wL varies from 110% to 160%, wP from 30% to 90%, and the MBV from 2.3 to 5.5. The liquid limit appears very pronounced (especially at the surface) where it reaches around 160%. From that point, it seems to decrease by steps according to depth and to be stationary around 130% from 7 m or 8 m depth onwards. However, this tendency is not very clear in the wP profile (due to the dispersion of the results caused by the measurement method) but is confirmed in the MBV profile which increases, by steps also, until a depth of 7 m to 8 m, and then remains constant around MBV = 4.5. On the IP-wL abacus (Fig. 2) the results show globally that the sediments correspond to smectite type clays. The profiles on Fig. 1a indicate also very high values of wnat (represented on the figure by open circles), very close to the liquid limit and sometimes higher, especially on the surface with values up to 180%. At a depth of 7 m, wnat seems to stabilize around 120%.
Geotechnical properties of GoG clay.
Propriétés géotechniques de l’argile GoG.
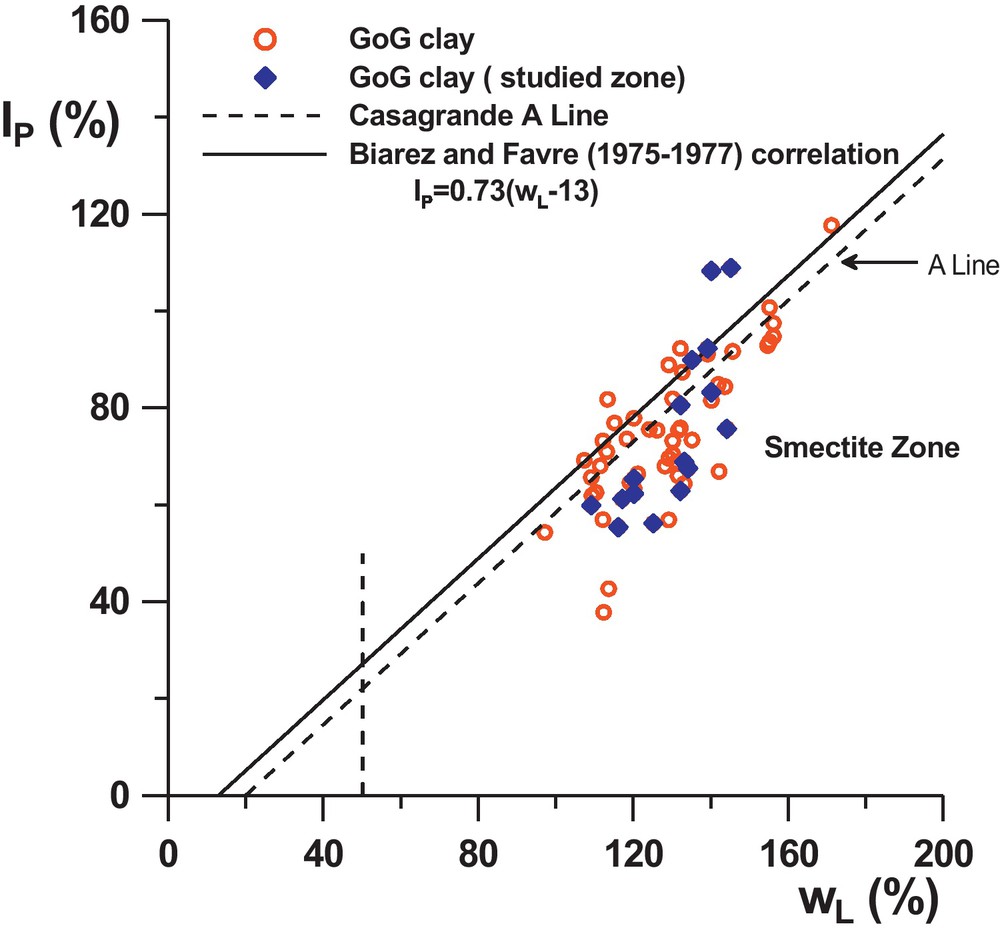
Geotechnical characteristics results on (wL-IP) plane.
Résultats des caractéristiques géotechniques sur le plan (wL-IP).
3.2 Mechanical behaviour and effect of the cementation presence
3.2.1 Undrained cohesion tests
The undrained cohesion was measured by the fall cone method (cohesion denoted cuf) illustrated by squares in Fig. 1c, and the laboratory vane test (cohesion denoted cuS) illustrated by circles. Their profiles are compared with Skempton's equation (3), expressed for remoulded normally consolidated mineral clays.
| (3) |
The results show that the values of cuf and cul are close to each other in the first 9 metres, cuf being slightly lower from a 9 m depth. Compared to Skempton's correlation, the measures are slightly higher in the first 7 m. This is due to the presence of natural cementation which can be very high as shown between 7 and 11 m, where the measures move strongly away from the correlation.
3.2.2 Behaviour on oedometric stress path
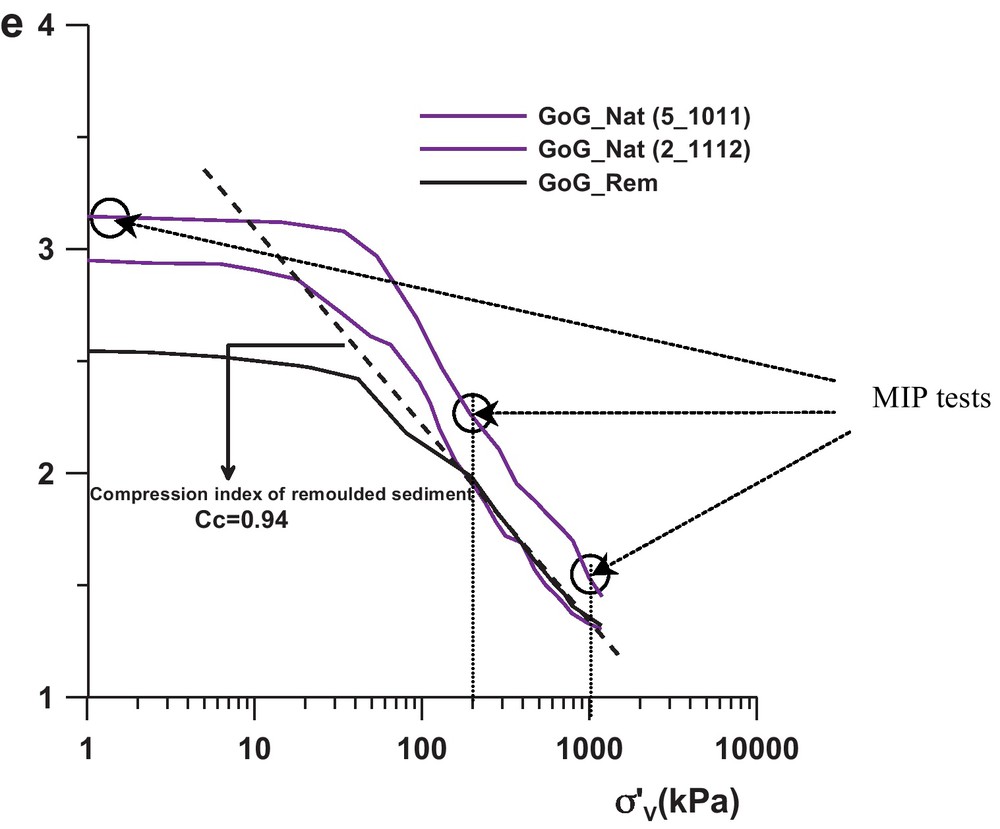
The mechanical behaviour is illustrated by three oedometric tests (Fig. 3), performed on the GoG sediments in the following conditions:
- • GoG_Nat (5_10 11): specimen of intact sediment taken at 10.8 m depth;
- • GoG_Nat (2_11 12): specimen of intact sediment taken at 11.3 m depth;
- • GoG_REM: specimen of remoulded sediment.
Oedometric paths on GoG clay in studied zone.
Diagrammes œdométriques obtenus sur l’argile GoG de la zone d’étude.
In this test, the applied stress tensor to the material is such that we impose the evolution of both parts of the stress, the isotropic path and the deviatoric one. The deformation obtained depends only on the amplitude of the stress tensor on the case of the remoulded sediments (thus, two mechanisms of deformation, isotropic and deviatoric), in which it is necessary to add the effect of bonding damage in the case of the intact sediment (Hattab and Favre, 2010; Yin et al., 2010).
The GoG_REM curve (Fig. 3), were e is the void ratio and σ’v the vertical effective stress, exhibits the intrinsic compressibility phenomenon of the sediment (Burland, 1990; Favre and Hattab, 2008) characterized by the compression index Cc = 0.94.
The observed paths, for both intact sediments, highlight the behaviour of a non-remoulded (intact) normally consolidated sediment, with a bend towards the stress σ’v = 60 kPa located above the remoulded oedometric path, suggesting the beginning of breakage of cementation between “grains” and particles. That also shows the elastic limit in the phenomenological behaviour of the material. This bend is followed by a curve which seems to gradually join the remoulded behaviour, expressing a process of progressive degradation of the cementation between the “grains” and plastic flow rule. This is clearly shown in the case of GoG_Nat (2_11 12) sample. GoG_Nat (5_10 11) sample seems to contain higher cementation (more sensitive sediment (Skempton and Northey, 1952)).
In the aim to observe the local deformation, especially which bond is concerned by the damage, Mercury porosimetry intrusion tests were performed, supported by SEM pictures. These latter tests cannot otherwise determine the nature of the damaged bond but only their location.
3.2.3 Local deformation observed by MIP results and SEM observations
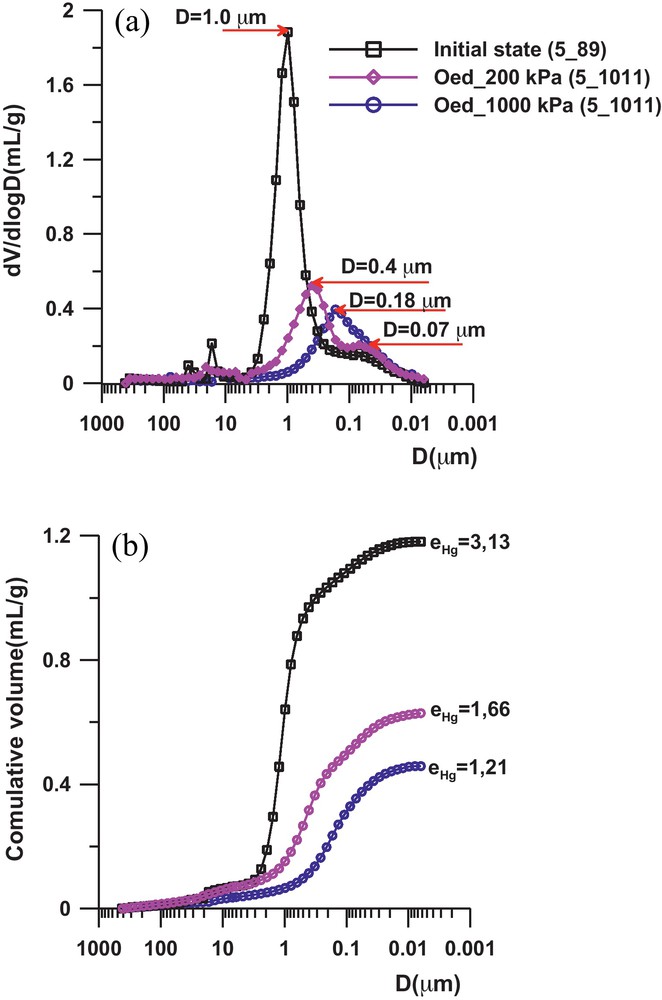
The samples of intact sediment were extracted from the core, the overburden effective stress being σ’v0 = 36.5 kPa. The porosimetric curves in Fig. 4b show a very high porosity of the natural sediment, which corroborates the behaviour obtained at the macroscopic level (Fig. 3). The pore size distribution of the sediment is complex and the curve presents several peaks in the 15 to 40 μm range which may correspond to inter or trans-assemblage pores according to Collins and McGown (1974) terminology. One observes the presence of two peaks in the curves (Fig. 4a), with a first pore family which may be considered as an interaggregate type, with an average diameter of about 1 μm; and a second pore family of the intra-aggregate type with an identical average diameter of about 0.07 μm. After the oedometric loading, the porosity change seems to be directly related to the closure of the interaggregate pores, and then, the breakage of the cementation which link these aggregates. This is clearly highlighted by the kinetic of the incremental curves from the initial state to the oedometric loading state (Figs. 3 and 4a) where we can see:
- • at σ’v = 200 kPa, the average diameter of the interaggregate pores decreases significantly, varying from 1 to 0.4 μm in the intact sediment. The intra-aggregate porosity remains unchanged, with an average diameter of about 0.07 μm;
- • at σ’v = 1 MPa, the average diameter of the interaggregate pores continues to decrease, with a value equal to 0.25 μm.
Mercury porosimetry results after oedometric loading of the intact GoG sediment.
Résultats de la porosimétrie au mercure après chargement oedométrique du sédiment intact.
SEM observations (Fig. 5) after the oedometric loading of σ’v = 1000 kPa corroborate MIP results. The photo of the remoulded sediment (Fig. 5a) shows particles clearly oriented following the horizontal plane (which is perpendicular to the loading axis). Particles in this case are in fact free to rotate. On the other side, the aggregates structures in intact sediment are not affected by the mechanical loading (Fig. 5b). Particles inside the aggregate remain bonded by a cementation which is not damaged yet.
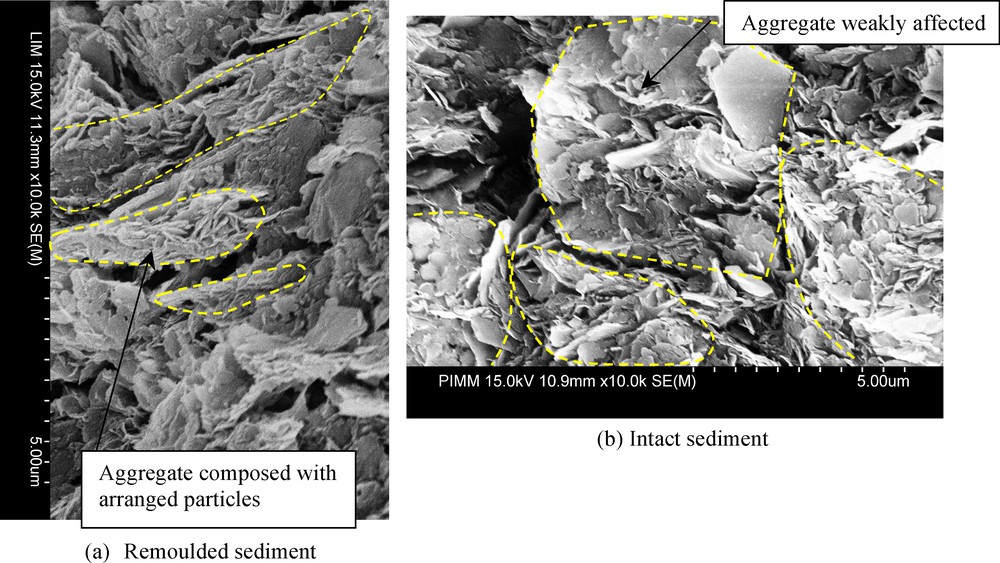
SEM images after oedometric loading (σ’v = 1000 kPa) of the remoulded and intact GoG sediment.
Images au microscope électronique à balayage (MEB) après chargement oedométrique (σ’v = 1000 kPa).
The interest in what follow is in trying to understand the nature of the glue concerned by the degradation; several complementary physicochemical tests were thus conducted, starting with SEM picture analysis.
3.3 Physicochemical investigations
Table 1 presents physicochemical analysis planning on GoG sediments at different depth.
Analyse physicochimique des sédiments marins étudiés.
| Sediment | Depth (m) | Surface area (BET) | C.E.C | SEM | Batch test |
| Sed 1 | 10.8 | × | × | ||
| Sed 2 | 11.3 | × | × | × | × |
| Sed 3 | 11.3 | × | × | ||
| Sed 4 | 7.5 | × | × | ||
| Sed 5 | 7.5 | × | × |
3.3.1 SEM observation
The SEM photo of intact sample (sample Sed 2, see Table 1) in Fig. 6 showed that the natural sediment presents a typical microstructure similar to card-house. It is also confirmed that the relative high void ratio of intact samples compared to the remoulded one results in large interaggregate pores. Furthermore, as it was proven above, the bonding exists between sediment aggregates. It is supposed that these bonds are out of a smectite gel according to their fine structure.
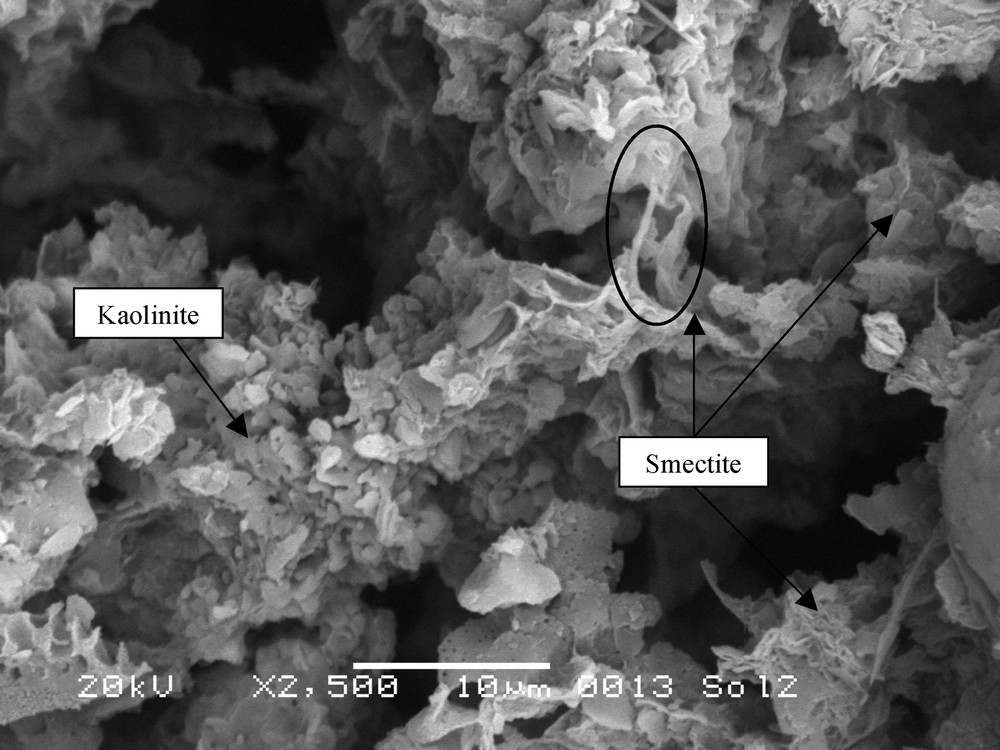
SEM image of Sed 2 at depth between 11 m and 12 m (Gold coated specimen).
Image MEB du Sed 2 à une profondeur comprise entre 11 et 12 m (spécimen recouvert d’or).
The results of EDS analysis in Table 2 indicate that main chemical elements are Na, Mg, Al, Si, S, Cl, O, K, Ca, Fe in tested sediment, and the mass proportion of sodium and calcium present the highest values. So it can be suggested that the interlayer exchangeable cations are mainly dominated by Na+, Mg2+, K+, Ca2+, and Fe2+ as other compensating cations.
Compositions élémentaires de sédiments, déterminées par spectrométrie à énergie dispersive.
| Element | Na | Al | Mg | Si | K | Cl | S | Ca | Fe |
| Mass proportion (%) | 12.66 | 5.53 | 1.77 | 9.53 | 2.10 | 25.76 | 3.79 | 8.70 | 3.91 |
3.3.2 Surface area analysis (BET) and Cation exchange capacity (C.E.C) analysis
Table 3 presents the surface area (BET) and C.E.C results for the sediments and two quasi pure clays (Speswhite Kaolinite and Wyoming Bentonite). It can be noted that the surface area (BET) values for the sediments are close to that of Wyoming Bentonite except for Sed-1. This highlights that the particle sizes of the tested sediments are similar to that of smectite.
Surface (BET) et capacité d’échange de cations (C.E.C.) des sédiments étudiés.
| Sediment | Depth (m) | Surface area (BET) (m2/g) |
Total C.E.C (cmol+/kg) |
C.E.C (Na+) (cmol+/kg) |
C.E.C (K+) (cmol+/kg) |
C.E.C (Ca2+) (cmol+/kg) |
| Sed 1 | 10.8 | 14.44 | ||||
| Sed 2 | 11.3 | 25.25 | 20.8 | 74.5 | 5.86 | 66.4 |
| Sed 3 | 11.3 | 18.02 | ||||
| Sed 4 | 7.5 | 20.06 | ||||
| Sed 5 | 7.5 | 18.61 | ||||
| Speswhite Kaolinite | – | 12.56 | 4.2 | 1.71 | 0.412 | 0.958 |
| Wyoming Bentonite | – | 20.44 | 64.7 | 51.6 | 1.26 | 27.1 |
The C.E.C results show that the C.E.C values for Na+, Ca2+ and K+ of the tested sediment are higher than that of Wyoming bentonite, and its C.E.C value is higher for Na+ compared to that of the other two cations. In other words, the smectite present in the sediment is sodium one, but the exchangeable calcium content is very close to that of sodium. In addition, adding the C.E.C. for three exchangeable cations leads to an unusually high value, which is largely greater than the proposed total C.EC. This can be explained by the testing procedure: the total C.E.C value is determined using ammonium ion while those for the exchangeable cations by measuring their concentrations of first extraction solution after equilibrium of ammonium ion-sediment slurry. This indicates that the sediment contains also large amount of salts in pore water. From the sodium and calcium abundance of the tested sediment, it can be assumed that this marine sediment is very sensitive to the changes of pore water chemistry.
3.3.3 Thermal analysis
The mineral compositions of the sediments estimated by thermal analysis are presented in the Table 4. The results show that these sediments contain mainly kaolinite and smectite. The composition comparison between the sediments with different depth indicates that these sediments are relatively homogenous except for Sed 1. These results are consistent with that aforementioned obtained by using X-ray diffraction analysis.
Composition minéralogique des sédiments étudiés par analyse thermique.
| Sediment | Depth (m) | Gibbsite (248–308 °C) | Kaolinite (428–596 °C) | Smectite (677–761 °C) |
| Sed 1 | 10.8 | 3.7 | 34.43 | 26.25 |
| Sed 2 | 11.3 | 5.6 | 21.43 | 11.67 |
| Sed 3 | 11.3 | 1.3 | 14.78 | 13.54 |
| Sed 4 | 7.5 | 8.7 | 28.28 | 14.38 |
| Sed 5 | 7.5 | 5.3 | 22.14 | 14.38 |
3.3.4 Sequential extraction test with distilled water (batch test)
Table 5 presents the cations (Ca2+ and Na+) desorption capacity of sediments for three extractions. During the extractions, interstitial saline solutions are firstly diluted in the suspension, precipitated salts are subsequently dissolved, and cations fixed on clay particle surfaces are finally released. In this study, we consider that the first two effects mainly occur in the first extraction, and the last effect predominantly in second and third extractions. The results show that the desorption capacity proportions between Na+ and Ca2+ for the tested sediments vary from 5.5 to 15 for the first extraction, and from 6.0 to 19 for the second and third extractions. This indicates that Na+ is the main exchangeable cations between clay layers. Based on the results of the thermal analysis, these sediments contain kaolinite, smectite etc. We can conclude that a large amount of sodium smectite is present in these sediments. Moreover, the C.E.C values of the sediments confirm this assumption.
Capacité de désorption de Ca2+ et Na+ des sediments étudiés.
| Sediment | Depth (m) | First extraction | Second plus third extraction | ||||
| D (Ca) (cmol/kg) | D (Na) (cmol/kg) | D (Ca) (cmol/kg) | D (Na) (cmol/kg) | ||||
| Sed 1 | 10.8 | 2.0 | 28.9 | 14.74 | 0.8 | 6.9 | 9.21 |
| Sed 2 | 11.3 | 4.2 | 22.9 | 5.48 | 0.8 | 5.0 | 5.9 |
| Sed 3 | 11.3 | 2.9 | 21.8 | 7.47 | 0.6 | 4.7 | 8.29 |
| Sed 4 | 7.5 | 3.1 | 19.4 | 6.16 | 0.4 | 3.8 | 10.64 |
| Sed 5 | 7.5 | 2.8 | 21.5 | 7.82 | 0.2 | 4.3 | 18.92 |
3.3.5 Discussion
Based on the physical-chemical analysis on GoG sediment samples, we can conclude that the tested sediment contains large amount of exchangeable cations (Ca2+ and Na+), therefore, its cation exchange capacity is very high. In addition, the exchangeable sodium content in the sediment is relatively higher compared to that of exchangeable calcium. From the X-ray diffraction analysis, we also see that smectite is one of main mineral components in these sediments. Therefore, it is supposed that the sediment has great content of sodium smectite. In saturated conditions, compared to calcium smectite, sodium smectite has very high water uptake capacity and swelling potential. This analysis is confirmed by high water content of the sediment (Fig. 1a). Moreover, from the SEM imaging, it seems that most of aggregates show the features of card-house structure, which may be formed by arrangement of kaolinite particles with connections of smectite clay representing a plastic and bonding clay. These connections are, in fact, resulting from electrostatic attraction forces due to the presence of positive charges coming from high concentrations of exchangeable cations in the system. These positive charges are acting to balance the negative ones of very chemically and electrically (active smectite particles). This creates strong link between kaolinite aggregates. During the oedometric loading, the card-house structure degrades and then the interaggregates pores tend to be suppressed. While intra-aggregate porosities are not affected by this loading. Accordingly, it yields to decreasing dominant entrance pore sizes. Based on the interpretations above, it can be confirmed that sodium smectite plays the role of a type of “glue” or gel. The presence of smectite gel between kaolinite particles can result in the bonding effect of the sediment. It is assumed that the bonding effect described by a conceptual microstructural model of sediment (Fig. 7) can be mainly dominated by the electrostatic attraction and Van der Waals attraction forces. As result of these bonding forces, the mechanical behaviour of sediment shows the obvious cementation features during the oedometric loading.
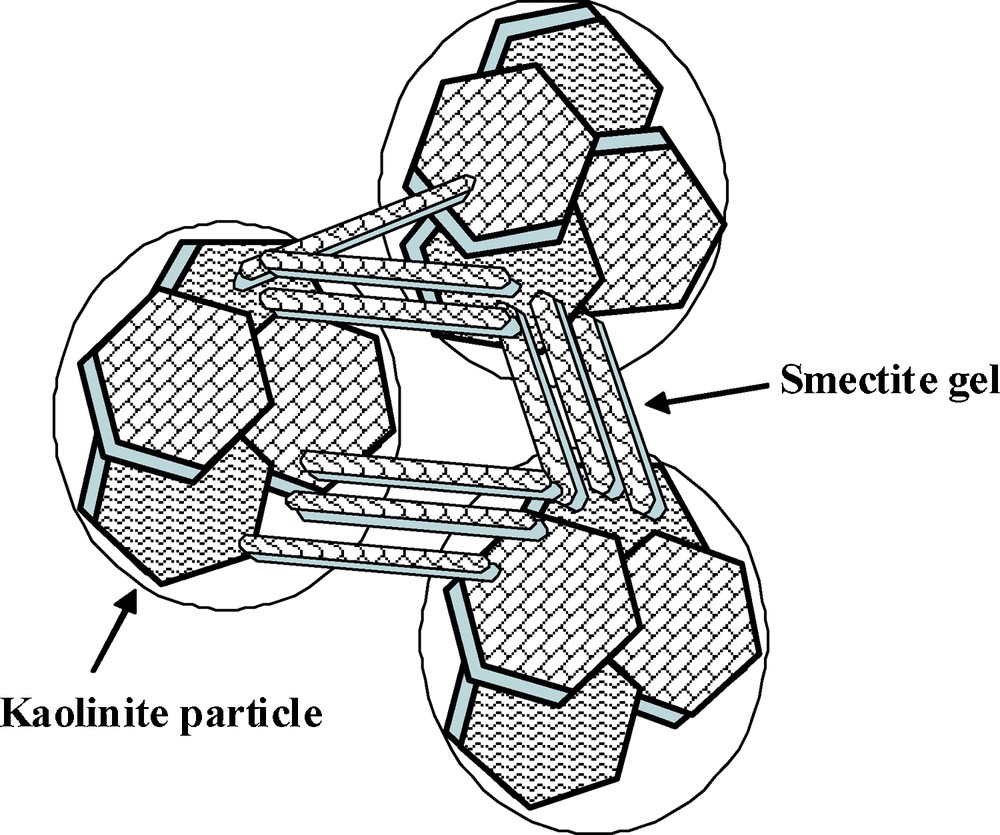
Conceptual microstructural model of GoG sediment.
Modèle conceptuel de microstructure du sediment GoG.
4 Summary and conclusion
Different laboratory tests for mechanical and physicochemical investigations were performed to investigate the cementation properties in marine sediments from Gulf of Guinea.
Mechanical tests clearly highlight the presence in the material of a cementation which is gradually destroyed during the loading. Thus, the oedometric path on the (σ’v-e) plane tends to join the behaviour of remoulded reconstituted sediment. Mechanisms of local deformations were approached by porosity variations using Mercury Intrusion Porosimetry tests. These investigations highlight that porosity change, which includes degradation of bonding, during oedometric loading is to be directly related to the closure of the interaggregate pores. Intra-aggregates cementation seems to be not affected. On the other side, analyses of the SEM pictures, corroborate these MIP results.
The physicochemical analyses indicate that a large amount of sodium smectite is present in these GoG marine sediments. Therefore, the presence of cementation in the tested sediment can be strongly related to the high quantity of sodium smectite gel between kaolinite particles. The bonding effect between sodium smectite particles and kaolinite particles can be mainly attributed to electrostatic and Van der Waals attraction forces. It can be described by the conceptual microstructure model of the sediment.
Acknowledgement
The authors want to thank Fugro-France for providing the core of GoG material and Pr. Jean-Louis Favre for fruitful discussions. This work was initially conducted within CLAROM Project “Deep water sediments” project. Project partners were: IFP, IFREMER, Fugro-France, Saipem-SA, Stolt Offshore, Technip and Total.