

1 Introduction
The monitoring of self-potential (SP), or naturally occurring electric potentials, is suitable for generated from water flow (Jouniaux et al., 2009, 2010; Mauri et al., 2010). The applications for SP comprehend characterization of contaminant plumes (Arora et al., 2007), groundwater flow (Perrier et al., 1998), landslides studies (Colangelo et al., 2006), identifying permeable layers in wellbore analysis (Hunt and Worthington, 2000), identifying possible volcano structures (Aizawa, 2008; Zlotnicki et al., 1998), and SP anomalies related to CO2 degassing in volcanoes (Byrdina et al., 2009; Finizola et al., 2010).
The last example is in our consideration, studies also applicable to Carbon Capture and Storage (CCS) projects for monitoring purposes. In recent years, CCS projects have posed the challenge of developing techniques for following evolution of gas in reservoirs. In the same sense, tools for monitoring and quantifying CO2 leakage to the surface are required if commercial application is demanded (Wells et al., 2006). According to Hepple and Benson (2002), an acceptable seepage rate of CO2 should be less than 0.01% per year. This estimation considers both economical and environmental needs. For accomplishing such restrictions and preventing possible accidents, diversified solutions adapted to each scenario should be designed.
Current CCS programs are being monitored in depth using seismic such as in Sleipner (Chadwick et al., 2004), Lacq (Aimnard, 2007), electrical methods in Ketzin (Giese et al., 2009; Girard et al., 2011). However, when designing plans for surveying leakage on the surface, new technologies such as SEQURE (defined in Wells et al., 2006) might suit better. For exploring possibilities in tackling such challenges, we have been investigating about feasibility of detecting CO2 leakage on the surface using SP.
Origins of SP are always related to thermodynamic gradients (pressure, concentration, temperature). As described for example in Jouniaux et al. (2009), SP can be explained in most cases as the sum of an electrochemical component and an electrokinetic one. The electrochemical component is related to ionic concentration or redox gradients between two zones, whilst the electrokinetic is due to conductive fluid flowing through a porous media whose pore surface is electrically charged.
When fluid flows through a porous medium, its relative motion in the electric double layer generates a voltage difference. In two-phase flow conditions (one of them insulating), electrical field is enhanced if water saturation is above its critical level (Revil et al., 1999). At the laboratory scale, Antraygues and Aubert (1993) made experiments where wet steam induced a large potential difference sustaining that electrokinetic effects were the best explanation for this occurrence. Also, Sprunt et al. (1994) found that air bubbles increased in more than two orders of magnitude potential values over single-phase brine flow (using silver-silver chloride electrodes), they specified that when water is the wetting phase and the second phase is neither polar nor contain excess of charge, then the streaming potential coefficient (SPC) decreases with decreasing water saturation (Jackson, 2008). Guichet et al. (2003) stated that SPC is either constant or decreases with decreasing water saturation. Revil and Cerepi (2004) concluded that SPC scales, at least at low ionic strengths, with the reduced water saturation; and so Strahser et al. (2011) also deduced a decrease of the SPC as the water saturation decreases. Finally, Allègre et al. (2010) suggested that SPC increases and then decreases during progressive water desaturation. Allègre et al. (2011) showed that previous observations were in concordance with their results. From those cited articles, we argue that the SP response in two-phase flow is still on debate.
With that experimental background, it could be then projected that if SP is applied on a CCS site, some electric potential variations could be registered at the very first moment that leakage occurs (as a similar case to the work reported in Byrdina et al., 2009). Hence we resolved in re-creating an analogous of such scenario at the laboratory scale for assessing electric responses related to gas flow. Our experiments aim to identifying gas disruption in porous media by comparing signals before, during, and after gas injection. Our approach was to analyse the amplitude of signals (if occurring) in terms of distance between gas source and electrodes, response time respecting the injection timespan, and the effects of electrode's size.
2 Materials and methods
Basically, we injected CO2 and N2 at the bottom of sand saturated with water, measuring the self-potential differences at the surface using different non-polarisable electrodes. The electrodes were placed at different distances respecting the gas source to investigate how the signals varied along the plume ascension. We expect to have larger signals on those electrodes closed to the injection point. However, we want to investigate about if the injection timespan can be discriminated (especially after arresting the injection), and the influence of the size of electrodes respecting the porous media.
2.1 Sandbox and filling procedure
A rectangular Plexiglas sandbox (30-cm high, 10-cm wide and 50-cm long) was built to contain the porous media through which CO2 will be injected. Holes at its sides were drilled to keep the system at atmospheric pressure ventilating CO2 degassing. At the top, a polystyrene cover was placed for holding the electrodes stiffly. The device was made entirely with insulating materials.
We used for our experiments Fontainebleau sand. Composition analysis resulted in 95% quartz. The remaining 5% was constituted of feldspars and micas. The sand was sifted using a sieve shaker obtaining a range in grain diameter between 200 μm and 400 μm. Sand was poured in water adding and stirring simultaneously for avoiding stratification intending to create a homogeneous arrangement. Despite our efforts, some incipient layering persisted creating a somehow preferential accumulation of gas. Sand was added up to 22.5 cm in height, the surface of water 2 cm being above. On the sand surface, a plastic mesh was placed for preventing sand movement during gas injection.
We granted the electrical contact between sand and electrodes by ensuring 100% water saturation with a solution consisting in distilled water at 0.56 g L−1 NaCl concentration (1.02 mS cm−1 at 23.8 C). After mixing the sample with the ionic solution, we waited for two days without perturbing the system in order to reach chemical and mechanical balance for a homogeneous distribution of ions. Each test was performed within no more than one week after reaching equilibrium; hence, we considered no need in adding chemical inhibitors of biological activity.
2.2 Electrodes and acquisition system
We constructed and used Cu/CuSO2 non-polarisable electrodes following specifications in Maineult et al. (2004). The length was 250 mm, an external diameter of 5 mm and a porous ceramic tip of 2.5 mm in diameter (Fig. 1). A small diameter was important since we tried to develop an electrode as thin as possible to avoid hydraulic perturbations.
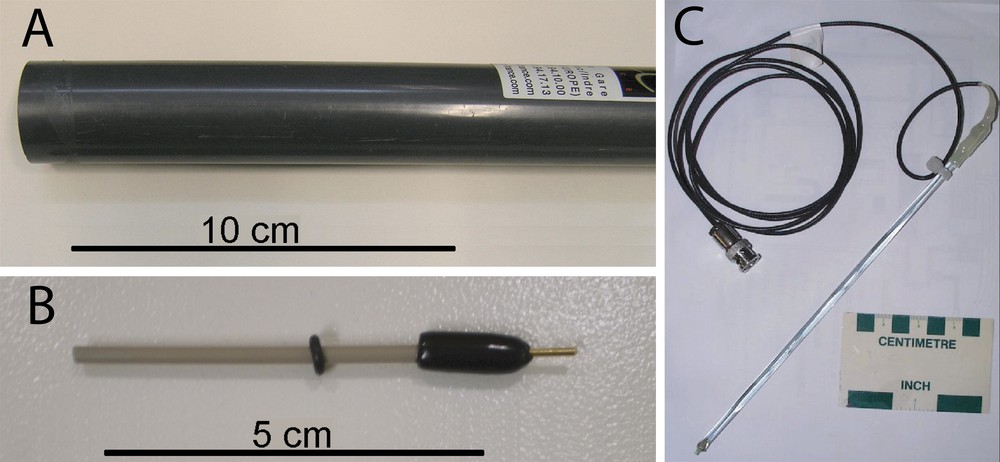
The different types of electrodes used in the experiments. A. Petiau (SDEC PMS-9000). B. ESA. C. Maineult.
Les différentes électrodes utilisées lors des expériences. A. Petiau (SDEC PMS-9000). B. ESA. C. Maineult.
These electrodes were used during calibration and preliminary tests. After analysing results, we decided to compare signals obtained with non-polarisable Ag/AgCl manufactured electrodes (ESA, 66-EE009). They are much smaller being 67 mm in length, 2 mm of external diameter and a porous ceramic of 1 mm in diameter (Fig. 1).
For the final tests, we contrasted results obtained with Pb/PbCl2 non-polarisable electrodes (SDEC, PMS-9000), commonly used for field measurements (usually known as “Petiau” electrodes; see for instance Petiau, 2000). They are more robust than the previous ones with a length of 180 mm and 32 mm of diameter (Fig. 1). We were focused in comparing if all the electrodes measured similar signals, also we wanted to assess if natural inertia and surface area of electrodes had any influence on the electric responses.
Electrodes were aligned parallel to the length of the sandbox (Fig. 2). Named from E1 to E20, they were arranged in two lines of 10 electrodes being each line at different depths (Table 1). The reasons for varying the depth are related to the size of the electrodes and focus of data during gas plume advection. All the electrodes used were non-polarisable with a porous tip for making electric contact as required when dealing with unsaturated media.
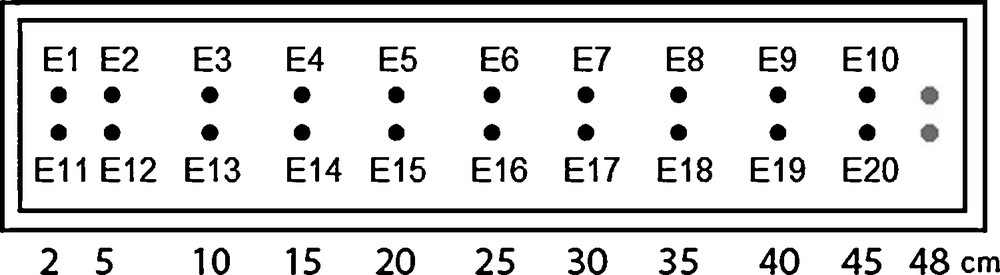
Position of the electrodes in the sandbox (upper view). Black dots (E1–E20): measurement electrodes, grey dots: reference electrodes.
Position des électrodes dans la cuve (vue de dessus). Ronds noirs (E1–E20) : électrodes de mesure, ronds gris : électrodes de référence.
Gaz et électrodes utilisés pour chaque expérience.
| Test | Gas | Electrodes | Positions | Depth (cm) |
| 1 | CO2 | Maineult | E1–E10 | 8.5 |
| 2 | N2 | Maineult | E1–E10 | 12.5 |
| Maineult | E11–E20 | 8.5 | ||
| 3 | CO2 | ESA | E3, E5, E8, E9 | 4 |
| Maineult | E3, E5, E8, E9 | 4 | ||
| 4 | CO2 | Petiau | E1–E10 | 2 |
For measuring SP signals, we used a high-impedance Keithley multiplexer (DMM 2701, impedance > 10 GΩ) with a 40-channel acquisition card (DM 7702). The electrical potential difference (EPD) between each electrode and the reference was successively scanned (delay between two consecutive channels equal to 0.15 s), with a sampling rate of 6 points per minute for each channel. Each EPD was averaged on 5 cycles of the 50 Hz to reduce the noise.
2.3 Gas injection
In pursuing diverse regimes in gas flow, we used two different injection devices. In first test we used a 12-cm plastic tube with three holes equally spaced covered with a nylon mesh to avoid obstruction. Differential pressure between its end points made the flux higher at the beginning of the tube, resulting in uneven distribution. The connecting hose between the tube and gas bottle (under pressure) entered on the sand surface, which proved to be, later on, an important discontinuity for gas being conducted through the interface hose-sand. From the second test, we changed the injection source to a ceramic air diffuser (commonly used in aquariums) of 15 cm in length and 1.5 cm in diameter. Its design allowed us to inject gas homogeneously in tiny bubbles with continuous gas flow. The connection point was also relocated this time entering at the bottom side of the sandbox for avoiding discontinuities on sand surface. Position of gas injection remained unchanged placed at 2 cm from the bottom and with its right end below electrodes E5-E15 (Figs. 2 and 3). For registering the electric potential variation due to the gas plume accurately, there must be at least one electrode acting as reference in a “non-perturbed zone”. Our goal was to assess if electrodes placed in the “perturbed zone” (i.e., the zone where two-phase flow occurs) registered any significant electric potential variation. Therefore, we decided to place the air diffuser in a way that affects only half of the sandbox (Fig. 3). The gas was injected under pressure at the bottom of the tank trying not to disturb the sand arrangement. Nevertheless, we do not discard that during ascension of gas some turbulent flow was created. References electrodes were located at opposite right for avoiding any disturbance with gas.
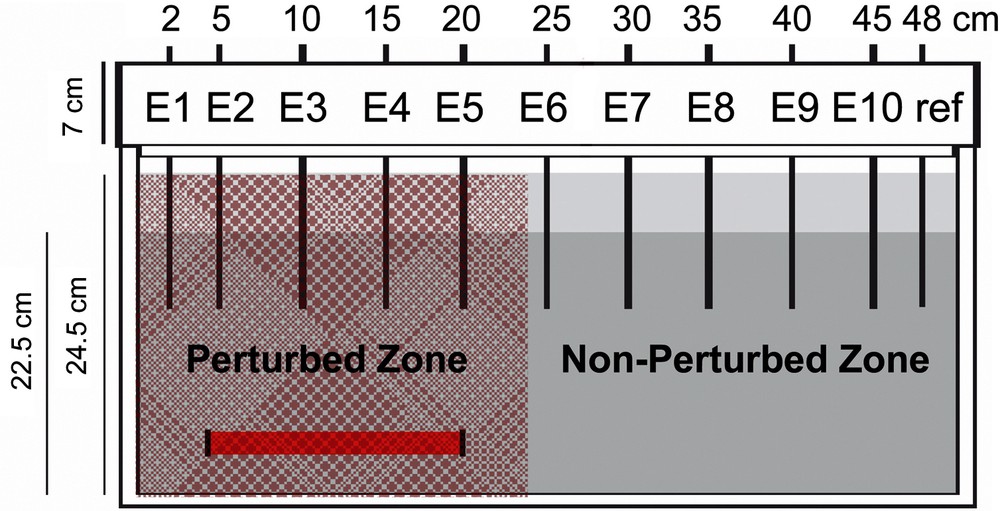
Position of the electrodes (front view). Dark grey: saturated sand, light grey: surface water, black lines: electrodes, red rectangle: position of the gas diffuser. The dashed zone gives an idea of the zone perturbed by the gas injection (however, in some cases, it was more extended).
Position des électrodes dans la cuve (vue de face). Gris foncé : sable saturé, gris clair : eau en surface, lignes noires : électrodes, rectangle rouge : diffuseur de gaz. La zone hachurée donne une idée de la zone perturbée par l’injection de gaz (néanmoins, dans certains cas, elle était plus étendue).
Electrodes used for measuring the electric potential possess a natural drift inherent to each one. Using a set of electrodes with too much difference between them might be misleading. Between tests, we followed the progression of the drift in order to detect any malfunction. Also, each electrode was carefully examined for preventing leaking or alteration of saturate solution inside them. Damaged electrodes or electrodes with drifting beyond normal standards were discarded and replaced with new ones.
Tests lasted at least 48 h allowing possible electrode drift to stabilise before and after the gas injection. After reaching stable drift, we injected between 8 L h−1 and 16 L h−1 in a single injection event for more than one hour. In all experiments (except in the test with ESA electrodes), injection rate was increased drastically once or twice after starting for generating pulses and verifying correlation in signals. After the injection was stopped, we waited up to electric potential differences returned somehow to the baseline. Table 2 displays a brief scheme for the injection pattern we followed in each test. Results presented in this paper will deal around injection period for being the remaining timespan.
Caractéristiques des injections de gaz.
| Test | Time (h) | Flux (L h−1) |
| 1 | 0 | 0 |
| 0.5 | 8 | |
| 3.8 | 16 | |
| 5.1 | 0 | |
| 5.5 | 0 | |
| 2 | 0 | 0 |
| 0.5 | 8 | |
| 1.8 | 16 | |
| 2.8 | 0 | |
| 3 | 0 | 0 |
| 0.5 | 8 | |
| 2.9 | 0 | |
| 4 | 0 | 0 |
| 0.5 | 8 | |
| 0.75 | 12 | |
| 1.2 | 16 | |
| 1.7 | 0 |
3 Results
3.1 “Maineult” electrodes
The first test consisted in injecting CO2 through the plastic tube under two different injection rates. On the perturbed zone (Fig. 4), starting point at 0.5 h is identified by a positive pulse (except on electrode E4) with a little amplitude rounding 0.1 mV. The slope of the signals increase slightly from the normal drift (except on E4), suggesting that CO2 injection is taking place. Response obtained is not remarkably sharp yet noticeable. However, when we increased the rate at 3.8 h, a new positive pulse is registered except on electrode E1 (the farthest from injection point on the set). The peak between 5.1 and 5.5 h is due again to a variation in the gas input. After closing the gas valve at 5.1 h, there was still some gas in the system which took some minutes to drain building up extra pressure (evidenced in the flow-meter installed) before total gas exhausting resolved in a final pulse at 5.5 h. On non-perturbed side injection is also clearly identified at its starting point at 0.5 h. Throughout the injection span, the deviation from the drift is evidenced with a negative incursion of the amplitude when the injection rate was increased at 3.8 h. Another pulse is also identified in concordance with the perturbed zone between 5.1 and 5.5 h when the gas is stopped and the pressure build-up took place.
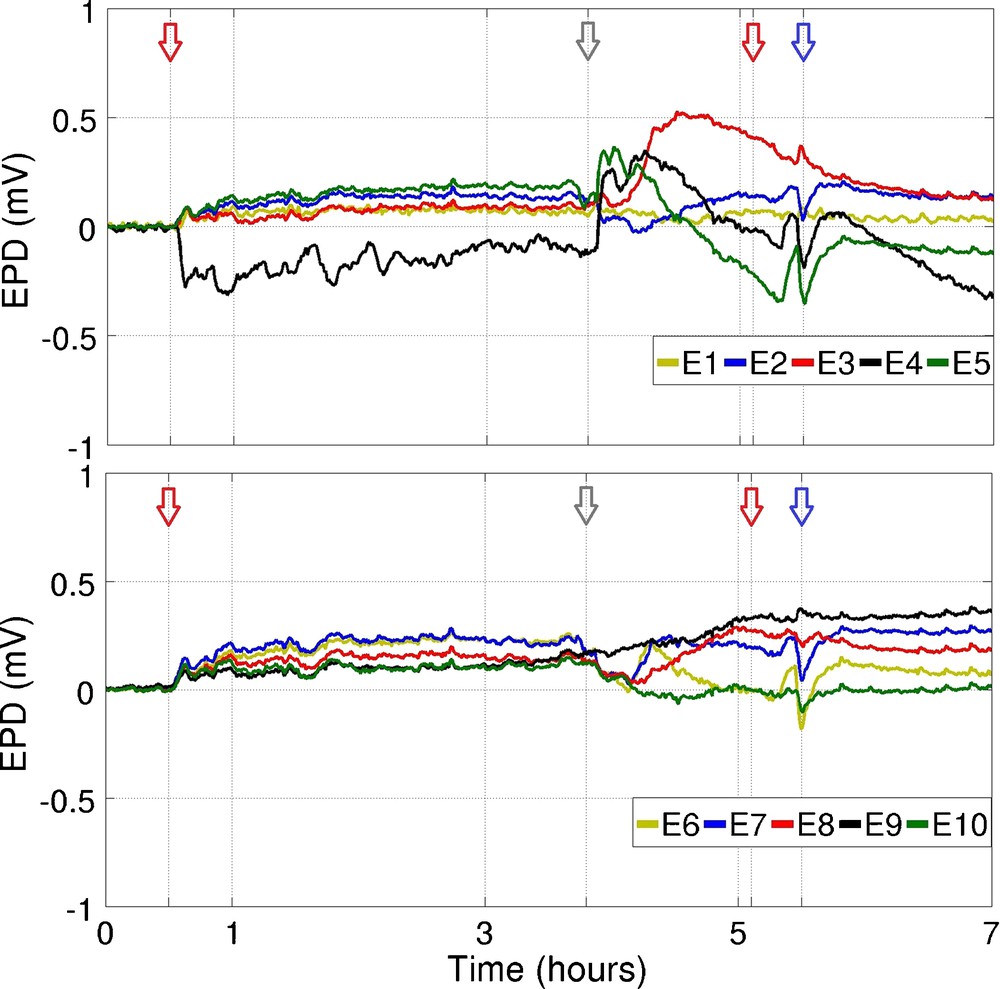
Self-potentials measured with Maineult electrodes during the first CO2 injection (upper graph: perturbed zone, lower graph: non-perturbed zone). Red arrows indicate the injection timespan (from 0.5 to 5.1 h), grey arrow the increase of the injection rate (at 3.8 h), blue arrow the end of gas exhausting.
Potentiels spontanés mesurés avec les électrodes Maineult lors de la première injection de CO2 (en haut : dans la zone perturbée, en bas : dans la zone non perturbée). Les flèches rouges indiquent le temps d’injection (0,5 à 5,1 h), la flèche grise l’augmentation du taux d’injection (à 3,8 h) et la flèche bleue la fin de l’échappement de gaz (à 5,5 h).
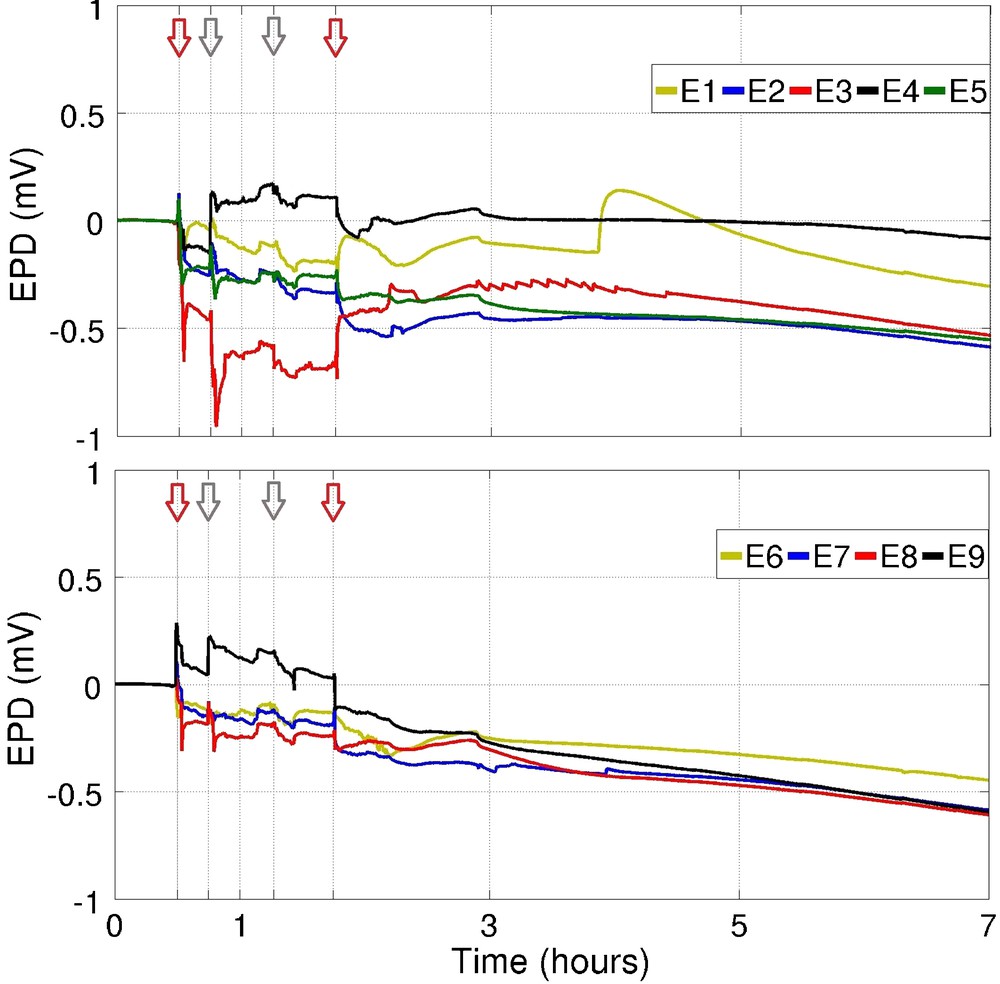
The second test was performed with the air diffuser, and injecting N2 instead of CO2 for comparing responses between both gases, N2 being chemically non-reactive. Also we installed 20 electrodes at different depth for analysing the effects of the plume during its ascension. On electrodes E1–E10, the starting point in the perturbed zone is clearly identified by a positive pulse at 0.5 h (Fig. 5). All the electrodes registered a change from the drift of about 0.2 mV followed by a quick drop. The behaviour between the start of the injection and the increase of the injection rate at 1.8 h is not identical for all electrodes, although they do tend to decrease in amplitude, except for E2. When the injection finishes at 2.8 h, a small decrease of about 0.1 mV is again identified. From that point the signals return to a normal drift. For the non-perturbed zone, the contrast is remarkable being the injection period merely detected on E6 at 0.5 h. During the injection period, electrodes E7 to E10 exhibit little variation from the drift not being clear if response is due to two-phase flow or is only noise.
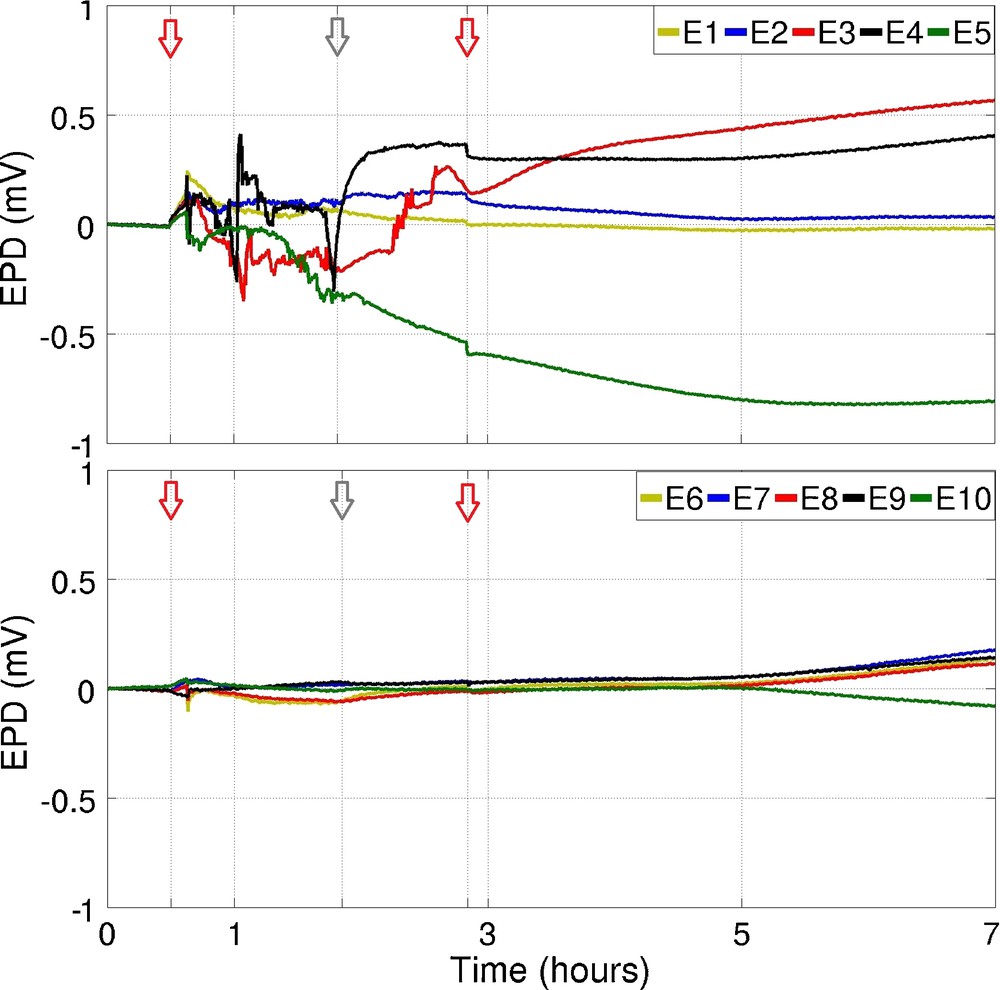
Self-potentials measured with the deep Maineult electrodes during the N2 injection (upper graph: perturbed zone, lower graph: non-perturbed zone). Red arrows indicate the injection timespan (from 0.5 to 2.8 h), grey arrow the increase of the injection rate (at 1.8 h).
Potentiels spontanés mesurés avec les électrodes Maineult en profondeur lors de l’injection de N2 (en haut : dans la zone perturbée, en bas : dans la zone non perturbée). Les flèches rouges indiquent le temps d’injection (0,5 à 2,8 h) et la flèche grise l’augmentation du taux d’injection (à 1,8 h).
Comparing with electrodes E11-E20 (shallower ones), the response is congruent but with some differences that shall be due to their position. Again, when gas disrupted the system, a short negative pulse is registered in both perturbed and non-perturbed zones (Fig. 6). The pulse responses from the increase of the injection rate are less marked respecting electrodes E1–E10, but at the same time the amplitude of the signals is larger during the injection span. That is, at shallow depth, the electrodes seem to be less sensible to point changes since gas is already widespread, averaging signals in the whole set.
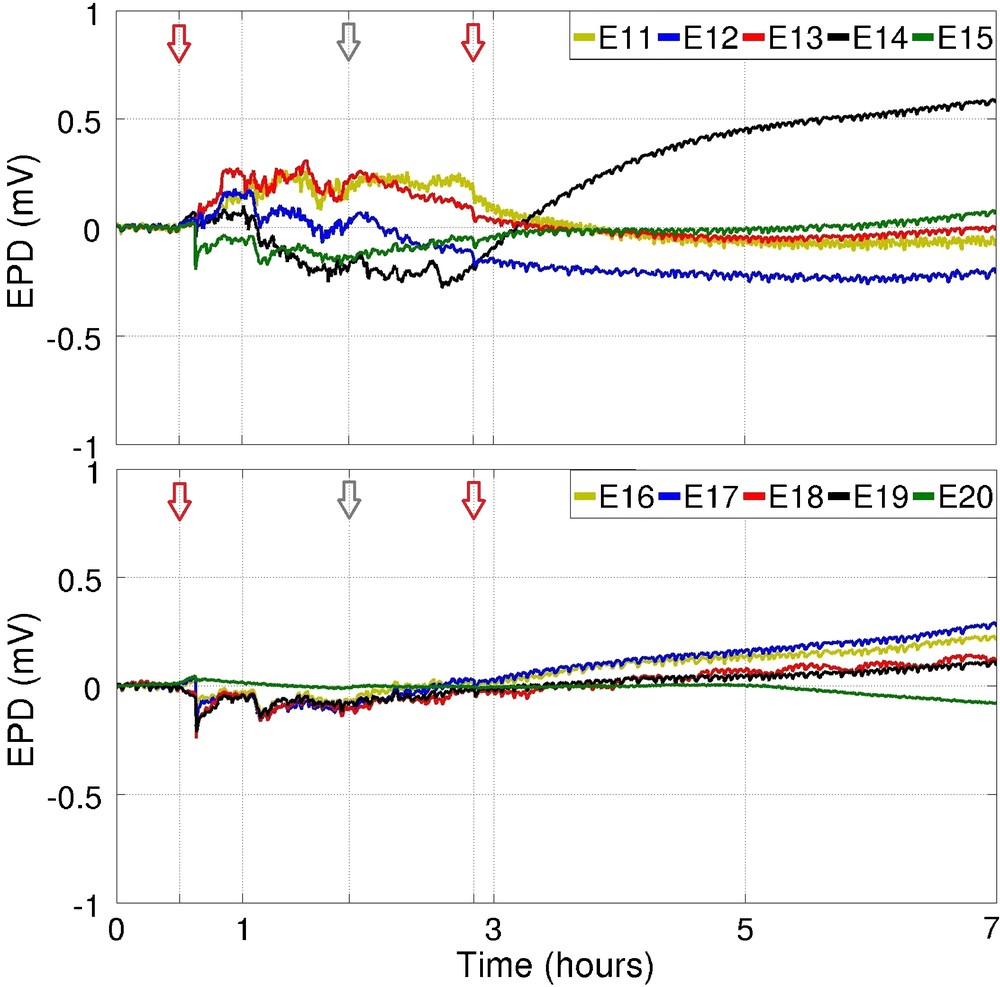
Self-potentials measured with the shallow Maineult electrodes during the N2 injection (upper graph: perturbed zone, lower graph: non-perturbed zone). Red arrows indicate the injection timespan (from 0.5 to 2.8 h), grey arrow the increase of the injection rate (at 1.8 h).
Potentiels spontanés mesurés avec les électrodes Maineult proches de la surface lors de l’injection de N2 (en haut : dans la zone perturbée, en bas : dans la zone non-perturbée). Les flèches rouges indiquent le temps d’injection (0,5 à 2,8 h) et la flèche grise l’augmentation du taux d’injection (à 1,8 h).
Respecting the previous test with CO2, we realised that difference between perturbed zone and non-perturbed zone is easily distinguished. The key point seems to be the injection device which allows the gas to spread and ascend in a less disrupting way.
3.2 ESA/Maineult electrodes
We repeated same experiment now using ESA electrodes. CO2 was injected from 0.5 h to 2.9 h at constant rate. Five electrodes were installed being E3–E5 on the perturbed zone and E8–E9 on the non-perturbed zone, the fifth electrode is the reference located the farthest from injection point. In Fig. 7 are shown the signals of the electrodes affected by the gas plume. The amplitudes are much higher, corresponding exactly with the gas injection timespan. In general they are positive with some remarkable negative pulses (i.e. not sustained in time). After stopping the injection, the signals returned to what can be considered as normal drift. On the other hand, the non-perturbed zone is characterised by flat signals with no remarkable variation. Electrode E3 seems to have a positive incursion of 0.5 mV but it is rather unclear and could be considered as noise from drift.
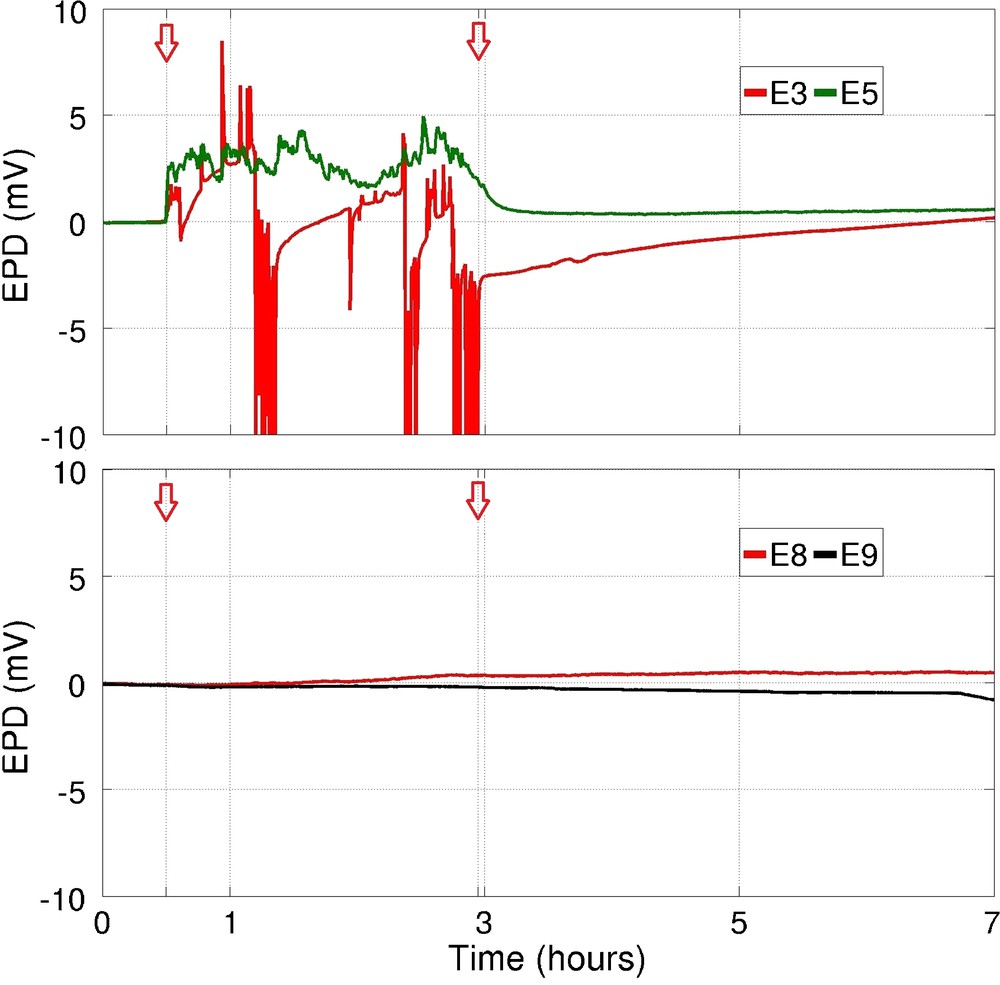
Self-potentials measured with ESA electrodes during the second CO2 injection (upper graph: perturbed zone, lower graph: non-perturbed zone). Red arrows indicate the injection timespan (from 0.5 to 2.9 h). Signal of electrode E3 could reach values below −50 mV.
Potentiels spontanés mesurés avec les électrodes ESA lors de la seconde injection de CO2 (en haut : dans la zone perturbée, en bas : dans la zone non perturbée). Les flèches rouges indiquent le temps d’injection (0,5 à 2,9 h). Le signal de l’électrode E3 pouvait atteindre des valeurs inférieures à −50 mV.
In the same settings and next to ESA electrodes, we placed Maineult electrodes for comparing signals. In Fig. 8 it can be seen that the amplitudes are about a tenth respecting the ESA electrodes. The signals in the perturbed zone are again larger than in the non-perturbed one. However, in the former there is some incipient response to the injection.
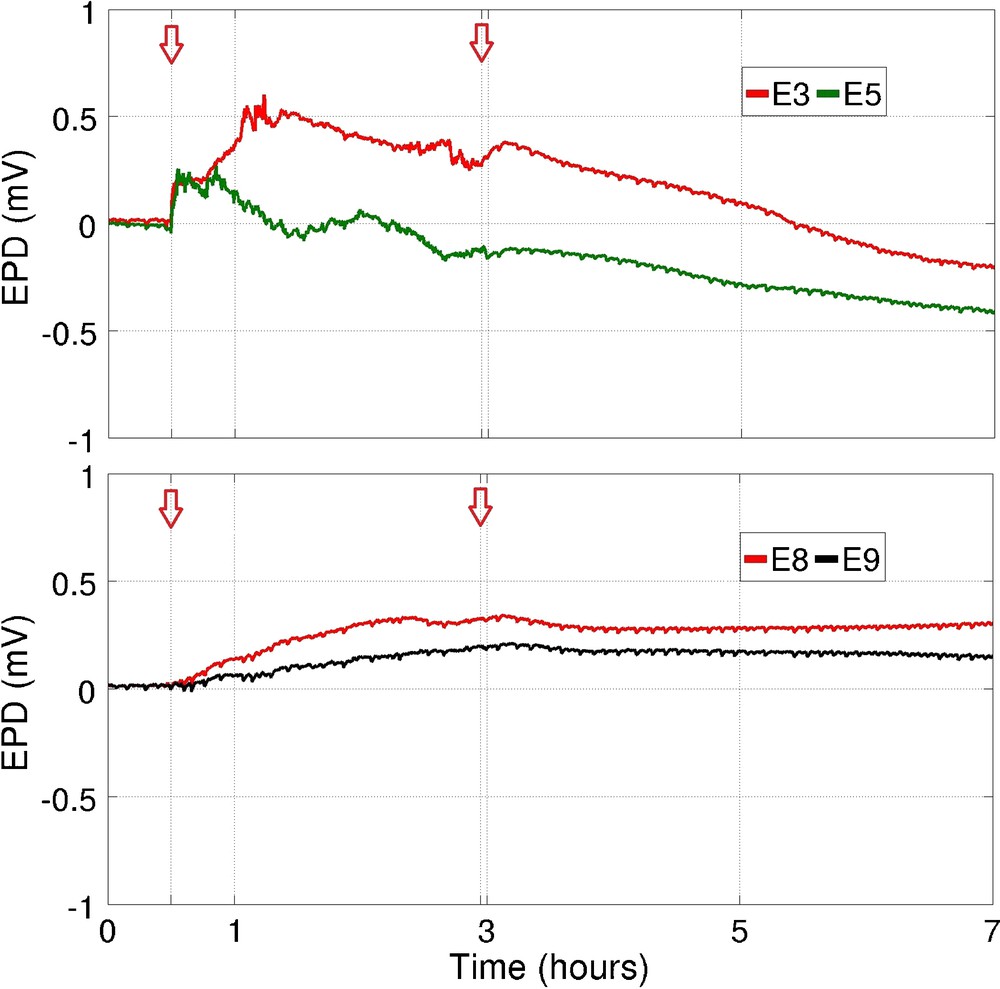
Self-potentials measured with Maineult electrodes during the second CO2 injection (upper graph: perturbed zone, lower graph: non-perturbed zone). Red arrows indicate the injection timespan (from 0.5 to 2.9 h).
Potentiels spontanés mesurés avec les électrodes Maineult lors de la seconde injection de CO2 (en haut : dans la zone perturbée, en bas : dans la zone non-perturbée). Les flèches rouges indiquent le temps d’injection (0,5 à 2,9 h).
3.3 “Petiau” electrodes
Larger electrodes were also tested. Fig. 9 displays the electrical potential diffrences in the perturbed and non-perturbed zones. Both zones produced electric potential differences with a similar behaviour but different amplitude, especially on pulses when changing the injection rate (at 0.75 h and 1.2 h). On electrodes E1–E5, larger amplitudes during the gas injection (0.5–1.7 h) are followed by a variation on the signals with no agreement, due to polarisation (electrode E3 between 2.7 and 4.2 h) or gas ascension previously trapped. In the non-perturbed zone, the CO2 injection is also identifiable, but the potentials return to the drift homogeneously and without important variations in their amplitude.
Self-potentials measured with Petiau electrodes during the third CO2 injection (upper graph: perturbed zone, lower graph: non-perturbed zone). Red arrows indicate the injection timespan (from 0.5 to 1.7 h), grey arrows the increase of the injection rate (at 0.75 and 1.2 h).
Potentiels spontanés mesurés avec les électrodes Petiau lors de la troisième injection de CO2 (en haut : dans la zone perturbée, en bas : dans la zone non-perturbée). Les flèches rouges indiquent le temps d’injection (0,5 à 1,7 h), et les flèches grises l’augmentation du taux d’injection (à 0,75 et 1,2 h).
4 Discussion
First, we must explain the challenges in managing the mechanical settings of the experiments. Changes in settings were done to obtain the best results closer to an analogous at field scale. Due to the erratic behaviour of gas in porous media, experiments under exactly same conditions did not convey similar results. Gas often spread horizontally, following the incipient layering created during the sand deposition. Also and depending on the injection rate, the gas could either spread or ascend rapidly. However, the path followed each time was not possible to be determined beforehand. At the moment, this limited us of trying to explain or to tie results to a theoretical model. The chemical conditions remained virtually the same throughout the experiments, which lead us to conclude that the electrokinetic potential was the main mechanism for generating the responses. Usually, at the field scale, up-flowing events on hydrothermal systems convey positive potentials (Aizawa, 2008; Finizola et al., 2010; Zlotnicki et al., 1998). Although this was the case most of the time in our experiments (registering positive signals during up-flowing), in some tests we also obtained negative potentials. Variations also came from difference in the size of the electrodes and consequently from their inertia. The representative elementary volume differs on each electrode. Indeed, electrodes with larger section can average the signals if these signals vary spatially over a distance smaller than the diameter of the electrode, whereas smaller ones are expected to measure signals occurring at the scale of few pores. The highest amplitudes reached might be due to the fact that the ESA electrodes measured signals at a smaller scale than “Maineult” electrodes, suggesting very localised pathways for the gas (i.e., occurring at the pore scale). On larger electrodes, the ratio between fluid and grains is more balanced than in smaller electrodes were tip could be largely occupied by fluid. Hence, a single gas bubble could almost cover the complete tip on ESA electrodes resolving then in amplitudes that cannot be equally compared to “Petiau” electrodes.
5 Conclusions
We were able of identifying the injection period in the perturbed zone. We realised that for the same type of electrodes, the distance to the degassing point was the main factor when determining the signal amplitude. The electrodes closer to the injection display sharp pulses when the injection rate increased, whilst the electrodes far from it usually react with larger and smoother signals. That could be explained if we think in amount of gas reaching each electrode. At depth, the gas is “focalised” whilst at surface it is widespread. It seems logical then that if the electrodes are installed nearby possible CO2 leakage path to surface (i.e. mainly boreholes), the SP technique could be implemented for surface monitoring. Although the method is likely not to identify amount of CO2 during degassing, it could detect that CO2 is actually leaking. At field scale, we could consider having a proper representative elementary volume for the “Petiau” electrodes.
The objective of our experiment was to determine if any SP signal is generated during the degassing and its relation to the gas source in terms of distance. As mentioned in the introduction of this paper, several theories have been proposed to explain SP signals in two-phase flow. The aim of our paper was not to conciliate those theories as the research program (GRASP) this investigation belongs to is focused on CCS projects and industrial applicability. The experimental apparatus was designed then to recreate realistic field conditions and the data resolution that could be attained. We considered that even more controlled conditions and more sophisticated apparatus are required in order to formulate a new model that conciliates the theories previously mentioned.
Acknowledgments
This work was partially financed by the GRASP CO2 (Greenhouse Gas Removal Apprenticeship and Student Program) European programme of Marie Curie Research Training Networks. We also thank the support of the IPGP research team on CO2 and the industrial partnership Schlumberger-Total-Ademe. This is IPGP contribution no 3331.