

1 Introduction
Up to now, seismology, ground deformations and geochemistry are much more prevalent in studying and monitoring volcanoes compared to electric and magnetic methods, although these latter methods may bring much information on the possible scenarios of future activity, among which a smooth a-seismic renewal of activity a long time prior to an eruptive event. In the following, attention will be primarily focused on electrical methods with the objective:
- (1) to describe the potentiality of electrical methods for imaging volcanic structures of depths of up to several hundred meters in which hydrothermal systems take place;
- (2) to illustrate changes in the electrical pattern of the static electric field [self-potential (SP) anomalies] linked to volcanic activity;
- (3) to analyze signals of durations of less than a few hours that appear prior to volcanic activity, from land and satellite observations.
2 Mapping the electrical signature of volcanoes
The recognition of a deep magma body, generally located at depths between 6 and 12 km, is a difficult task that cannot yet be completely solved by any method. Most volcanic eruptions are initiated by disequilibria at this depth whatever the mechanism involved: injection from a deeper juvenile magma, crystallization, thermal input, or increase of stress. Generally, these phenomena begin a long time (up to some years) before an eruption, and it is difficult to monitor the weak, slow, and deep changes (Sasai et al., 2002) that may give rise to a patchwork of small signals at the ground surface in the absence of seismicity. On the opposite, signals may be enhanced when deep phenomena begin to involve sources at a shallower depth, as in hydrothermal systems. These secondary sources induce thermal, gas emission, groundwater flow, change in the effective stress field, and opening micro-fissures inside aquifers. Thereby hydrothermal systems play the role of a relay and amplifier of phenomena having their origins at more out-of-reach depths. Transmission of the induced signals to the ground surface is effective through faults, craters/calderas rims, fumaroles, mud ponds and geothermal fields. Therefore, the difficulty in understanding, monitoring and predicting volcanic activities might be lessened by the fact that the dynamism of most eruptions is controlled by the upper volcanic structures.
One technique is based on the straightforward measurement of the electrical potential difference between two non-polarized electrodes well positioned in the ground. Using a reference electrode considered as a relative zero potential, the measurement of the potential every 10 to 50 m along an unrolled cable gives information on the groundwater circulation and the structural heterogeneities crossed by the survey, which can be as long as 10 km. Mixing different surveys with common sub-references allows us to totally map the SP anomalies at the ground surface. These anomalies define the “electrokinetic effect” and correspond to groundwater flows carrying electrical charges (Aubert and Dana, 1994; Ishido and Mitzutani, 1981). This method is effective, inexpensive, non-intrusive, and can easily be reiterated. However, data inversion requires the knowledge of many physical parameters that are often poorly known. Let us now consider examples of SP mappings on several volcanoes.
2.1 Application to different levels of activity
For our purpose, we may gather active volcanoes in three groups:
- (I) volcanoes that do not currently own an active hydrothermal system in their upper part;
- (II) those that exhibit large hydrothermal activity expressed by clay-rich rocks, soil degassing, warm outcrops, fumaroles, and a large related geothermal field at the ground surface;
- (III) volcanoes that have well-developed hydrothermal systems located at some hundred meters below their central part, and are surrounded by non-strongly mineralized bedrocks.
Group I can be illustrated by Mount Pelée in Martinique (Zlotnicki et al., 1998) or La Garrotxa monogenetic volcanic field (NE Iberian Peninsula; Bolos et al., 2014). Group II concerns volcanoes submitted during several tens to hundreds of years to large interactions between meteoric or seawater recharges and hydrothermal fluxes coming from depth. In such conditions, SP anomalies generally do not reach hundreds of millivolts, and are not well-contrasted along geothermal fields and mineralized fissures. Soufrière of Guadeloupe (Brothelande et al., 2014; Zlotnicki et al., 2006), White Island in New Zealand (Hashimoto et al., 2004; Mizuhashi et al., 2004), Taal volcano (Fikos et al., 2012; Zlotnicki et al., 2009a) and probably Vulcano in Italy (Revil et al., 2008) belong to this Group II. Group III corresponds to a great number of volcanoes with an active hydrothermal system that has not yet involved the mineralization of the surrounding bedrocks. Let us recall some of them: La Fournaise in Réunion Island (Lénat, 1987; Michel and Zlotnicki, 1998), Miyake-jima (Sasai et al., 1997), Aso (Hase et al., 2005) and Fuji-yama in Japan (Aizawa et al., 2005), Stromboli in Italy (Finizola et al., 2002), Masaya in Nicaragua (Mauri et al., 2012), and Tenerife volcanic complex in Canary Islands (Villasante-Marcos et al., 2014).
The above statements mean that SP mappings on volcanoes allow one to detect both the state of a hydrothermal system, if any, and the current activity. Mount Pelée and Miyake-jima can be used as case studies for illustrating two opposite states of hydrothermal activity.
2.1.1 Mount Pelée in Martinique Island
Mount Pelée (Martinique Island) is an andesitic composite volcano culminating at 1397 m a.s.l. and belonging to the Lesser Antilles inner arc (14°47′N, 61°10′W) (Fig. 1a). Since the settlement of European communities in 1635, four eruptions have occurred. The 1792 and 1851 eruptions were moderate, with phreatic phases, while the last two eruptions (1902–1904 and 1929–1932) were magmatic, with the formation of domes (Vincent et al., 1989). The 1902 eruption killed 28,000 inhabitants. At present, neither geothermal field nor surface activity takes place on the volcano, except in a small area to the southwest corresponding to the remaining trace of vents of the 1792 and 1851 eruptions. Rare volcanic seismic events are recorded per year, and hydrothermal exchanges are limited to the infiltration of meteoric water (5 m/year).
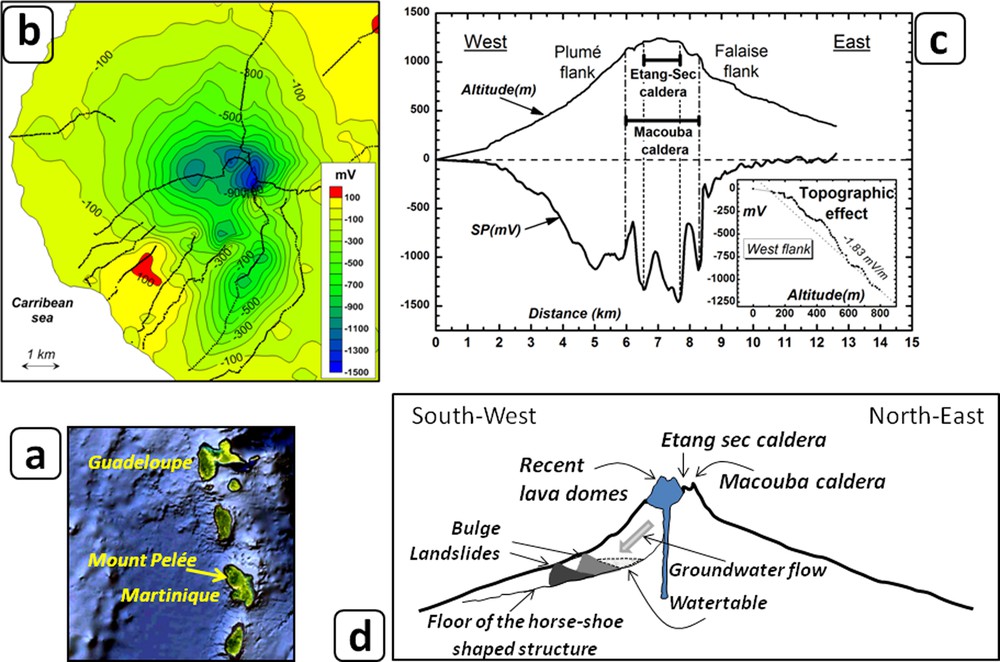
(Color online.). a: location of Mount Pelée in the Lesser Antilles arc; b: self-potential mapping; c: west–east cross-section of SP anomalies and topography passing through the volcano summit. The inset illustrates the linear negative relationship between SP values and altitude when downward ground fluid flow prevails; d: geophysical interpretation of SP anomalies and ground fluid flow.
After Zlotnicki et al. in press.
In 1991, SP measurements were performed with Pb–PbCl2 electrodes (Petiau and Dupis, 1980) every 50 m in average, along 70 km of profiles (Fig. 1b) (Zlotnicki et al., 1998). Potential reference was fixed on the shoreline. SP values decrease as the altitude increases and the minimum, –1500 mV, was reached at the top of the volcano, in agreement with the absence of a hydrothermal system. Negative linear relationships between potential difference values and altitude, called “topographic effect”, are observed along most of the radial profiles and express the simple gravitational infiltration of water through the edifice. The west–east cross-section evidences the addition of short wavelength SP anomalies related to structural boundaries characterizing calderas of Étang Sec and Macouba (Fig. 1b–d). In 1991, only a weak positive anomaly (< 200 mV) to the southwest was observed which coincided with the residual trace of vents of the 1792 and 1851 eruptions. Resulting information are that:
- (1) no active hydrothermal system was present;
- (2) no deep thermal fluxes were coming from depth;
- (3) as the whole, in 1991 the volcano was in a very quiet hydrothermally steady state.
2.1.2 Miyake-jima in Izu-Bonin Arc
Miyake-jima is a basaltic stratovolcano, 760 m high, located about 180 km south of Tokyo (Japan) (Fig. 2a). During the recent past, violent and short-time duration fissure eruptions took place almost every twenty years (1940, 1962, 1983) along the southwest and northeast axes, producing large scoria lava flows. At the opposite, on 8 July 2000, an eruption was preceded by two weeks of intense volcanic and tectonic seismic activity, followed by the collapse of the summit. During the eruption, the island was evacuated, with no possible return for more than five years due to large SO2 gas emission.
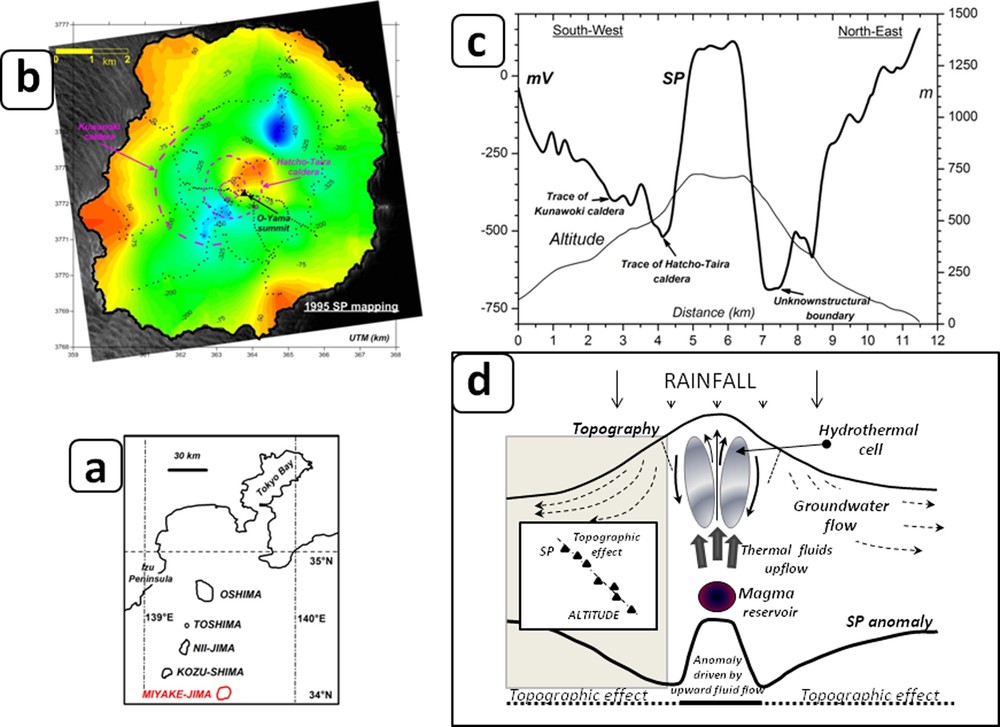
(Color online.). a: location of Miyake-jima Volcanic Island in Izu-Bonin arc (Japan); b: self-potential mapping; c: southwest–northeast cross-section of SP anomalies and topography passing through the volcano summit; d: geophysical interpretation of SP anomalies and ground fluid flow.
After Zlotnicki et al. in press.
Before 2000, although there was no large expression of surface activity on the summit (fumaroles, geysers, geothermal field), an active hydrothermal system was found at a depth of a few hundred meters below the summit by audiomagnetotelluric surveys (Utada et al., 1984; Zlotnicki et al., 2003). SP surveys were operated in 1991, 1995, and 1996, and a composite map based on 1995 and 1996 data was built (Fig. 2b) (Sasai et al., 1997). The general pattern is the following. Far from the central part of the volcano, SP values decrease as the altitude increases. It corresponds to the topographic effect observed on any volcano flank where only gravitational groundwater flows are present. But, in the vicinity of the summit, SP values begin to sharply increase with the altitude (Fig. 2b and c), and the highest values correspond to the trace of the most active part of the hydrothermal system. This general pattern is characteristic of Group III, for which hydrothermal activity can be in a quiet steady state (Fig. 2d). It takes birth in the interactions of rising magmatic fluids towards the ground surface and in the groundwater recharge brought by rainfalls, and/or other mechanisms, as sub-horizontal infiltration of seawater, and watersheds. Hydrothermal cells are produced at depths of some hundred meters to some kilometres, giving rise to positive SP anomalies on the summit and negative ones on the flanks where gravitational circulations prevail. As long as no disturbance perturbs the hydrothermal system, this expresses a constant level of thermal exchanges between magmatic fluids and the ground surface.
2.2 Time-varying large-scale SP anomalies related to volcanic activity
Besides the fact that SP mappings on volcanoes give information on the existence of hydrothermal systems describing their activity and size (Zlotnicki and Nishida, 2003; Zlotnicki et al., 1998), repeated SP surveys and mappings inform on the spatial and time evolution of hydrothermal activity, and on the structural alterations (i.e. opening of fissures). The time-varying large-scale SP anomalies related to volcanic activity can be illustrated by the renewal of hydrothermal activity on Miyake-jima during its activity in year 2000.
After 1995, Miyake-jima volcano was monitored by several electromagnetic methods (SP, total magnetic and telluric fields, DC resistivity measurements) (Sasai et al., 1997, 2001, 2002; Zlotnicki et al., 2003, 2009b). Volcanic seismicity started on 26 June 2000 at 18:30 LT, and was rapidly shifting from below the summit to the west of the Island and then to Kozu-shima Island (Fig. 2a). Thenceforth, the seismicity became of tectonic origin. The volcanic earthquakes came back underneath the volcano summit on 4 July. After 4 days of intense seismic activity, the summit collapsed, and a 1-km-diameter caldera was formed in less than 4 min on 8 July around 18:40 LT. At the opposite, most volcanoes on which SP anomalies grow up at the summit before an eruptive event (Hashimoto and Tanaka, 1995; Michel and Zlotnicki, 1998), the eruption of 8 July 2000 was preceded by SP anomalies basically located along the O-Ana crater rim surrounding the summit (Fig. 3). Let us describe this unanticipated behaviour, which is critical for understanding the unexpected dynamism of the eruption in 2000.
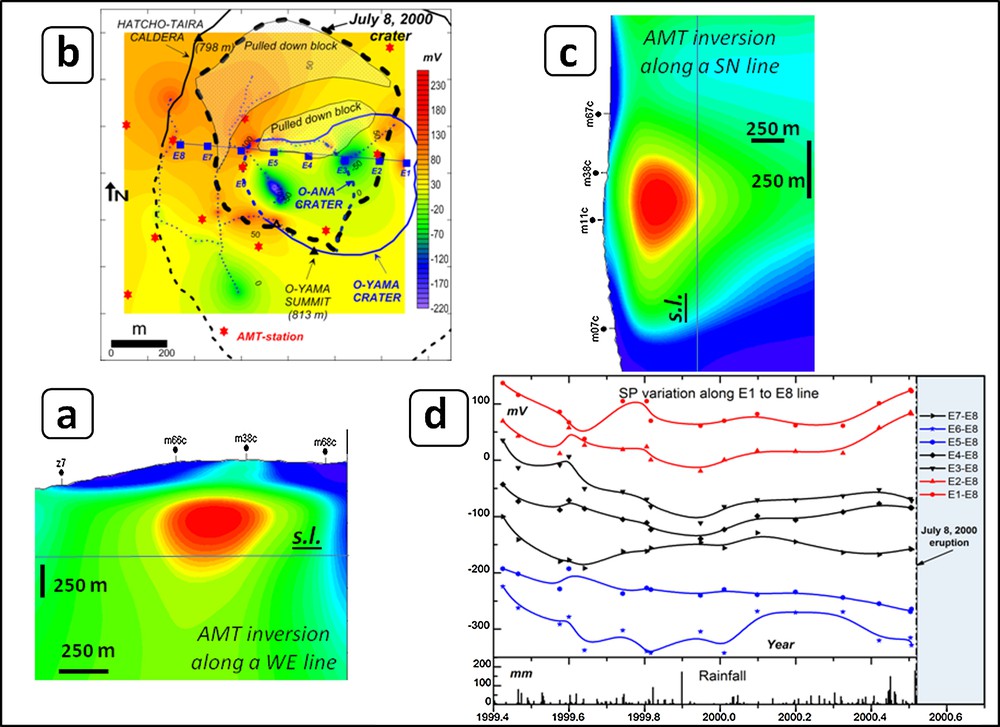
(Color online.). a: west–east cross-section of the 1D modeling inversion of audiomagnetotelluric soundings passing through the summit of Miyake-jima; b: SP mapping and schematic traces of craters and calderas. The heavy dashed line is the contour of the initial collapse of the summit after 8 July 2000. The two pull-down blocks induced by the initial collapse are materialized by light grey dots; c: south–north cross-section of the modeling of the 1D inversion of audiomagnetotelluric soundings passing through the summit of Miyake-jima; d: time evolution of the SP values between Ei (i = 1 to 7) and E8 electrodes from April 1999 to July 2000. The bottom inset shows daily rainfall.
The comparison between the SP surveys performed before 2000 and the one achieved on the summit on 4 July did not show any large-scale increase in hydrothermal activity with time, but rather small negative anomalies and a small size positive one beside the southern rim of O-Ana crater (Fig. 3b). A buried 1-km-long SP west–east line equipped with 8 non-polarisable electrodes gave more timely information (Fig. 3d). From May to December 1999, negative variations were increasing at the electrodes in the vicinity of O-Ana crater rims, while these negative anomalies turned into increasing positive ones in 2000 till the eruption occurrence. These SP changes were clearly circumscribed to the edges of O-Ana crater, right above the boundary limit of the superficial hydrothermal system detected previously by audiomagnetotelluric soundings (Fig. 3a and b) (Zlotnicki et al., 2003).
These observations favour the following interpretation. Confirmed by AMT and total magnetic field measurements (Sasai et al., 2002), the hydrothermal system was in a steady state till December 1999. Tens of years of rainfalls had penetrated into the volcano along the major lithologic discontinuities as craters rims, washing and lubricating them, and making them non-cohesive interfaces. After December 1999, a weak renewal of hydrothermal activity took place along O-Ana crater rims and accelerated after April 2000, while resistivity measurements showed that:
- (1) the electrical resistivity decreased at shallow depths;
- (2) increased at deeper depths (Zlotnicki et al., 2003, 2009b).
This opposite information could not be due to broad thermal fluxes coming from a magma source, but be the consequence of the opening of cracks at depth. Seismicity and gravimetric data clarified this observation in assuming the formation of a cavity during the drainage of magma outside the Island from 26 June to 4 July (Japan Meteorological Agency, 2000; Ueda et al., 2005). After 4 July, the strong volcanic seismicity came back under the volcano, released thermal fluids and destabilized the summit area corresponding to the trace of the hydrothermal system, provoking the formation of a caldera and a phreatic explosion on 8 July.
3 Ground-based observations of short-term electrical signals preceding eruptions
If geophysical ground surveys can be performed on volcanoes presenting a moderate activity, these methods cannot be secured when the activity enters a dynamical stage. Permanent, autonomous and as far as possible real-time monitoring networks must be used for detecting more finely the evolution of the activity. Precision of repeated SP surveys is on the order of several to tens of millivolts at a specific benchmark, while the resolution of a potential difference between two permanent electrodes can reach a few microvolts when recorded with a 24-bit data logger. Moreover, huge progress in electronics, mass memories, and more recently in speed of data transmission may allow one to install denser multi-parametric stations collecting data up to some hundreds of Hertz. The counterpart is that the huge amount of data cannot be processed manually and the development of algorithms of signal recognition is therefore required. For solving this issue, a cooperation with the Institute of Physics of the Earth of Moscow (http://www.gcras.ru/eng/?page_id=38) was developed and two algorithms: DRAS (Difference Recognition Algorithm for Signals) and FLARS (Fuzzy Logic Algorithm for Recognition of Signals) were applied to EM data (Bogoutdinov et al., 2007; Gvishiani et al., 2002).
Some examples will now be given.
3.1 The eruption of 9 March 1998 at La Fournaise volcano
These techniques were used on La Fournaise volcano for detecting electric signals prior to the 9 March 1998 eruption (Zlotnicki et al., 2001, 2005). At that time, the research telluric network was composed of five eight-channel stations, recording, among other parameters, the horizontal magnetic north–south and east–west components of the electric field at a sampling rate of 20 s. After a four-year period of rest, the volcano entered into eruption on 9 March 1998 at 15:05 LT after four days of sharp increase of seismicity (Fig. 4). Deformation signals appeared one day before the eruption (Battaglia and Bachelery, 2003). If the sharp and large electric signals, up to 2000 mV/km, related to the displacement of the magma and the opening of fissures at the front in the upper part of the cone were easy to visualize (Zlotnicki et al., 2001), pre-eruptive electric signals were definitively detected by the application of the above algorithms.
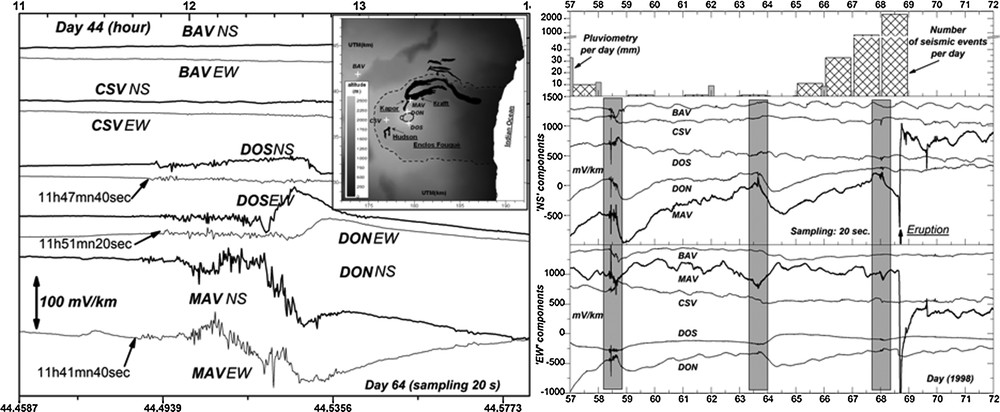
Twenty-seconds records of the NS and EW components of the electric field at different stations on La Fournaise volcano. Left: electric field recorded at the independent BAV, CSV, DOS, DON, and MAV stations on 13 February (day 44), 1998. The small inset shows the location of stations and eruptive centers associated with the eruption of 9 March 1998. Right: electric field recorded at BAV, CSV, DOS, DON, and MAV stations between 26 February (day 57) and 13 March (day 72) 1998; the eruption occurred on 9 March (day 68). Upper part: number of earthquakes per day and rainfall.
The algorithms begin with the building of rectification functionals (based on energy, length or zero crossing), and are independently applied on individual channels over an adapted running time window (there, 600 s). Well-characterized electrical signals of oscillating shape, between a few to a hundred of mV/km in amplitude, and of durations of up to a few hours, were found to appear at different and independent stations (Fig. 4), while no magnetic signals were recorded. These pre-eruptive electric signals appeared during the three weeks preceding the eruption, whereas deformation or seismicity had not yet been observed. No large rainfalls have occurred during these three weeks, and no degassing has never been measured on La Fournaise volcano. Therefore, it is reasonable to assume that transient oscillating electric signals are of electrokinetic origin. They could have been related to micro-fracturing phases along the major fissure systems where MAV, DOS and DON were located, i.e. where the magma migrated when it came out at the ground surface.
3.2 The eruption of 8 July 2000 at Miyake-jima volcano
In addition to EM surveys performed on Miyake-jima during the five years preceding the eruption of 2000 in the frame of a Japanese-French cooperation project, we have installed EM autonomous self-recording stations (Fig. 5a and b). Stations located on SW (MYS) and NE (MYN) fissural eruptive axes were recording the electric field, while the summit station (OYL) was recording both horizontal electric and magnetic fields components at 20-s intervals. Smooth seismicity started on 26 June at 18:30 LT. A dyke of south–west direction grew up below MYS and the ground deformation started at 21:00 LT (Japan Meteorological Agency, 2000; Ueda et al., 2005). Then, the dyke propagated outside the Island to the west, producing in the early morning of 27 June a small submarine eruption. Between 27 June and 4 July, dykes and large earthquakes continued to move northwestwards. Volcanic seismicity recovered on 4 July and the eruption started on 8 July at 18:40 LT.
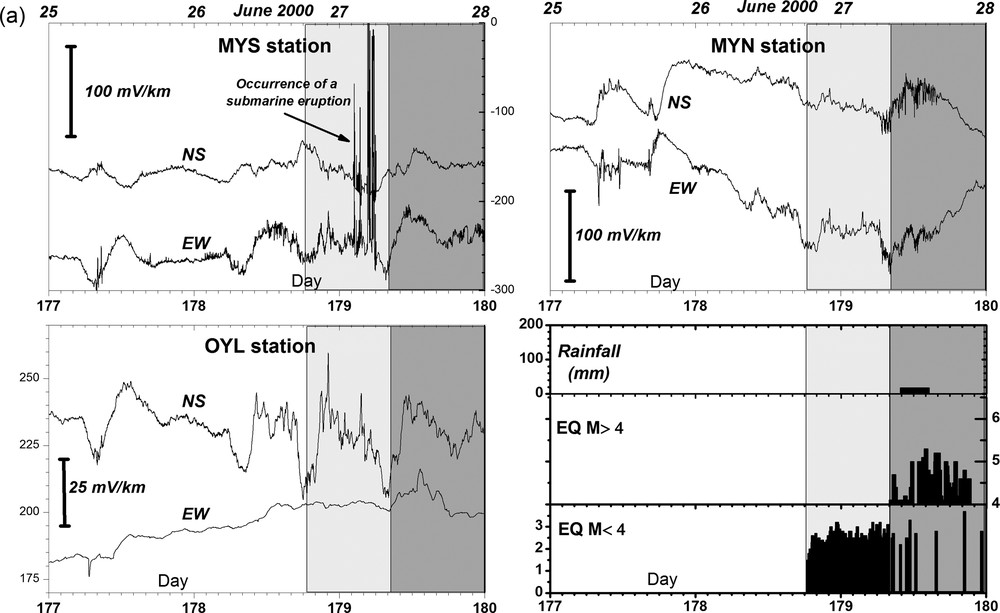
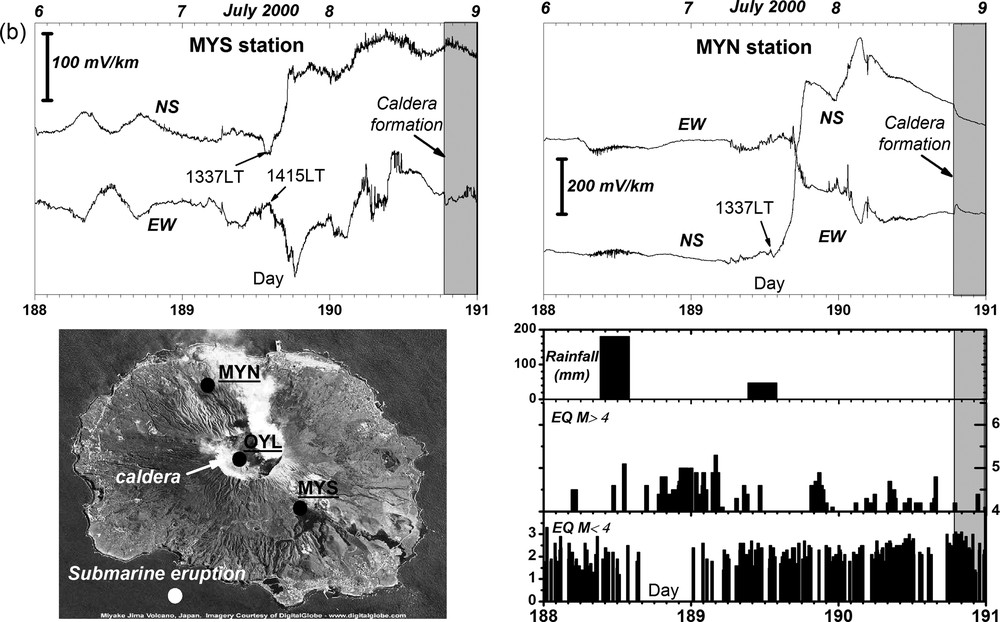
Twenty-seconds records of the NS and EW components of the electric field at Miyake-jima volcano. a: graphs of electric fields at MYS, MYN, and OYL stations between 25 and 28 June 2000, with corresponding daily rainfall, weak (M < 4) and strong (M > 4) seismicity (Japan Meteorological Agency); b: bottom left: satellite image from Digital Globe (www.digitalglobe.com) of Miyake-jima after the formation of the caldera, and location of the electric stations. Graphs of the electric fields at MYS and MYN stations between 6 and 9 July 2000, with corresponding daily rainfall, weak (M < 4) and strong (M > 4) seismicity (Japan Meteorological Agency).
Several features of the electric field at the stations can be outlined. Oscillations similar to those recorded on La Fournaise, up to 20 mV/km, appeared at MYS two days before the onset of seismicity (Fig. 5a). They increased continuously till about 02:30 LT on 27 June when sharp spikes of 175 mV/km in amplitude began. This sequence lasted during 2 h 30, and new oscillations reappeared. Oscillations were also observed at MYN after spikes at MYS had disappeared. In addition to electrical signals at MYS and MYN on 4 July related to the refocusing of seismicity below the volcano, both stations exhibited huge signals, several hours in duration, reaching more than 300 mV/km on 7 July (∼13:37 LT) and later (Fig. 5b). These signals diminished on 8 July before the summit collapse, for which signals did not attain 30 mV/km. Although this eruptive dynamism of summit collapse is rare, it again shows that electric signals may appear before ground deformation and seismicity.
On Miyake-jima volcano, the interpretation of electric observations could be related to the perturbation of groundwater channels along the southwest major eruptive axis on which MYS station was installed and beneath which the first dyke was born on June 26. It is credible that the appearance of spikes between 02:30 and 06:00 LT on 27 June gives the timing of the fracturing of the sea floor from which the small submarine eruption emerged on 27 June. On 7 July, the vacant space below the summit produced by magma drainage outside the island was already in place, as attested by gravity measurements (Furuya et al., 2001). Therefore, one can suspect that the large SP signals occurring before the eruption were related to the weakening of O-Ana crater walls and the transfer of large masses of groundwater inside the volcano.
Results on La Fournaise and Miyake-jima volcanoes seem to obey some general pattern when we compare these observations with those obtained on Taal volcano in the Philippines (Zlotnicki et al. in press). During the few weeks preceding an active process, short-term electric signals (of duration of less than a few hours and up to a few tens of mV/km) may appear. Progressively, these signals become more consistent, reducing the time delay between signals at different spots of a volcano when the dynamics of the activity is in course. These signals may come out before any noticeable ground deformation, and are generally amplified one or two days before the burst of activity. Finally, the burst of activity may produce a smaller signal when compared to those measured during the pre-activity period.
4 Satellite observations of short-term electrical signals preceding eruptions
Over the 550 active and dangerous volcanoes in the World, less that 1/5 are equipped with land networks able to detect an onset of volcanic activity. Thereby, it is noteworthy to prospect if satellites can be efficiently used in volcano monitoring, and in particular if the ionosphere and its electromagnetic content can be disturbed by volcanic activity. Such studies have not been intensely carried out, compared to those on tectonic earthquakes (Parrot, 2009). DEMETER satellite gave this opportunity. It was launched by the French National Spatial Agency (CNES) in June 2004, and was the first micro-satellite devoted to the study of the ionosphere and its perturbations caused by earthquakes and volcanoes. Magnetic and electric fields were recorded, as well as electronic and ionic temperatures and densities. Details on the mission can be found in a special issue of Planetary and Space Science (2006). The mission was voluntarily stopped in December 2010. The orbit was polar and circular, and the initial altitude of 710 km was reduced to 660 km after December 2005. Fourteen orbits were flown at a speed of 7 km/s every day, and the distance between consecutive orbits at the equator was 2860 km.
Because most transient EM fields signals take place during the few weeks preceding an eruptive event, we considered:
- (1) the records with a time window starting 60 days [–60 d] before and ending 15 days [+15 d] after the onset of surface activity (Zlotnicki et al., 2013);
- (2) the orbits for which distances between the satellite footprint on the ground and the future erupting volcano were less than 500 km (resp. 900 km) for the Volcanic Explosivity Index equal to 0 (resp. 1 and above; VEI, http://vulcan.wr.usgs.gov/News/MSH2004/VEI_information.pdf).
High latitudes above 50° were not considered due to high magnetic activity. About 12,000 orbits were analyzed. It should be emphasized that the interesting part of an orbit lasted only 136 and 244 s, based on the threshold distances and the satellite velocity. Moreover, the large shift in longitude between consecutive orbits made the search for long duration anomalies largely irrelevant.
Between August 2004 and December 2010, 136 eruptions have occurred on 73 volcanoes. In spite of the above inordinate limitations, 57 volcanoes gave rise to 269 anomalies in the ionosphere related to the occurrence of 89 eruptions (Zlotnicki et al., 2013). These anomalies were independent of the global Earth magnetic activity defined by Kp index (http://wdc.kugi.kyoto-u.ac.jp/kp/index.html). Five types of anomalies were recognized, but the two main ones were electrostatic disturbances (higher energetic electric field content between DC and about 250 Hz), and electromagnetic discharges (short-time electric and magnetic anomalies appearing up to 2 × 10⁴ Hz) (Fig. 6a). These two types were representative of 93% of the anomalies.
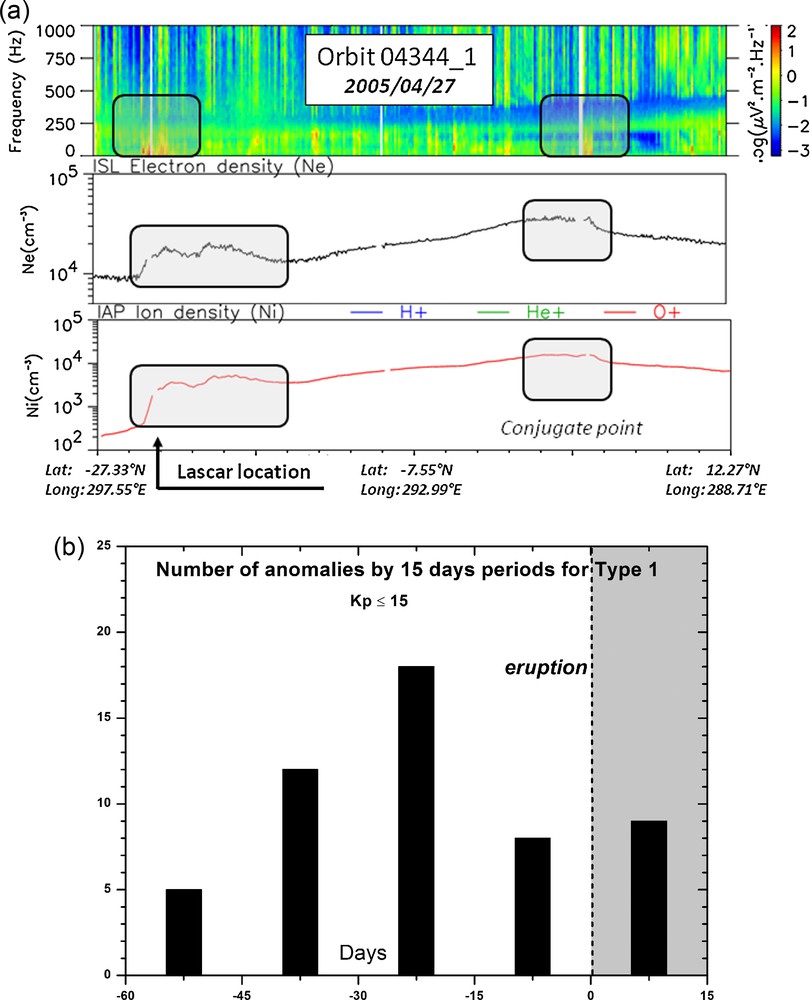
(Color online.). a: anomaly of type 1 observed above Lascar volcano 7 days before May 4, 2005 eruption. From top to bottom, Spectrogram of electric field, electron and ion densities; b: percentage of type 1 anomalies by 15 days periods between 60 days before the onset of eruptive activity and 15 days after; Magnetic Kp index is fixed to 15.
The most important observation is the distribution of anomalies with time. Let us consider the electrostatic disturbances and the distribution of anomalies per 15-day periods during the time window [–60 d, +15 d](Fig. 6b). Whatever the Kp value is, the maximum number of anomalies occurs between [–30 d, –15 d]. The number is decreasing when 15-day windows are more and more distant in time from the eruption. The decreasing rate reaches 72% for Kp equal to 15. This first result states that anomalies in the ionosphere essentially appear in the 60 days before an eruption and that the largest probability to detect them stands in the period [–30 d, –15 d]. The second most important result comes from the comparison between the average number of recorded anomalies per eruption and the VEI index over the 6.5 years of observations. The larger the strength of an eruption, the more anomalies in the ionosphere can be observed, from 2 to 5 anomalies in average for VEI going from 1 to 4 (Zlotnicki et al., 2013). In spite of the strong limitations brought by the scare records of a unique satellite over a specific volcano becoming active, the results are promising and future experiments using fleets of satellites would be able to detail these pioneering results.
5 Land-based and satellite electric signals: A link?
The preliminary statement is that, up to now, satellite observations are performed with a single satellite that flies over a target defined a posteriori during a very short-time span (less than a few minutes) and re-visits it the day after in the best case. Such a flying plan makes the satellite inefficient for tracking weak and progressive unrest of volcanoes. Only big-enough transient signals emerging from a background noise along an orbit can be successfully detected by one satellite.
One may now consider a schematic process of volcanic activity. An active volcano may present a long period of rest, followed by a slow awaking. During this period of time, which can last several centuries, the volcano is continuously submitted to many physical processes (Mc Nutt, 1996). Regional stress field, tides, thermo- and hydrodynamic processes, thermodynamic exchanges with a more or less deep magma body, hydrothermal activity, geochemical mineralizing processes, heat release, degassing of volatiles, and external inputs as rainfalls or even glaciers, slowly, but severely, weaken the mechanical cohesion of the materials forming the volcanic edifice, with a larger effect in the upper part where craters rims, faults, fissures, geothermal fields are present. This well-known period is called “fatigue stage” (Voight, 1989) and corresponds to a false quasi-static stage. It gradually enables the opening of 1–10-mm-long cracks along lithologic interfaces over several tens of meters in distance (Kilburn, 2003). This mechanism is amplified by large temperature exchanges, gas releases, and groundwater flows. When the eruptive process leading to surface activity begins due to a disruption in the volcano (new magma batch, crystallisation, dyke injection, etc.), physical processes accelerate and phenomena emerge from the background level as seismic activity, ground deformation, continuous EM signals, and large releases of heat and gas. This is the dynamical stage.
The false quasi-static or “fatigue” stage generally turns to the “dynamical stage” during the very few weeks preceding the onset of activity (Kilburn, 2003; McGuire and Kilburn, 1997; Menand and Tait, 2001). The transition period between the “fatigue” and the “dynamical” stages is characterized by erratic and non-uniformly distributed, short-time-duration gas releases, heat fluxes, changes in groundwater fluxes, and electric fields. It is during this very characteristic period that short-term transient anomalies in the ionosphere are recorded, while self-organized land signals appear and increase till the onset of activity. This assumption is in agreement with the description of the centennial October 2010 Merapi volcano crisis in Indonesia, for which anomalies in the ionosphere first appeared at the transition between the two stages and were mostly due to large emissions of SO2 in the upper atmosphere (Zlotnicki et al., 2013).
Although the number of examples of electric signals recorded at the ground before a volcanic burst in a multi-disciplinary context is relatively small, one can assert that electric signals may appear before ground deformation and seismicity. It is most likely similar for ionospheric anomalies related to volcanic activities. Therefore, it seems that only two main mechanisms could be at the origin of transient electric signals appearing a few weeks before an eruption; one is the appearance of electric signals due to a modification of groundwater circulation through fissures, and the other is the release of transient thermal fluxes and gases. But, till now, the transfer of on-land perturbations to the ionosphere or the genesis of induced anomalies in the ionosphere through some coupling mechanism are still in debate (Pulinets and Ouzounov, 2011; Sorokin and Hayakawa, 2013).
6 Conclusion
Self-potential method and more generally electric field measurements on volcanoes encompass a large panel of powerful techniques that give valuable information more specifically on hydrothermal systems and their activity. The measurement of SP anomalies can generally be performed everywhere easily, allowing one to rapidly detect and locate superficial faults, groundwaters, geothermal areas, and interfaces between different geologic structures. Steady state anomalies can reach hundreds of millivolts, compared to the several millivolts resolution of the method. This can be repeated on benchmarks set along particular profiles, and temporary anomalies of some tens of millivolts can be identified and be associated with the evolution of the activity. Mapping the distribution of SP anomalies at the scale of a volcano requires consistent and redundant surveys with closed loops in order to check the zero total change potential along these circuits. The error should be reduced to some tens of millivolts. The distance between measurements can become as small as 10 m depending on the scale of the encountered anomalies. The distribution of negative and positive anomalies versus a relative zero potential reference undoubtedly informs on:
- (1) the possible presence of an hydrothermal system;
- (2) the state of activity;
- (3) the geological interfaces driving groundwater flows (Aizawa et al., 2005; Bolos et al., 2014; Brothelande et al., 2014; Finizola et al., 2002; Hase et al., 2005; Hashimoto and Tanaka, 1995; Lénat, 1987; Michel and Zlotnicki, 1998; Sasai et al., 1997; Zlotnicki and Nishida, 2003; Zlotnicki et al., 1998, 2001, 2009a).
The reiteration of SP maps from which seasonal effects have been removed illustrates the large-scale time evolution of activity, as on Soufrière of Guadeloupe after 1992 (Brothelande et al., 2014; Zlotnicki et al., 2006) and La Fournaise between 1981 and 1992 (Michel and Zlotnicki, 1998; Zlotnicki et al., 2001).
These mapping techniques cannot be used when the level of activity increases. Real-time monitoring networks become unavoidable. When they are properly located with respect to nearby local discontinuities, electric stations are very sensitive to any change in the activity of a volcano, but also to large rainfalls infiltrating the interfaces. Anomalies of amplitudes of a few microvolts and of durations of several seconds should be detectable in order to identify the small series of signals that irregularly appear during the weeks preceding an eruption. These signals become more and more consistent between the different stations as the forthcoming activity is approaching. These signals may last some hours during the days preceding a large activity. Moreover, their distribution seems to depend on the location of the burst of activity (La Fournaise, Miyake-jima, Taal). During the last few weeks preceding a crisis, larger signals, from some hundreds of mV/km to almost 2000 mV/km, may appear and drastically reflect the alteration of the opening fissures and the changes induced in the groundwater flow. It is generally the premise of the occurrence of a large volcanic activity. On the opposite, the onset of the activity itself can be outlined by only small signals (some tens of mV/km), as it happened during the summit collapse of Miyake-jima on 8 July 2000.
Electric field anomalies in the ionosphere may also appear prior to volcanic activity. The most important observation is that the maximum number of anomalies appears in the time window between 30 and 15 days before an eruption. This would correspond to the transition period between the long false quasi-static period of “fatigue stage” and the “dynamical stage” that announces accelerating and irreversible processes (Kilburn, 2003; McGuire and Kilburn, 1997; Menand and Tait, 2001). If these results were confirmed by following satellite missions, it would become a major contribution to monitoring eruptions on these volcanoes that generate anomalies in the ionosphere.
Combining on-land and satellite observations, it appears that electric signals are prominent during the same interval of time. At that point, seismic and ground deformation may not yet have appeared. Therefore, only gas release, thermal flux, and electric field changes driven by perturbations in the groundwater flow may occur and be the primary source of anomalies in the ionosphere. Future studies should clarify if the on-land signals propagate to the ionosphere or if they induce a secondary mechanism in the atmosphere that is able to relay anomaly on the on-land anomaly to the ionosphere.
Acknowledgments
This is an invited contribution to the thematic issue “Invited contributions of 2014 Geoscience laureates of the French Academy of Sciences”. It has been reviewed by Jean-Louis Le Mouël and Editor Vincent Courtillot. This paper is the outgrowth of many studies performed on different volcanoes in the frame of many cooperation projects. Without unswerving contributions of many researchers, engineers and students, such prospective work could not have seen the light. Among all of them, I would like to deeply thank J.-L. Le Mouël Y. Sasai, M.J. Johnston, A. Gvishiani, P. Yvetot, F. Fauquet, G. Vargemezis, S. Bogoutdinov, F. Bruère, J.-F. Delarue, A. Mille, T. Hashimoto, H. Hase, and S. Agayan. This work has been supported by the French Academy of Sciences.