

1 Introduction
Understanding the assemblage of basic grains is essential for predicting many soil properties (Bruand and Tessier, 2000; Coulon and Bruand, 1989; Lamotte et al., 1997a, b) and many studies have been conducted with grain mixtures varying in size distribution and mineralogy (e.g. Basile and d’Urso, 1997; Fiès and Bruand, 1990, 1998).
For decades, direct analysis of the assemblage of basic grains has been limited to 2D images of the assemblage taken with light and scanning electron microscopy. Recent developments of X-ray tomography have provided the possibility of starting 3D analysis of the assemblage of basic grains, but early images of the soil matrix remained limited by low resolution (Taina et al., 2008). Thus, X-ray tomography analysis of the elementary grain assemblage has long been limited to determine the attenuation of X-rays through the soil without the possibility of separating basic grains from the voids resulting from their assemblage. Recently, Schrader et al. (2007) studied by using X-ray tomography the differentiation of the assemblage of elementary particles around earthworm burrows but since the volume of the basic voxel was 3 × 0.39 × 0.39 mm3, the basic particles were not separated. With a much higher resolution of about 100 μm, Macedo et al. (1998) studied thin layers of soil clods but their discussion was also restricted to the variation of X-ray attenuation without the possibility of separating the solid phase and the related voids at the scale of the basic grains. Viggiani et al. (2004) studied deformation in fine-grained geomaterials under triaxal compression with a resolution of 14 μm and showed the development of cracks in the course of deformation. Because of both the fine texture and 14 μm resolution, they were not able to study the assemblage of basic particles. Using high-resolution computed tomography whose volume of voxels was 14.8 × 13.5 × 13.5 μm3, Lee et al. (2008) examined the size distribution of voids ranging from 103 to 109 μm3 in volume within seals of a silt loam soil. Although the silt grains were recognisable on the images, their outlines and more generally the solid phase distribution, were highly fuzzy. Papadopoulos et al. (2009) used computed X-ray microtomography with a resolution of 8 μm to investigate the effects of organic and conventional management on soil aggregate stability and showed that intra-aggregate porosity would not affect stability. Peth et al. (2008) studied intra-aggregate porosity using X-ray synchrotron microtomography with a voxel volume of 3.2 × 3.2 × 3.2 μm3 or 5.4 × 5.4 × 5.4 μm3. The voids analysed were partly those resulting from the assemblage of the silt and sand grains with a clay phase, but resolution restricted their study. Sleutel et al. (2008) compared nano- and microfocus X-ray computed tomography for the visualisation of soil microstructure and soil organic matter. They discussed the void size distribution for equivalent diameters down to 1.7 μm but the analysis of void geometry remained limited. Gelard (2005) studied sand-clay mixtures with a clay content ranging from 5 to 25% using X-ray synchrotron microtomography with a resolution of 1.4 μm but the study of the 3D geometry of the voids was mainly limited to its skeletonization. Using microfocus X-ray tube computerized tomography, Tippkötter et al. (2009) reported a resolution down to 1 μm and investigated the presence of water in the macrovoids of undisturbed soils but did not study the voids related to the assemblage of the basic grains. Finally, Thieme et al. (2003) used nanotomography based on X-ray microscopy images with a resolution of about 0.045 μm in order to examine the microhabitat of bacteria and soil colloids. Their study was limited to colloidal flocculates extracted from soils and only 6 μm in size.
The objective of this study was to examine how X-ray synchrotron microtomography can lead to a better description of the void geometry resulting from the assemblage of the clay phase with silt grains. The resulting porosity was examined for a silt-clay mixture with 20% clay and the results show how X-ray microtomography provides new information on the 3-D assemblage of basic grains and resulting void geometry in soils which are usually discussed using data provided by indirect methods such as mercury intrusion curves, gas adsorption-desorption isotherms, and shrinkage curves (e.g. Braudeau and Bruand, 1993; Bruand and Prost, 1987; Bruand and Tessier, 2000; Nowamooz and Masrouri, 2010; Santos et al., 2011).
2 Material and methods
2.1 Sample preparation
The silt (10–50 μm) and clay (< 2 μm) fractions used in this study originated from the B horizon of a fine loamy, mixed, mesic, typic eutrochrept (Ould Mohamed et al., 1997). They were extracted from a suspension of the soil obtained by mechanical shaking in water (Attou et al., 1998). The silt fraction was air-dried and the clay suspension was centrifuged to obtain a slurry of 0.7 g of water per gram of oven-dried clay (Attou et al., 1998). The clay fraction was primarily interlayered illite-smectite and secondary kaolinite, quartz and secondarily feldspars (Attou and Bruand, 1998). A soil material corresponding to a silt-clay mixture was obtained with 20% clay by manually mixing the clay paste and silt particles with a spatula. A clay content of 20% was chosen based on the high frequency of this clay content in loamy soils (Fiès and Bruand, 1990, 1998). The silt-clay mixture was placed in plastic rings 4 cm in diameter and 1 cm high, then equilibrated with a 10 hPa matric water potential using a pressure plate apparatus and finally air-dried (Attou et al., 1998).
After air-drying, the soil material was impregnated with a polyester resin as described by Bruand et al. (1996). A 700 μm thick section was prepared by grinding the resulting impregnated soil material. A sample in the shape of a matchstick 10,000 × 700 × 700 μm3 was prepared by cutting the 700 μm thick section with a diamond saw. It was then ground manually with sandpaper to blunt the edges and thus to obtain practically a cylindrical sample 700 μm in diameter and 10,000 μm high. Because of the high homogeneity of the soil material obtained (Attou et al., 1998), the prepared matchstick 10,000 × 700 × 700 μm3 in volume was considered as representative of the studied soil material.
2.2 Image acquisition
An image recorded by X-ray synchrotron microtomography was collected at 12 keV on the MS-X04SA-Tomo beam line of the Swiss Light Sources (http://sls.web.psi.ch/, Stampanoni et al., 2002). The cylindrical sample 700 μm in diameter was mounted on a vertical rotator on a goniometric cradle. Using successive rotations of the sample, 1500 projections corresponding to 1500 angular positions ranging from 0° to 180° were acquired by a 1024 × 1024 pixel digital camera. The outstanding quality of the beams enabled acquisition of images with a pixel resolution of 0.7 μm. The 700 μm diameter of the sample enabled to remain inside the field of view of the detector regardless of the angular position of the sample and thus to avoid reconstruction artefacts.
Acquisition required 120 min. A filtered back-projection algorithm was used to reconstruct horizontal slices 0.7 μm thick from the projections. These slices were apposed together to produce a 3D volume. Every pixel originating from a tomographic slice corresponds to a 0.7 × 0.7 × 0.7 μm3 voxel of the 3D image. The size of the entire dataset corresponding to a single 3D image was 1 Gigabyte (10243 voxels). Each voxel was characterised by its grey level which ranged from 0 to 255 for an 8-bit image, depending on the X-ray attenuation coefficient of the element. Thus, voids were rather dark and the solid phase was grey or white depending on its chemical composition (Fig. 1). The 3D visualisation of the solid and void phases was then possible at the scale of the assemblage of the basic grains thus enabling both the silt grains and clay phase together and the voids resulting from their assemblage to be visualised.

2D greyscale image of the soil material corresponding to a cross section of the 3D image recorded by X-ray synchrotron microtomography (radius = 400 pixels, i.e. 280 μm). Silt grains are in light grey and white, clay bridges and coating in light grey and voids in dark grey.
Image 2D en niveaux de gris du matériau de sol correspondant à un plan transversal de l’image 3D enregistrée en microtomographie RX à l’aide d’un synchrotron (rayon = 400 pixels, i.e. 280 μm). Les grains de limon sont gris clair et blancs, les ponts et revêtements d’argile sont gris clair et les vides gris foncé.
2.3 Image segmentation
Image quantification requires proper segmentation of the solid and void phases. Although the images were well contrasted and the histogram was composed of two principal grey level domains, a direct threshold of the raw image was not sufficient to separate the voids and the solid particles (Fig. 2). This was related to the presence of noise that restricted the selection of a grey level as the limit between the solid and void phases. Thus, after histogram equalisation (Acharya and Ray, 2005; Russ, 2002) to enhance their contrast, the signal-to-noise ratio (SNR) of the 8-bit images produced by the back-projection algorithm implemented at the SLS was 3.67. The SNR of an image is defined here as the ratio of its mean value to its standard deviation (Bushberg et al., 2006). Despite the two peaks associated with the grey values of the objects and the background being visible, noise still prevented correct segmentation (Fig. 2). After the application of a 3D mean filter with a kernel of 3 × 3 × 3 voxels, the SNR reached 4.52. An optimum thresholding value of 112 was obtained using the classical method of Otsu (Otsu, 1979), which minimises the intra-class variance of the two populations of voxels. Comparison of ten segmented 2D images located approximately regularly along the 3D image with their respective raw 2D images showed that segmentation could be considered as satisfactory (Fig. 3). In the solid phase, however, it was not possible to separate silt grains and the clay phase forming the bridges and partially coating the silt grains.
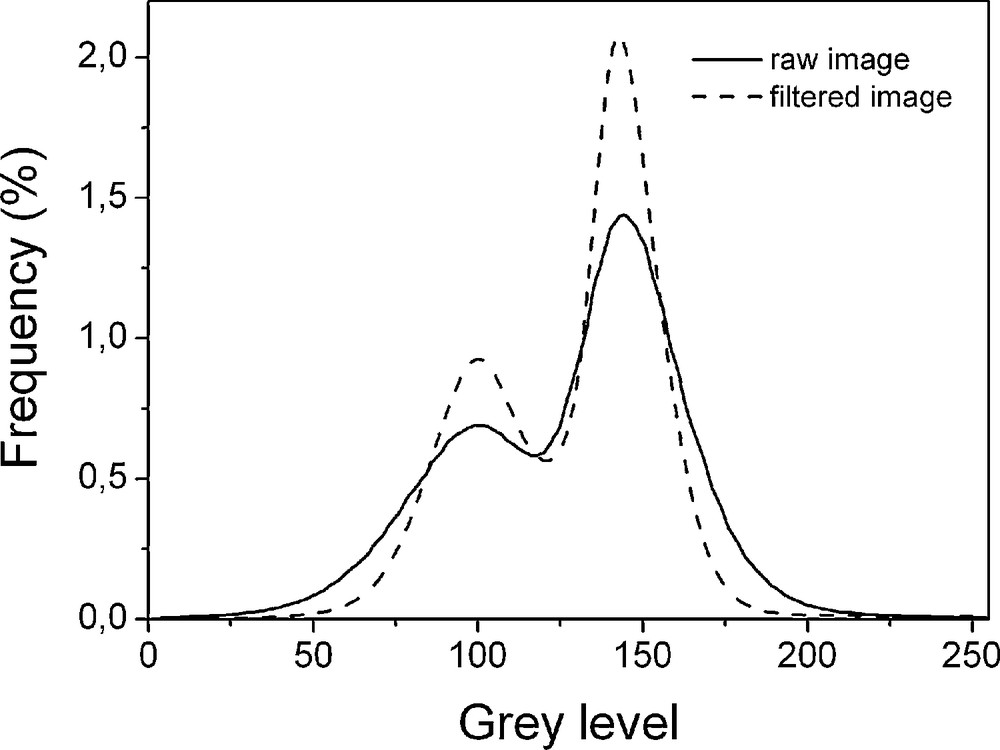
Greylevel distribution corresponding to the 3D image recorded for the studied soil material.
Distribution des niveaux de gris correspondant à l’image 3D enregistrée pour le matériau de sol étudié.
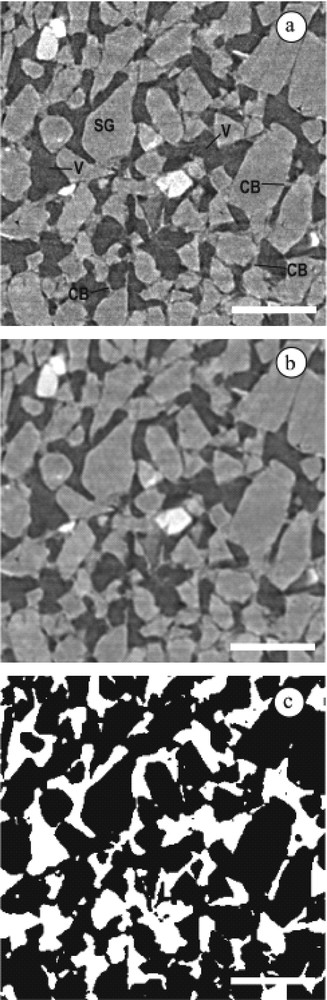
2D greyscale image (280 × 280 pixels; bar length = 20 μm) extracted from the image shown in Fig. 1 and showing the voids (V), the clays bridges (CB) between the silt grains (SG) (a), the corresponding filtered (b) and binary image (c).
Image 2D en niveaux de gris (280 × 280 pixels ; longueur de l’échelle = 20 μm) extraite de l’image présentée Fig. 1 et montrant les vides (V), les ponts d’argile (CB) entre les grains de limon (SG) (a), l’image correspondante filtrée (b) et binaire (c).
The 3D segmented image recorded with the algorithms developed by Le Trong et al. (2008) was visualized by using VG-Studio software (http://www.volumegraphics.com/). It corresponded to the largest volume extractable from the 3D image obtained in grey levels. It had the shape of rod 588 μm in diameter and 716.8 μm high, i.e. 840 pixels in diameter and 1024 pixels in height, thus corresponding to a total of 5.7 × 10⁸ voxels. This 3D rod-shaped volume was used to analyse the distribution of the solid and void phases in the sample.
2.4 Image analysis
The autocorrelation function, a spatial dependency of a porous medium (Cousin et al., 1996; Levitz and Tchoubar, 1992; Rozenbaum et al., 2007), can be interpreted as the probability of finding two randomly selected points that are both in the same phase. Let be the position vector from an arbitrary origin and a density function defined as:
| (1) |
| (2) |
| (3) |
| (4) |
| (5) |
Another characteristic length scale is the correlation length (L), defined as the integral of the autocorrelation function and represents a length scale characteristic of the spatial structure (Ioannidis et al., 1996):
| (6) |
For anisotropic materials, Lx, Ly and Lz are defined according to RZx, RZy and RZz.
Chord distributions are stereological tools used to describe the interface between void and solid phases (Rozenbaum et al., 2007). Chord distribution gives the probability to have a chord length between r and r+dr. Chord distribution can be calculated either for voids (fv(r) is called the void chord distribution) or for solids (fs(r) is called the solid chord distribution). Furthermore, the first moment of fv(r) (called lv) and the first moment of fs(r) (called ls) are defined as:
| (7) |
| (8) |
The values of lv and ls can be used as estimators of the mean size of the void and solid phases.
Finally, topology of the voids can be analyzed for the 3D image of the void distribution. The Hoshen-Kopelman algorithm (6-connectivity) was used to label each void with a unique number (Hoshen and Kopelman, 1976). It is a simple and efficient cluster identification algorithm enabling identification of connected clusters on a lattice (Stauffer and Aharony, 1992). We determined the number of voxels for each cluster and the basic topological properties that are: the number of isolated voids (N), the number of redundant connections (C) within the void space and the number of completely enclosed cavities (H) (Vogel et al., 2002). In other words, C represents the number of bonds that can be removed without creating an additional isolated cluster. The Euler-Poincaré characteristic ɛV was then computed as:
| (9) |
| (10) |
Thus, the specific Euler-Poincaré number can be considered as a measure of connectivity; the higher this number, the less connectivity would be expected.
For all the characteristics (porosity, Euler-Poincaré number, chord length distributions) presented here, a 3D mask (cylinder with a given radius and a given height or parallelogram) was applied on the 3D image. Hence, each voxel exterior to this mask was ignored. In other word, considering a void cut by the mask, only the part of the void inside the mask was taken into account for the calculated characteristic. This bit of void could be: (i) isolated if totally surrounded by grains (in fact demarcated by the grains and by the mask); or (ii) connected to other voids located deeper within the mask (and then connected). Note that these voids cut by the mask were not considered as interconnected by the exterior of the mask. They could be connected only if a path (inside the mask) constituted of voids linked them. This is obviously respectively the same for a grain.
An error is necessarily made and obliges to take the biggest volume as possible to minimize this artifact (notion of REV).
3 Results and discussion
3.1 Morphology of the assemblage
The 2D images in grey levels extracted from the 3D image showed a close packing of the silt grains and the presence of bridges between them (Fig. 3a). These bridges are 5–20 μm long and 2–5 μm thick and correspond to the bridges composed of clay particles shown by Attou et al. (1998) on backscattered electron scanning images. These bridges are responsible for the hardness increase of soils in the field when they dry (Attou et al., 1998; Lamotte et al., 1997a, b). The voids between silt grains were described as lacunar voids by Fiès and Bruand (1998) because they are not filled by the clay phase. According to the results of Attou et al. (1998) which were recorded by using mercury porosimetry, they are mainly accessible to void necks with equivalent void diameters ranging from 0.5 to 5 μm.
After segmentation, the 2D tomographic images clearly showed the 2D geometry of voids (Fig. 3b, c). Accurate comparison of the solid phase distribution on 2D grey scale images (Fig. 3a), their corresponding 2D filtered images (Fig. 3b) and finally binary 2D images (Fig. 3c), showed that the clay bridges 2–5 μm thick are still present on the 3D binary images after image segmentation. The segmented reconstructed images of the void and solid phases corresponding each to a cylinder 294 μm in radius and 717 μm long are shown on Fig. 4. The 3D-distribution of the solid and void phases in the studied soil material can be seen more easily on smaller cubic 3D-images 200 × 200 × 200 voxel cubes (i.e. 140 × 140 × 140 μm3) in volume, as shown in Fig. 5.
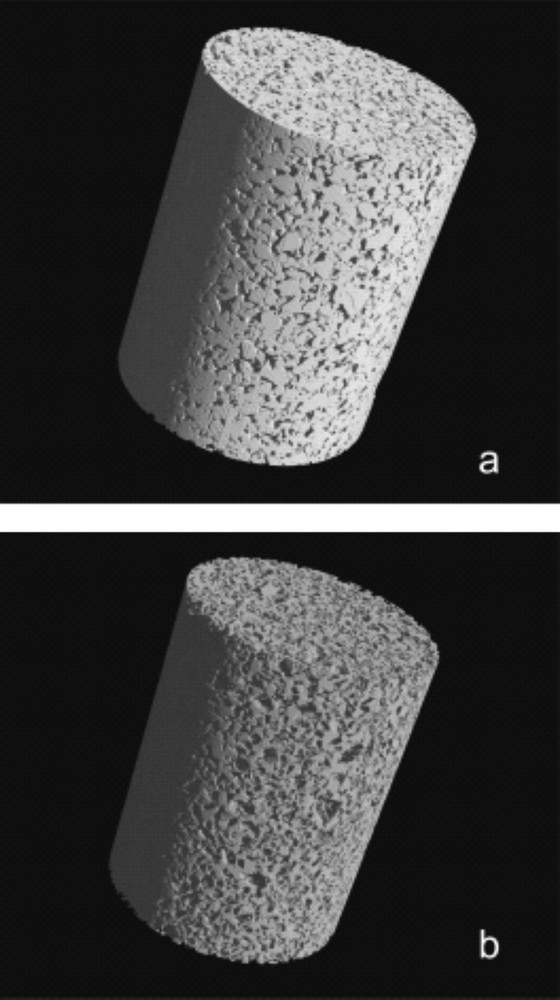
3D binary image (radius = 420 pixels, height = 1024 pixels) of the studied soil material (a: visualisation of the solid phase and b: void phase).
Image binaire 3D (rayon = 420 pixels, hauteur = 1024 pixels) du matériau de sol étudié (a : visualisation de la phase solide et b : de la phase vide).
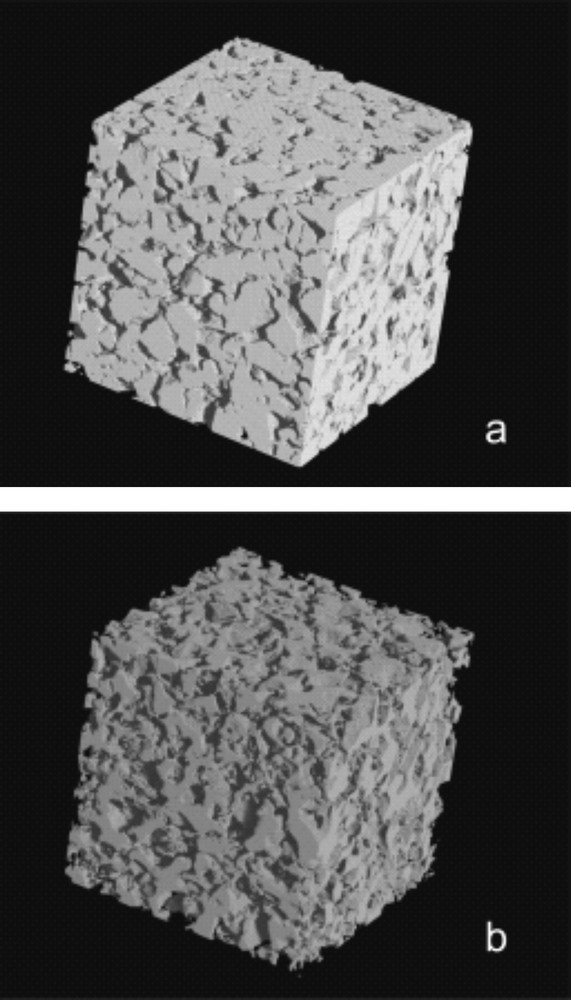
3D binary image (200 × 200 × 200 voxels) of the studied soil material (a: visualisation of the solid phase and b: void phase).
Image binaire 3D (200 × 200 × 200 voxels) du matériau de sol étudié (a : visualisation de la phase solide et b : de la phase vide).
Detailed observation of the void morphology enabled identification of the voids which correspond to the elementary lacunar voids described by Attou et al. (1998) in the same soil material and more widely in soils by Fiès and Bruand (1998). However, 3D-images showed that the lacunar voids are far from the roughly ovoid voids resulting from the packing of the silt particles with the clay phase and networked thanks to void necks as earlier indicated by both 2D backscattered scanning electron images and mercury porosimetry (Attou et al., 1998, Fiès and Bruand, 1998). Indeed, morphological observation of the connections of the elementary lacunar voids with the surrounding elementary lacunar voids showed a much more continuous void size distribution than in a lacunar void as usually described (Fiès and Bruand, 1998) (Fig. 6).
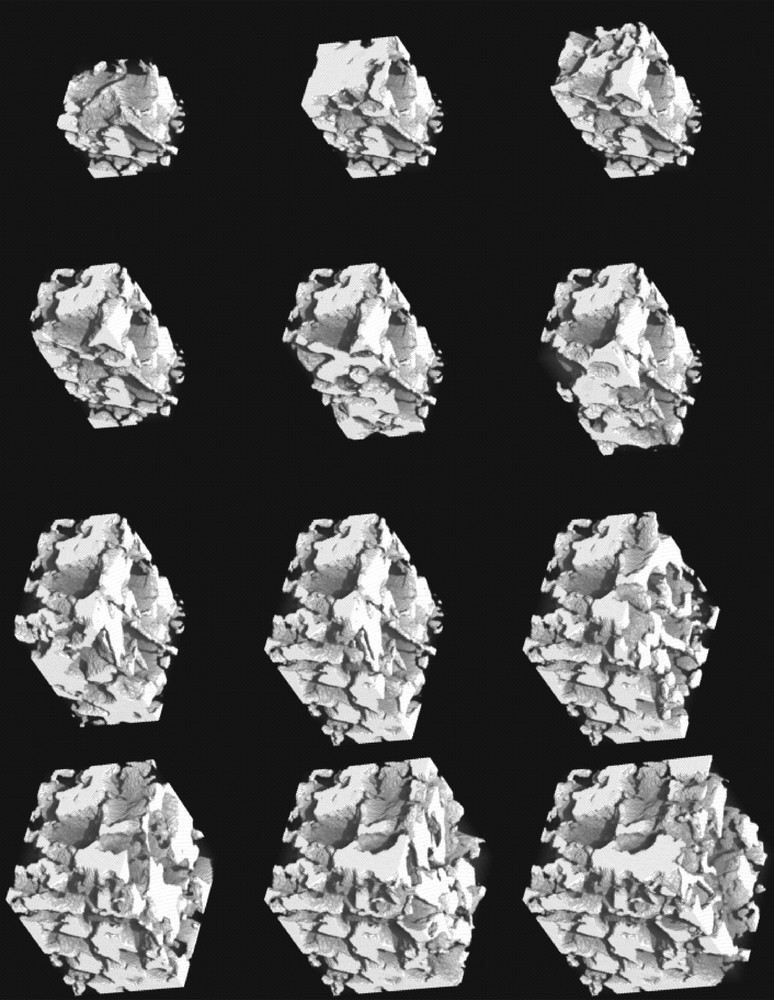
Successive 3D images showing a single lacunar pore (void shown as solid, left top corner, 70 × 70 × 60 voxels) and then its local surrounding environment by adding successively lateral connected lacunar pores up to a 3D image 120 × 120 × 120 voxels in size (right bottom corner).
Images 3D successives montrant un pore lacunaire isolé (phase vide représentée sous la forme de solide, image en haut à gauche, 70 × 70 × 60 voxels) et son environnement local en ajoutant successivement les pores lacunaires latéraux, connectés jusqu’à une image 3D de 120 × 120 × 120 voxels de taille (image en bas à droite).
3.2 Porosity
We computed ϕ for 3D cubic image sizes ranging from 79 × 102 to 50 × 107 voxels (Fig. 7). For a given cubic image size, the porosity was computed, the volume of measure was shifted (non overlapping cubes) and the porosity was computed again. This was repeated until the cubic image size scanned the whole image. For the smallest 3D image size, ϕ varied considerably and thus converged toward a limit when the 3D image size increased. This limit was reached when the 3D image size was about 107 voxels (343 × 105 μm3). This image size can be considered as the representative elementary volume to investigate porosity for the studied material, the representative elementary volume being the sample volume over which the porosity can be considered as a constant.
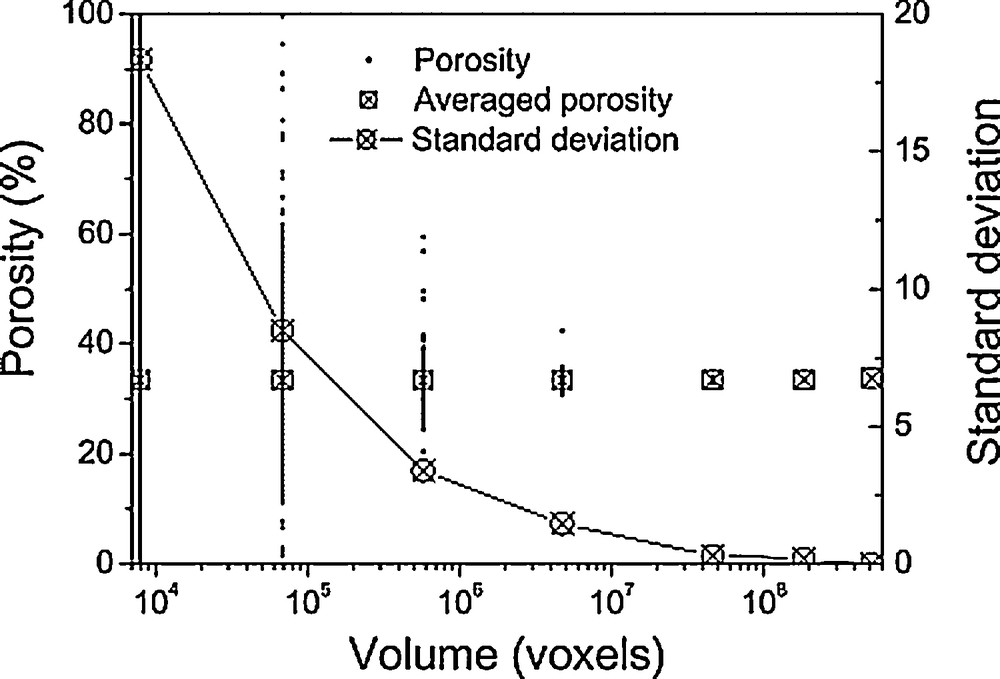
Porosity, averaged porosity and standard deviation according to the size of the 3D region of interest in the entire 3D image.
Porosité, porosité moyenne et écart-type en fonction de la taille de la région d’intérêt 3D dans l’ensemble de l’image 3D.
Porosity computed for the studied entire rod volume was 0.337 (Table 1) and smaller than the porosity determined using bulk density measurements (0.359) by Attou and Bruand (1998) on the same soil material. This difference was related to voids resulting from the assemblage of the clay particles within clay coatings and bridges (Fiès and Bruand, 1998) and not taken into account in image analysis because they were smaller than the voxel size (0.7 × 0.7 × 0.7 μm3). The porosity determined by 3D-image analysis in this study (i.e. 0.337) corresponded actually to the voids between the silt grains and described as lacunar voids by Fiès and Bruand (1998) and was similar to its value determined by using mercury porosimetry (0.335) by Attou and Bruand (1998) on the same material.
Caractéristiques du matériau limono-argileux étudié, obtenues par analyse de l’image 3D : lv et ls, premier moment de la distribution de corde enregistrée pour les phases vide et solide, respectivement ; L, longueur de corrélation, χv, nombre spécifique d’Euler-Poincaré.
| Porosity | lv (μm) | ls (μm) | L (μm) | χv (mm−3) |
| 0.337 | 6.9 | 13.4 | 4.4 | –76,792 |
3.3 Void geometry
The autocorrelation functions Rzx, Rzy and Rzz and the average value Rz recorded showed a decreasing behaviour without any oscillation, corresponding to a non-correlated medium (Fig. 8). In addition, no particular disparity was observed on the images for the one-dimensional autocorrelation functions along the orthogonal x-, y-, z-directions (confirmed by the correlation lengths: L≈Lx≈Ly≈Lz). Thus, the studied soil material (Fig. 7a) can be considered as an isotropic material which is consistent with the method used to prepare it. The opportunity to discuss the anisotropy along particular directions across the basic grains assemblage should enable the study of how soil processes affect porosity at the scale of these basic grains.
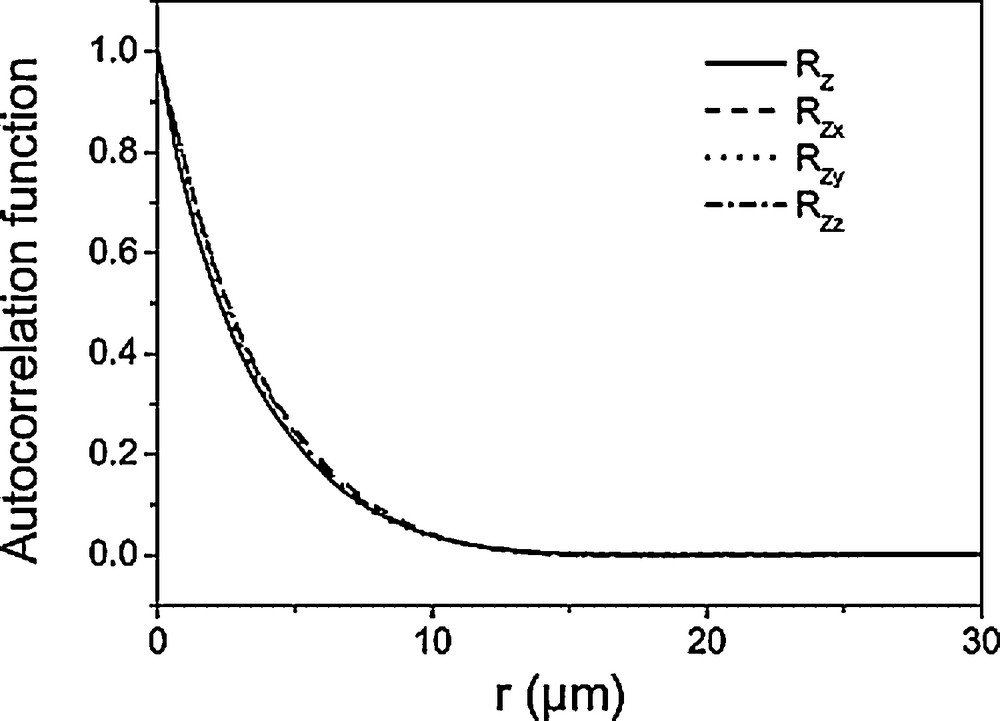
Autocorrelation functions recorded for the studied soil material.
Fonctions d’autocorrélation enregistrée pour le matériau de sol étudié.
Due to digitising, the smallest voids (or solids) described were poorly defined and did not correspond to real objects. Thus, for chord lengths (r) such as r < 3 pixels, chord distributions exhibited a linear increase that had no basis in reality and thus did not have to be taken into account (Levitz and Tchoubar, 1992; Rozenbaum et al., 2007). As shown in Fig. 9, void and solid chord distributions exhibited an exponential decrease. This type of porous medium, in which both the void and solid chord distributions are exponential, is called a long-range random medium (Debye et al., 1957; Levitz and Tchoubar, 1992). Thus, the void and solid phases in the image were randomly distributed for chord length ranging from 3 to 80 μm and from 3 to 120 μm, respectively (Fig. 9). The lack of longer chords within the 3D image 588 μm in diameter and 716.8 μm high indicates the lack of void and solid volume with a size larger than 80 and 120 μm in all directions, respectively. The lack of correlation peaks demonstrates that the size distribution of void and solid phases were homogeneously distributed, thus indicating the lack of a particular size for the void and solid phase volumes within the range of recorded chord lengths. In the case of such an exponential decay, lv is the persistence length for the void phase and ls is the persistence length for the solid phase. These two persistence lengths correspond to mean distances between two interfaces across the void and solid phases, respectively. The mean first moments of the chord distributions were lv = 6.9 μm and ls = 13.4 μm. Cousin et al. (1996) considered that a 3D cubic image is a representative volume when its side is greater than four times the longest persistence length (i.e. 53.6 μm). On the other hand, we found a representative elementary volume of about 107 voxels for the porosity. This volume corresponds to a cube with a side of 215 pixels (151 μm), thus indicating that the side of the representative elementary volume would correspond to about ten times the longest persistence length instead of four times as proposed by Cousin et al. (1996).
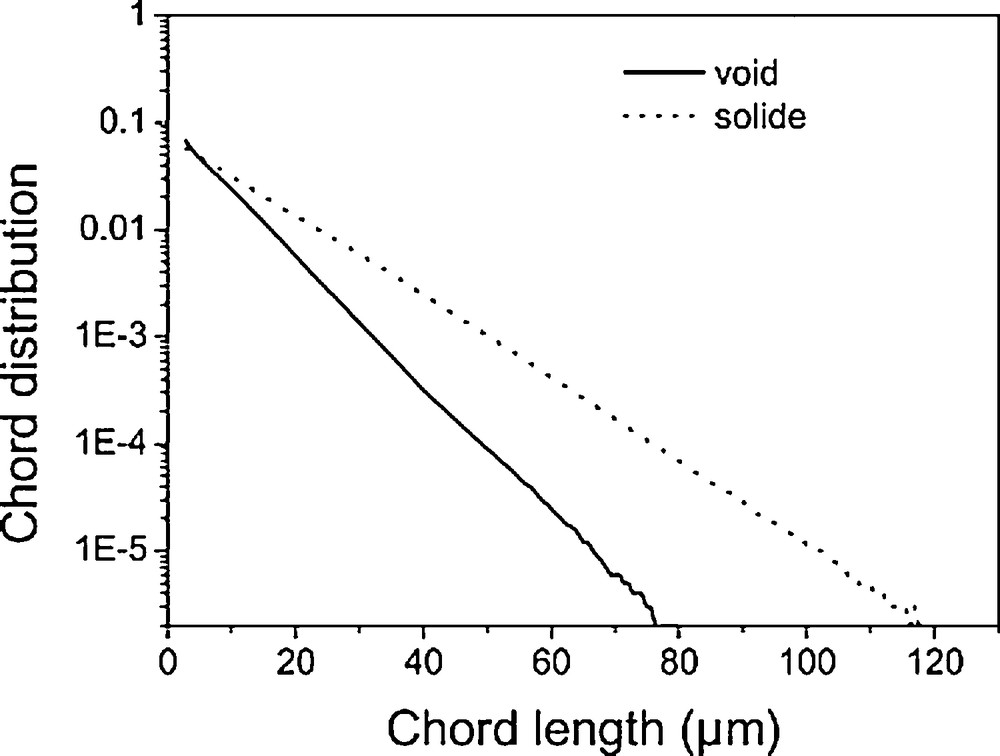
Chord distributions recorded for the studied soil material.
Distributions de cordes enregistrées pour le matériau de sol étudié.
The percolating void cluster represented 99.4% (1.6 × 10⁸ voxels) of the total void phase. This shows that the entire void volume investigated at the resolution of voxels of 0.7 × 0.7 × 0.7 μm3 can be considered as connected. This is consistent with the results recorded in mercury porosimetry and confirms that the high pressures used for mercury intrusion do not break the clay bridges, thus creating connections between voids which are not present in the soil material (Bruand and Prost, 1987). This is confirmed by the negative values of the specific Euler-Poincaré number χV (Table 1). The remaining unconnected voids (0.6%) consisted of 8900 small clusters with sizes from several voxels up to 6000 voxels. These small clusters are probably mostly located along the rod sides and probably connected externally to the volume studied to the percolating cluster. However, such a connectivity recorded for a soil material with a clay content of 20% cannot be extended to soil materials with higher clay contents without further studies (Fiès and Bruand, 1998).
4 Conclusion
Our results show that high-resolution X-ray synchrotron microtomography enables visualisation and quantification of the void phase and the solid phase resulting from the assemblage of silt grains with a clay phase. X-ray synchrotron microtomography showed the isotropy of the silt-clay assemblage in the soil material studied. The void and solid phase volumes were smaller than 80 and 120 μm in all directions, respectively. The mean distance between two interfaces was 6.9 and 13.4 μm for the void and solid phase, respectively. X-ray synchrotron microtomography of the studied soil material also showed that the voids resulting from the assemblage of the silt grains with the clay phase can be considered as fully connected in the studied dried materials. Future work will be focussed on the separation of the clay phase and silt grains, and on soil materials at different water potentials. The data recorded will be compared with those provided by indirect methods such as the data originating from the water retention curve. The X-ray microtomography does not only enable the study of wet soil material but will enable also the discussion of the location of water in the lacunar voids such as those analysed in this study and in larger voids such as biological voids or inter-aggregates voids.
Acknowledgements
The authors thank Isabelle Cousin, Pierre Levitz and Henri Vandamme for their constructive reviews. The authors are grateful to Marco Stampanoni and Amela Grosso (PSI, SLS, Villingen) for their scientific support with the tomography experiments. The authors are also grateful to Sylvain Janiec (ISTO, Universiy of Orleans) and Christian Lelay (INRA, Sciences du Sol, Orleans) for their excellent sample preparations.