

1 Introduction
The geochemistry of shales, especially trace elements, is believed to represent the average composition of the upper continental crust than other sedimentary rocks (DaPeng et al., 2012), since they preserve the original signature of the provenance and diagenetic history (Baioumy and Ismael, 2010; Mondal et al., 2012; Spalletti et al., 2012). In fact, the geochemical composition of clastic sediments is a complex function of variables such as source material, weathering, physical sorting, and diagenesis (Armstrong-Altrin et al., 2004, 2012; Moosavirad et al., 2012; Nagarajan et al., 2007a, 2007b). However, many studies have utilized the geochemical composition of clastic sediments and successfully inferred the source-area weathering conditions (Gupta et al., 2012; Raza et al., 2012; Selvaraj and Chen, 2006), the provenance (Armstrong-Altrin, 2009; Bakkiaraj et al., 2010; Cullers, 2000, 2002), and the tectonic setting of a sedimentary basin (Armstrong-Altrin and Verma, 2005; Fatima and Khan, 2012). Similarly, the REE patterns and certain trace element ratios of clastic sediments are believed to be an effective tool for the reconstruction of source rock composition because they are not significantly redistributed in the course of sedimentation, lithogenesis, and metamorphism (Etemad-Saeed et al., 2011; Fu et al., 2010; Zaid, 2012).
2 Geological setting
The Molango region is located in the northern part of the Hidalgo State, Mexico (Fig. 1). The general stratigraphy of the study area is shown in Fig. 2 (Morán-Zenteno, 1994). Structurally, the Molango region belongs to the middle portion of the Huayacocotla anticlinorium, which forms part of the Sierra Madre Oriental (Campa and Coney, 1983; Ochoa-Camarillo et al., 1999).
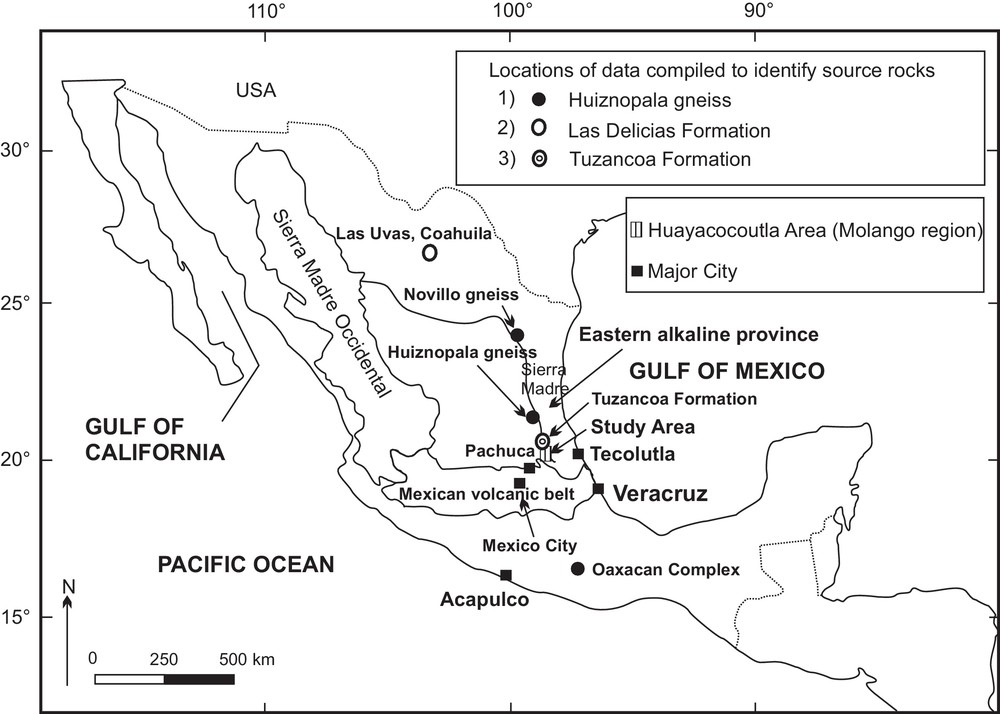
Map showing study areas and locations of the source areas from where the geochemical data are compiled in this study for comparison (map modified after Keppie, 2004). 1. Lawlor et al. (1999), 2. Lopez et al. (2001), 3. Rosales-Lagarde et al. (2005).
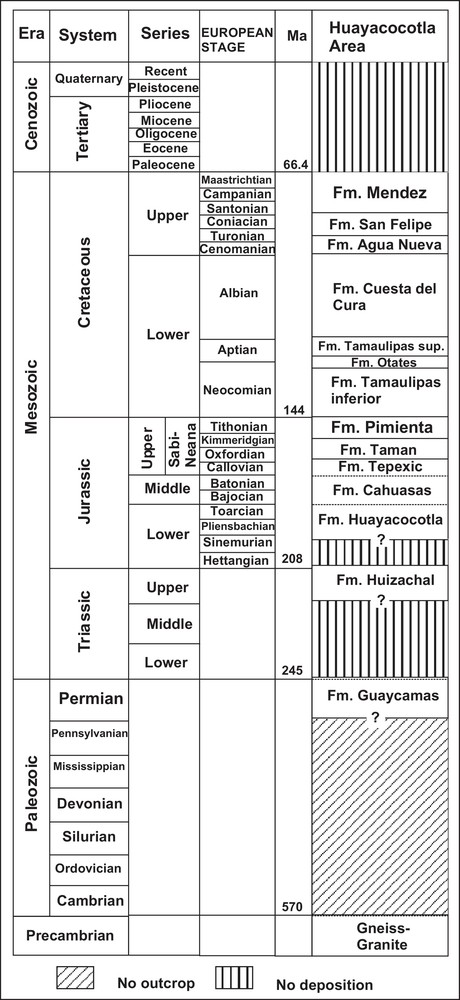
Stratigraphic correlation for the Huayacocotla area (after Morán-Zenteno, 1994). Fm.: formation; sup.: superior.
For the present study, shale samples of the Pimienta (Upper Jurassic), Huayacocotla (Lower Jurassic), and Méndez (Upper Cretaceous) Formations were collected from the localities at El Crucero (Lat. 21°30′02″ N; Long. 98°38′08″ W), Linda Vista (Lat. 20°33′45″ N; Long. 98°30′02″ W), and near Ilamatlán (Lat. 20°46′13″ N; Long. 98°26′42″ W), respectively (Fig. 3).
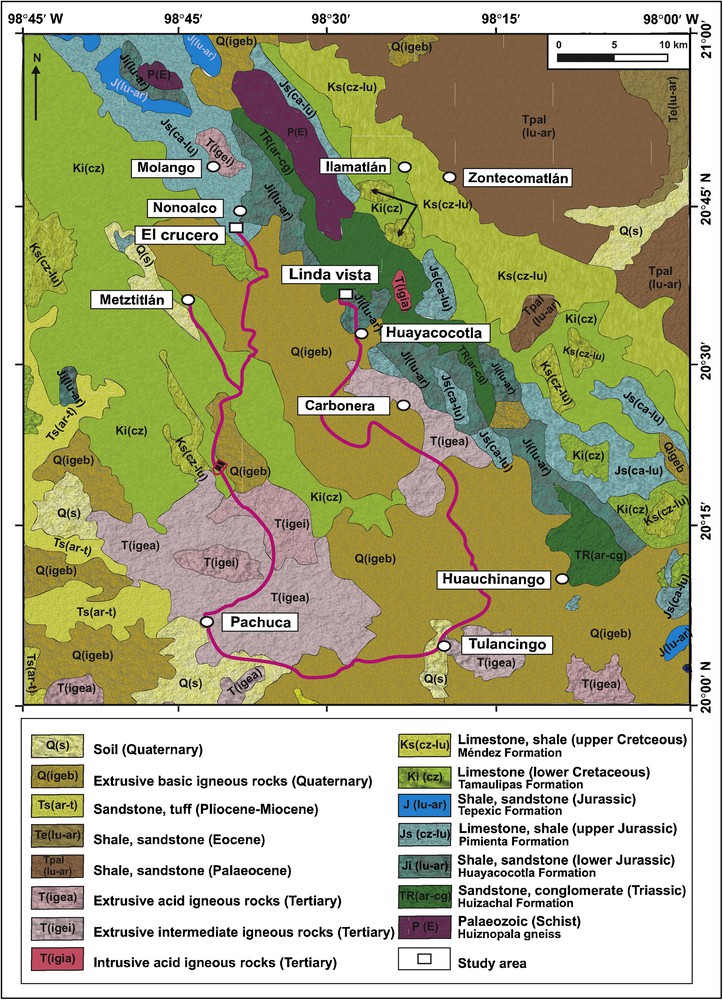
Simplified geology map of the study area showing sample locations (map modified from Carta geologica, Direccion General de Geografia del Territoria Nacional, scale 1:1,000,000).
2.1 Pimienta Formation
The Upper Jurassic Pimienta Formation is conformably overlain by the Tamulipas inferior Formation of the Lower Cretaceous age (Fig. 2; Heim, 1926). The rocks are composed of shales, argillaceous limestones, and thin-bedded lime mudstone with chert layers. Thickness of the formation is about 300 m, but it varies due to tectonic thinning or thickening (Suter, 1980).
2.2 Huayacocotla Formation
The Huayacocotla Formation consists of marine deposits containing ammonites of Early Jurassic age. The age was assigned based on the Vermiceras, Arnioceras, Coroniceras, Echioceras, and Microderoceras ammonite fossils (Silva-Pineda and Buitrón-Sánchez, 1999). During the beginning of the Jurassic, continental deposition continued in this part of Mexico with red bed sedimentation, except in the region of the Huayacocotla anticlinorium, where an advance of the seas that induced marine sedimentation of an argillaceous and sandy sequence is recorded. Carrillo-Bravo (1971) termed this Huayacocotla area as “Liassic Basin of Huayacocotla” and named these sedimentary strata as the Huayacocotla Formation, which was deformed at the end of the Early Jurassic leading to the predominance of continental deposition in the region during the Middle Jurassic (Morán-Zenteno, 1994).
2.3 Méndez Formation
The Upper Cretaceous Méndez Formation (Gamper, 1977) is conformably underlain by the San Felipe Formation (Fig. 2). This formation consists of yellow-brown argillaceous limestone, intercalated with shale and sandstone. Outcrops are few and the samples of this study are collected at the road-cutting section near to the village Ilamatlán (Fig. 3).
2.4 Tectonic setting of the study area
The study area is surrounded towards the south by the Miocene to Recent Mexican Volcanic Belt of a controversial origin, presumably related to extensional tectonics (Verma, 2002, 2009), towards the west by the Basin and Range province (Suter and Contreras, 2002) and towards the east by the Oligocene to Recent Eastern Alkaline Province (EAP), both of them are related to the extensional processes (Cruz-Huicochea and Verma, 2013; Luhr et al., 1995; Robin and Tournon, 1978). Cruz-Huicochea and Verma (2013), in fact, used multi-dimensional tectonomagmatic diagrams (Agrawal et al., 2008; Verma et al., 2006; Verma and Agrawal, 2011) to infer the tectonic setting of EAP as a continental rift.
During the Lower and Middle Jurassic periods, an extensional event (gravity faulting) produced several tectonic horsts and grabens (Ochoa-Camarillo et al., 1998). The formation of tectonic horsts and grabens continued to the end of the Middle Jurassic (Cahuasas red beds). Afterwards, from the Late Cretaceous to the Late Eocene, the Jurassic and Cretaceous sedimentary rocks were folded, which is called as the laramide Orogeny. This tectonic event produced a complex set of folds and overthrusts called the Huayacocotla anticlinorium. In the final stage, a post-Pliocene extension produced a tectonic valley by normal faulting, which is called as the Molango Graben (Ochoa-Camarillo et al., 1998).
The oldest rocks exposed in the Molango region are Precambrian ortho and paragneisses (the Huiznopala gneiss), with protolith magmatic ages between 1200 and 1150 Ma (Lawlor et al., 1999). These gneisses are equivalent to the Novillo gneiss (Ciudad Victoria) and to the Oaxaca Complex (Oaxaca) (Lawlor et al., 1999; Ortega-Gutiérrez et al., 1995; Rosales-Lagarde et al., 2005). The Palaeozoic rocks exposed along the Huayacocotla area are the Permian Tuzancoa Formation (Guaycamas Formation; Fig. 2).
3 Analytical methods
Thirty fresh shale samples (Pimienta Formation = 10; Huayacocotla Formation = 10; Méndez Formation = 10) were collected from outcrops exposed along the road-cuts (from villages El Crucero, Lindavista, and near Ilamatlán, respectively; Fig. 3). The samples were cleaned in distilled water, dried, and then powdered. By a standard technique, 15 thin-sections were prepared. Friedman's (1959) organic stain specific for calcite and Katz and Friedman's (1965) combined organic and inorganic stain specific for iron rich calcite have been adopted to identify the mineralogical variations.
The mineralogy was studied using the Siemens D5000 X-ray diffractometer (XRD) at the XRF Laboratory, Institute of Geology, Universidad Nacional Autónoma de México (UNAM). About 21 shale samples (7 samples from each formation) were selected for the scanning electron microscopic analysis (SEM) at the Petrology Laboratory, Institute of Geophysics, UNAM. The study was undertaken on a Philips XL-30 scanning electron microscope (SEM) with a 3.5 nm of resolution, equipped with EDAX spectrometer (EDS) system, to determine the chemical composition during SEM observations.
The samples were analyzed for major and trace elements. Major elements were analyzed using conventional XRF procedures at the Institute of Geology, UNAM. Powdered samples were heated to 110 °C for 6 h, followed by heating in a muffle furnace at 1000 °C for 2 h to determine LOI (loss on ignition). Lithium tetraborate was mixed with the powdered samples and heated to 1000 °C to form a fused sample for X-ray fluorescence analyses. Final analyses were carried out using a Rigaku model RIX-3000 equipped with an Rh tube. Calibration curves were prepared using International reference materials (Lozano and Bernal, 2005; Lozano-Santa Cruz et al., 1995). Resulting chemical analyses for major elements have precisions better than 5%. Major-element data were recalculated to an anhydrous (LOI-free) basis and adjusted to 100% before using them in various diagrams.
The trace elements were analyzed at the Korea Basic Science Institute, Daejeon, Korea. Trace element (Ba, Co, Cr, Cu, Ni, Sc, Sr, V, Zn, and Zr) concentrations were determined using a Jobin Yvon 138 Ultrace inductively coupled plasma atomic emission spectrometer (ICP-AES). The REE, Cs, Hf, Nb, Pb, Rb, Th, U, and Y were analyzed by a VG Elemental PQII Plus inductively coupled plasma mass spectrometer (ICP-MS) using a method given by Jarvis (1988). The analytical precision for trace elements is better than 5%. The United States Geological Survey Standard MAG-1 was used for calibration. Three analyses were made for each sample and averaged.
The statistical information (Tables 1–3) was obtained using the DODESSYS software (Verma and Díaz-González, 2012) after the application of all single outlier discordancy tests at 99% confidence level (Verma, 1997; Verma et al., 2009) based on the new precise and accurate critical values (Verma et al., 2008; Verma and Quiroz-Ruiz, 2008, 2011). Only the rounded data are reported following the flexible rules summarized by Verma (2005); such flexible rules are chosen to enable other researchers to apply significance tests (Cruz-Huicochea and Verma, 2013; Verma and Cruz-Huicochea, 2013). Note that the significance tests of Fisher F, Student t and ANOVA require that the data be drawn from normal populations without any statistical contamination. The discordant values not used in the statistical calculations are identified by an asterisk (*). Using an unpublished software UDASYS (by S.P. Verma, R. Cruz-Huicochea, and L. Díaz-González), we applied the ANOVA (Analysis Of Variance) test at 99% confidence level for the compositional data to identify statistically the similarities among the PF, HF, and MF shales. This software uses highly precise and accurate critical values of F (Cruz-Huicochea and Verma, 2013) and t (Verma and Cruz-Huicochea, 2013) for the application of significance tests (F, t, and ANOVA). The results are shown in Table 4.
Major element concentrations in weight % for shales of the Upper Jurassic Pimienta (PF; El Crucero), Lower Jurassic Huayacocotla (HF; Linda Vista), and Upper Cretaceous Méndez Formations (MF; near Ilamatlán), Molango region, Hidalgo, Mexico.
| Location | El Crucero | ||||||||||
| Sample # | EC1 | EC2 | EC3 | EC4 | EC5 | EC6 | EC7 | EC8 | EC9 | EC10 | Mean ± 1s (n = 10) |
| Vol. free SiO2 | 65.70 | 66.52 | 66.99 | 68.79 | 68.95 | 65.67 | 63.12 | 69.62 | 71.87 | 64.60 | 67.18 ± 2.62 |
| SiO2 | 61.30 | 62.20 | 62.90 | 64.80 | 64.40 | 61.20 | 58.70 | 64.40 | 67.70 | 59.50 | 62.71 ± 2.71 |
| TiO2 | 0.90 | 0.90 | 0.90 | 0.90 | 0.80 | 0.90 | 0.80 | 0.70 | 0.70 | 0.90 | 0.84 ± 0.08 |
| Al2O3 | 18.40 | 18.10 | 18.00 | 16.60 | 16.20 | 19.70 | 18.80 | 15.40 | 15.40 | 18.70 | 17.53 ± 1.52 |
| Fe2O3* | 5.50 | 5.60 | 5.40 | 6.00 | 5.40 | 5.90 | 8.50* | 6.20 | 5.10 | 6.00 | 5.678 ± 0.363 |
| MnO | 0.00 | 0.00 | 0.00 | 0.00 | 0.10 | 0.00 | 0.00 | 0.00 | 0.00 | 0.00 | --- |
| MgO | 1.20 | 1.10 | 1.10 | 1.00 | 1.00 | 0.90 | 1.20 | 1.00 | 0.90 | 1.10 | 1.050 ± 0.108 |
| CaO | 1.70 | 1.50 | 1.60 | 1.10 | 1.90 | 0.20 | 0.90 | 1.30 | 1.00 | 1.60 | 1.28 ± 0.50 |
| Na2O | 1.00 | 0.90 | 0.90 | 1.10 | 0.90 | 0.80 | 0.70 | 0.90 | 0.90 | 0.90 | 0.900 ± 0.105 |
| K2O | 3.10 | 3.00 | 2.90 | 2.60 | 2.60 | 3.40 | 3.00 | 2.50 | 2.40 | 3.10 | 2.860 ± 0.320 |
| P2O5 | 0.20 | 0.20 | 0.20 | 0.10 | 0.10 | 0.20 | 0.40 | 0.10 | 0.10 | 0.30 | 0.190 ± 0.100 |
| LOI | 6.39 | 6.12 | 6.35 | 5.69 | 6.03 | 7.07 | 6.61 | 6.94 | 5.61 | 6.95 | 6.38 ± 0.52 |
| Sum | 99.69 | 99.62 | 100.25 | 99.89 | 99.43 | 100.27 | 99.61 | 99.44 | 99.81 | 99.05 | 99.706 ± 0.373 |
| CIA | 69.46 | 70.82 | 70.51 | 71.48 | 67.64 | 78.61 | 75.70 | 70.16 | 72.31 | 70.71 | 71.74 ± 3.18 |
| Al2O3/TiO2 | 20.44 | 20.11 | 20.00 | 18.44 | 20.25 | 21.89 | 23.50 | 22.00 | 22.00 | 20.78 | 20.94 ± 1.42 |
| Zr/Al2O3 | 7.63 | 7.66 | 7.92 | 8.62 | 8.87 | 6.60 | 6.51 | 7.82 | 7.97 | 7.24 | 7.68 ± 0.76 |
| Location | Linda Vista | ||||||||||
| Sample # | LV1 | LV2 | LV3 | LV4 | LV5 | LV6 | LV7 | LV8 | LV9 | LV10 | Mean |
| Vol. free SiO2 | 81.12 | 63.68 | 64.17 | 81.00 | 68.09 | 70.16 | 68.30 | 70.38 | 70.69 | 71.56 | 70.9 ± 6.0 |
| SiO2 | 76.90 | 58.90 | 60.00 | 78.00 | 63.80 | 66.30 | 64.00 | 66.30 | 66.80 | 66.70 | 66.8 ± 6.3 |
| TiO2 | 0.50 | 0.90 | 0.90 | 0.50 | 1.00* | 0.90 | 0.90 | 0.90 | 0.90 | 0.90 | 0.811 ± 0.176 |
| Al2O3 | 8.50 | 20.70 | 20.30 | 11.00 | 19.20 | 17.20 | 18.40 | 17.00 | 16.50 | 17.40 | 16.62 ± 3.92 |
| Fe2O3* | 4.00 | 5.70 | 6.10 | 3.30 | 4.70 | 5.20 | 5.50 | 5.30 | 5.80 | 3.50 | 4.91 ± 0.99 |
| MnO | 0.10 | 0.00 | 0.00 | 0.00 | 0.00 | 0.00 | 0.00 | 0.00 | 0.00 | 0.00 | --- |
| MgO | 1.10 | 1.00 | 1.10 | 0.70 | 0.80 | 0.90 | 0.80 | 0.80 | 0.80 | 0.70 | 0.870 ± 0.149 |
| CaO | 1.60 | 0.70 | 0.90 | 0.10 | 0.10 | 0.20 | 0.20 | 0.20 | 0.20 | 0.01 | 0.42 ± 0.50 |
| Na2O | 1.10 | 0.90 | 0.90 | 1.30 | 1.00 | 0.90 | 0.80 | 0.80 | 0.80 | 1.00 | 0.950 ± 0.158 |
| K2O | 0.90 | 3.50 | 3.20 | 1.30 | 3.00 | 2.80 | 3.00 | 2.80 | 2.60 | 2.90 | 2.60 ± 0.83 |
| P2O5 | 0.10 | 0.20* | 0.10 | 0.10 | 0.10 | 0.10 | 0.10 | 0.10 | 0.10 | 0.10 | (0.10) |
| LOI | 4.80 | 6.93 | 6.33 | 3.49 | 5.96 | 5.15 | 5.86 | 5.43 | 5.28 | 6.52 | 5.58 ± 0.99 |
| Sum | 99.61 | 99.43 | 99.83 | 99.79 | 99.66 | 99.65 | 99.56 | 99.63 | 99.78 | 99.73 | 99.667 ± 0.121 |
| CIA | 59.89 | 75.99 | 75.52 | 74.69 | 79.10 | 77.92 | 78.88 | 78.30 | 78.59 | 78.37 | 75.72 ± 5.77 |
| Al2O3/TiO2 | 17.00 | 23.00 | 22.56 | 22.00 | 19.20 | 19.11 | 20.44 | 18.90 | 18.33 | 19.33 | 20.00 ± 2.00 |
| Zr/Al2O3 | 15.39 | 6.83 | 6.26 | 11.08 | 9.29 | 9.15 | 6.24 | 8.41 | 8.50 | 8.13 | 8.93 ± 2.71 |
| Location | Near Ilamatlán | ||||||||||
| Sample # | IM1 | IM2 | IM3 | IM4 | IM5 | IM6 | IM7 | IM8 | IM9 | IM10 | Mean |
| Vol. free SiO2 | 75.39 | 75.53 | 80.60 | 75.44 | 76.01 | 76.53 | 80.18 | 80.26 | 88.97 | 90.99 | 80.0 ± 5.7 |
| SiO2 | 71.34 | 72.12 | 74.40 | 72.07 | 71.93 | 70.60 | 76.18 | 75.34 | 87.01 | 89.91 | 76.1 ± 6.8 |
| TiO2 | 0.20 | 0.20 | 0.22 | 0.23 | 0.21 | 0.36 | 0.35 | 0.35 | 0.36 | 0.21 | 0.269 ± 0.075 |
| Al2O3 | 14.73 | 15.12 | 16.15 | 13.32 | 13.28 | 14.52 | 14.09 | 13.24 | 7.38 | 6.21 | 12.80 ± 3.31 |
| Fe2O3* | 2.16 | 2.06 | 0.47 | 2.05 | 1.34 | 1.90 | 1.52 | 2.22 | 0.39 | 0.23 | 1.43 ± 0.79 |
| MnO | 0.004 | 0.004 | 0.009 | 0.017 | 0.016 | 0.017 | 0.008 | 0.018 | 0.003 | 0.003 | 0.010 ± 0.006 |
| MgO | 0.269 | 0.260 | 0.252 | 0.536 | 0.482 | 0.415 | 0.479 | 0.481 | 0.441 | 0.383 | 0.400 ± 0.105 |
| CaO | 0.160 | 0.150 | 0.089 | 0.444 | 0.514 | 0.198 | 0.027 | 0.043 | 0.035 | 0.041 | 0.170 ± 0.174 |
| Na2O | 1.42 | 1.45 | 0.53 | 1.69 | 1.54 | 1.03 | 0.33 | 0.29 | 0.39 | 0.35 | 0.90 ± 0.58 |
| K2O | 4.31 | 3.70 | 0.16 | 5.14 | 5.28 | 3.19 | 2.00 | 1.86 | 1.76 | 1.45 | 2.88 ± 1.71 |
| P2O5 | 0.044 | 0.42* | 0.038 | 0.041 | 0.051 | 0.032 | 0.029 | 0.045 | 0.036 | 0.032 | 0.039 ± 0.007 |
| LOI | 4.32 | 4.02 | 6.97 | 3.57 | 4.76 | 5.96 | 4.83 | 4.61 | 2.14 | 1.45 | 4.26 ± 1.63 |
| Sum | 98.94 | 99.50 | 99.28 | 99.10 | 99.39 | 98.20 | 99.84 | 98.48 | 99.94 | 100.26 | 99.29 ± 0.64 |
| CIA | 66.90 | 69.41 | 93.06 | 59.30 | 59.11 | 72.55 | 83.61 | 83.80 | 73.95 | 73.72 | 73.54 ± 10.86 |
| Al2O3/TiO2 | 73.63 | 75.60 | 74.06 | 58.17 | 64.76 | 40.90 | 40.38 | 37.82 | 20.67 | 29.57 | 1.56 ± 20.15 |
| Zr/Al2O3 | 37.24 | 37.48 | 32.28 | 32.84 | 51.09 | 39.07 | 9.57 | 11.70 | 70.56 | 99.90 | 42.17 ± 26.76 |
Trace element concentrations in ppm for shales of the Upper Jurassic Pimienta (PF; El Crucero), Lower Jurassic Huayacocotla (HF; Linda Vista), and Upper Cretaceous Méndez Formations (MF; near Ilamatlán), Molango region, Hidalgo, Mexico.
| Location | El Crucero | ||||||||||
| Sample # | EC1 | EC2 | EC3 | EC4 | EC5 | EC6 | EC7 | EC8 | EC9 | EC10 | Mean ± 1s (n = 10) |
| Ba | 530.5 | 511.7 | 481.4 | 466.0 | 427.5 | 554.7 | 480.0 | 337.5 | 357.8 | 516.4 | 466 ± 72 |
| Cd | 0.20 | 0.29 | 0.32 | 0.23 | 0.55 | 2.62 | 0.93 | 1.50 | 0.83 | 0.87 | 0.83 ± 0.75 |
| Co | 14.52 | 14.75 | 14.59 | 14.05 | 12.78 | 14.06 | 12.76 | 13.67 | 16.27 | 14.26 | 14.17 ± 1.01 |
| Cr | 110.0 | 107.8 | 104.8 | 103.3 | 94.79 | 165.3 | 145.3 | 102.1 | 91.45 | 137.1 | 116.2 ± 24.4 |
| Cs | 8.76 | 8.34 | 8.02 | 7.28 | 7.26 | 11.44 | 10.50 | 8.24 | 8.00 | 9.74 | 8.76 ± 1.38 |
| Cu | 20.86 | 23.05 | 22.33 | 28.61 | 25.13 | 29.19 | 27.89 | 25.94 | 27.56 | 31.51 | 26.21 ± 3.37 |
| Ga | 36.44 | 35.62 | 34.38 | 32.98 | 31.25 | 37.75 | 36.33 | 29.11 | 28.56 | 40.09 | 34.25 ± 3.75 |
| Hf | 4.13 | 3.98 | 4.17 | 3.99 | 4.05 | 3.30 | 3.64 | 3.30 | 3.55 | 4.48 | 3.859 ± 0.393 |
| Nb | 14.28 | 13.90 | 14.11 | 13.92 | 13.82 | 11.31 | 13.00 | 11.52 | 11.01 | 15.44 | 13.23 ± 1.48 |
| Ni | 46.10 | 45.64 | 46.75 | 46.02 | 44.80 | 50.27 | 52.07 | 45.48 | 41.87 | 57.37 | 47.64 ± 4.44 |
| Pb | 13.74 | 15.15 | 16.82 | 23.64 | 28.32 | 36.81 | 28.05 | 29.93 | 29.36 | 14.77 | 23.7 ± 8.0 |
| Rb | 156.5 | 148.2 | 143.0 | 126.8 | 127.3 | 182.6 | 173.7 | 132.2 | 109.4 | 183.5 | 148.3 ± 25.5 |
| Sc | 16.45 | 15.84 | 15.93 | 15.92 | 14.81 | 17.01 | 17.07 | 13.31 | 11.65 | 17.53 | 15.55 ± 1.84 |
| Sr | 80.86 | 76.98 | 76.01 | 71.04 | 75.75 | 62.68 | 73.32 | 56.24 | 53.78 | 81.16 | 70.8 ± 9.8 |
| Th | 10.03 | 9.87 | 6.67 | 9.36 | 9.27 | 10.13 | 10.22 | 8.65 | 7.59 | 11.19 | 9.30 ± 1.34 |
| U | 2.38 | 2.60 | 2.33 | 2.24 | 2.34 | 2.41 | 2.62 | 2.06 | 1.86 | 2.65 | 2.349 ± 0.251 |
| V | 128.6 | 125.9 | 121.4 | 105.5 | 113.6 | 218.6 | 196.1 | 135.7 | 124.3 | 158.0 | 142.8 ± 37.1 |
| Y | 22.90 | 21.88 | 25.15 | 23.75 | 22.95 | 23.03 | 33.51 | 21.57 | 18.28 | 34.03 | 24.7 ± 5.1 |
| Zn | 136.7 | 135.9 | 113.7 | 93.73 | 96.15 | 279.8 | 138.1 | 187.6 | 158.4 | 203.9 | 155 ± 57 |
| Zr | 140.4 | 138.7 | 142.6 | 143.1 | 143.7 | 130.0 | 122.4 | 120.4 | 122.7 | 135.3 | 133.9 ± 9.3 |
| Location | Linda Vista | ||||||||||
| Sample # | LV1 | LV2 | LV3 | LV4 | LV5 | LV6 | LV7 | LV8 | LV9 | LV10 | Mean |
| Ba | 181.4 | 595.0 | 570.6 | 270.1 | 584.0 | 503.0 | 551.0 | 517.5 | 493.3 | 524.8 | 479 ± 139 |
| Cd | 0.90 | 0.85 | 0.54 | 1.56* | 0.50 | 0.42 | 0.55 | 0.42 | 0.47 | 4.44* | 0.581 ± 0.188 |
| Co | 6.03 | 15.89 | 12.05 | 13.31 | 7.95 | 9.05 | 8.02 | 4.85 | 7.20 | 11.87 | 9.62 ± 3.51 |
| Cr | 65.98 | 152.0 | 130.0 | 65.19 | 122.1 | 112.7 | 114.7 | 106.2 | 108.9 | 106.7 | 108.4 ± 26.4 |
| Cs | 2.30 | 11.12 | 8.90 | 3.51 | 7.43 | 7.26 | 7.75 | 7.52 | 7.24 | 9.64 | 7.27 ± 2.63 |
| Cu | 22.61 | 37.26 | 35.65 | 33.68 | 31.68 | 24.71 | 26.90 | 24.88 | 29.05 | 35.33 | 30.2 ± 5.3 |
| Ga | 16.02 | 44.06 | 40.99 | 20.05 | 37.06 | 35.85 | 37.94 | 35.88 | 35.45 | 37.45 | 34.1 ± 8.9 |
| Hf | 4.31 | 4.54 | 4.33 | 4.22 | 5.62 | 5.04 | 3.24* | 4.26 | 4.53 | 4.62 | 4.61 ± 0.46 |
| Nb | 9.87 | 16.45 | 16.24 | 15.91 | 13.34 | 13.40 | 11.16 | 11.45 | 14.21 | 15.92 | 13.80 ± 2.37 |
| Ni | 45.59 | 62.45 | 53.83 | 37.52 | 42.28 | 42.78 | 42.39 | 43.53 | 44.66 | 30.08 | 44.5 ± 8.7 |
| Pb | 24.29 | 35.21* | 15.57 | 18.09 | 13.39 | 15.59 | 22.54 | 14.34 | 15.18 | 16.92 | 17.32 ± 3.73 |
| Rb | 42.63 | 203.6 | 182.3 | 61.5 | 113.8 | 143.1 | 166.0 | 156.2 | 135.9 | 177.9 | 138 ± 52 |
| Sc | 6.34 | 18.16 | 18.30 | 8.72 | 17.23 | 15.41 | 16.03 | 15.30 | 14.88 | 16.22 | 14.66 ± 3.97 |
| Sr | 51.51 | 81.36 | 76.20 | 52.05 | 83.59 | 64.40 | 65.33 | 59.70 | 59.16 | 65.29 | 65.9 ± 11.3 |
| Th | 7.30 | 11.75 | 11.75 | 8.38 | 9.72 | 10.26 | 10.58 | 10.12 | 10.45 | 11.69 | 10.20 ± 1.46 |
| U | 2.11 | 2.71 | 2.55 | 2.47 | 2.32 | 2.37 | 2.37 | 2.36 | 2.41 | 3.17 | 2.484 ± 0.287 |
| V | 42.95 | 232.0 | 188.2 | 56.73 | 148.1 | 125.3 | 127.9 | 119.5 | 124.1 | 121.3 | 129 ± 55 |
| Y | 20.66 | 27.06 | 25.50 | 24.23 | 21.58 | 25.58 | 25.15 | 24.46 | 24.83 | 30.02 | 24.9 ± 2.61 |
| Zn | 109.5 | 154.1 | 152.1 | 91.28 | 121.0 | 120.9 | 119.6 | 134.6 | 140.4 | 98.66 | 124.2 ± 21.2 |
| Zr | 130.8 | 141.3 | 127.0 | 121.9 | 178.4 | 157.3 | 114.9 | 142.9 | 140.3 | 141.4 | 139.6 ± 18.2 |
| Location | Near Ilamatlán | ||||||||||
| Sample # | IM1 | IM2 | IM3 | IM4 | IM5 | IM6 | IM7 | IM8 | IM9 | IM10 | Mean |
| Ba | 83.02 | 86.73 | 17.40 | 92.86 | 107.7 | 70.14 | 186.2 | 208.9 | 50.91 | 73.84 | 98 ± 58 |
| Co | 1.36 | 1.45 | 0.57 | 1.23 | 1.54 | 1.23 | 1.08 | 1.35 | 0.50 | 1.02 | 1.133 ± 0.352 |
| Cr | 14.93 | 20.43 | 17.29 | 14.85 | 18.90 | 18.02 | 19.34 | 23.19 | 16.68 | 32.94* | 18.18 ± 2.66 |
| Cs | 2.68 | 2.73 | 1.18 | 2.93 | 2.26 | 2.36 | 3.14 | 3.60 | 1.20 | 1.46 | 2.35 ± 0.83 |
| Cu | 11.79 | 12.08 | 18.63 | 8.81 | 15.56 | 9.01 | 14.48 | 20.50 | 14.41 | 13.56 | 13.88 ± 3.76 |
| Ga | 16.77 | 18.12 | 15.87 | 14.2 | 15.53 | 16.42 | 10.12 | 11.08 | 13.26 | 9.39 | 14.08 ± 3.01 |
| Hf | 23.35 | 23.81 | 21.65 | 18.94 | 25.58 | 23.05 | 5.34 | 5.69 | 20.53 | 25.97 | 19.4 ± 7.6 |
| Nb | 17.96 | 20.00 | 19.01 | 15.59 | 17.66 | 20.63 | 6.75 | 7.75 | 21.88 | 18.97 | 16.6 ± 5.2 |
| Ni | 3.59 | 3.66 | 4.01 | 3.65 | 4.30 | 3.86 | 4.63 | 5.82* | 3.87 | 9.54* | 3.946 ± 0.360 |
| Pb | 1.52 | 1.54 | 0.94 | 1.18 | 1.63 | 1.20 | 0.96 | 2.14 | 1.06 | 1.10 | 1.327 ± 0.377 |
| Rb | 80.83 | 86.79 | 7.28 | 89.99 | 91.24 | 60.57 | 39.03 | 43.55 | 9.71 | 11.82 | 52.1 ± 34.5 |
| Sc | 3.11 | 3.50 | 2.69 | 2.58 | 2.20 | 3.51 | 2.70 | 3.08 | 1.79 | 1.96 | 2.71 ± 0.60 |
| Sr | 11.15 | 11.25 | 5.67 | 14.05 | 15.81 | 8.96 | 6.58 | 10.16 | 9.86 | 19.32 | 11.28 ± 4.15 |
| Th | 16.14 | 16.06 | 19.72 | 12.21 | 12.15 | 15.93 | 4.78 | 5.54 | 15.25 | 11.80 | 13.0 ± 4.8 |
| U | 3.19 | 3.13 | 2.39 | 1.69 | 1.98 | 1.83 | 1.11 | 1.23 | 2.78 | 1.94 | 2.13 ± 0.73 |
| V | 1.80 | 1.95 | 1.73 | 1.92 | 2.24 | 3.67 | 4.42 | 10.27* | 1.02 | 2.43 | 2.35 ± 1.05 |
| Y | 47.53 | 40.60 | 28.66 | 37.27 | 45.32 | 44.04 | 16.19 | 16.69 | 13.62 | 11.17 | 30.1 ± 14.5 |
| Zn | 25.98 | 25.12 | 35.18 | 41.18 | 44.53 | 50.32 | 26.63 | 49.91 | 10.57 | 20.01 | 32.9 ± 13.4 |
| Zr | 548.3 | 566.7 | 521.2 | 437.4 | 678.2 | 567.3 | 134.9 | 154.89 | 520.7 | 620.2 | 475 ± 185 |
Rare earth element concentrations in ppm for shales of the Upper Jurassic Pimienta (PF; El Crucero), Lower Jurassic Huayacocotla (HF; Linda Vista), and Upper Cretaceous Méndez Formations (MF; near Ilamatlán), Molango region, Hidalgo, Mexico.
| Location | El Crucero | ||||||||||
| Sample # | EC1 | EC2 | EC3 | EC4 | EC5 | EC6 | EC7 | EC8 | EC9 | EC10 | Mean ± 1s (n = 10) |
| La | 31.30 | 31.68 | 30.54 | 31.45 | 30.58 | 32.84 | 38.46 | 26.52 | 23.81 | 36.10 | 31.33 ± 4.18 |
| Ce | 67.51 | 67.56 | 65.42 | 68.15 | 66.05 | 68.88 | 102.27 | 56.13 | 50.76 | 97.36 | 71.0 ± 16.3 |
| Pr | 7.71 | 7.69 | 7.50 | 7.81 | 7.54 | 7.99 | 10.11 | 6.54 | 5.78 | 9.36 | 7.80 ± 1.23 |
| Nd | 40.29 | 40.41 | 39.43 | 41.19 | 39.74 | 41.50 | 53.07 | 34.33 | 30.28 | 49.75 | 41.0 ± 6.6 |
| Sm | 5.82 | 5.67 | 5.70 | 6.10 | 5.67 | 5.54 | 9.78 | 5.17 | 4.22 | 9.39 | 6.31 ± 1.80 |
| Eu | 1.20 | 1.16 | 1.15 | 1.24 | 1.17 | 1.24 | 2.34 | 1.12 | 0.93 | 2.18 | 1.37 ± 0.48 |
| Gd | 6.02 | 5.86 | 6.09 | 6.42 | 5.93 | 5.63 | 11.43 | 5.41 | 4.37 | 10.71 | 6.79 ± 2.33 |
| Tb | 0.802 | 0.757 | 0.802 | 0.836 | 0.780 | 0.739 | 1.456 | 0.722 | 0.578 | 1.373 | 0.884 ± 0.289 |
| Dy | 4.46 | 4.26 | 4.53 | 4.70 | 4.41 | 4.36 | 7.32 | 4.17 | 3.48 | 7.15 | 4.88 ± 1.28 |
| Ho | 0.92 | 0.87 | 0.92 | 0.94 | 0.90 | 0.91 | 1.34 | 0.84 | 0.73 | 1.34 | 0.971 ± 0.203 |
| Er | 2.79 | 2.63 | 2.76 | 2.78 | 2.69 | 2.85 | 3.64 | 2.57 | 2.28 | 3.71 | 2.87 ± 0.45 |
| Tm | 0.43 | 0.37 | 0.39 | 0.39 | 0.39 | 0.41 | 0.47 | 0.36 | 0.33 | 0.50 | 0.404 ± 0.051 |
| Yb | 2.65 | 2.57 | 2.71 | 2.67 | 2.64 | 2.76 | 3.15 | 2.48 | 2.24 | 3.30 | 2.717 ± 0.307 |
| Lu | 0.40 | 0.39 | 0.41 | 0.40 | 0.40 | 0.42 | 0.47 | 0.38 | 0.34 | 0.50 | 0.411 ± 0.045 |
| LREE | 152.6 | 153.0 | 148.6 | 154.7 | 149.6 | 156.8 | 213.7 | 128.7 | 114.9 | 202.0 | 157.5 ± 29.8 |
| HREE | 18.44 | 17.71 | 18.61 | 19.12 | 18.13 | 18.08 | 29.28 | 16.94 | 14.35 | 28.57 | 19.9 ± 4.9 |
| ΣREE | 172.3 | 171.9 | 168.3 | 175.1 | 168.9 | 176.1 | 245.3 | 146.7 | 130.1 | 232.7 | 178.7 ± 35.0 |
| Eu/Eu* | 0.61 | 0.61 | 0.59 | 0.60 | 0.61 | 0.67 | 0.68 | 0.64 | 0.65 | 0.66 | 0.632 ± 0.032 |
| Th/Co | 0.69 | 0.67 | 0.66 | 0.67 | 0.73 | 0.72 | 0.80 | 0.63 | 0.47 | 0.78 | 0.68 ± 0.092 |
| Th/Cr | 0.09 | 0.09 | 0.09 | 0.09 | 0.10 | 0.06 | 0.07 | 0.08 | 0.08 | 0.08 | 0.083 ± 0.012 |
| Location | Linda Vista | ||||||||||
| Sample # | LV1 | LV2 | LV3 | LV4 | LV5 | LV6 | LV7 | LV8 | LV9 | LV10 | Mean |
| La | 21.77 | 37.00 | 35.39 | 26.63 | 30.58 | 31.71 | 34.16 | 31.24 | 34.78 | 36.89 | 32.0 ± 4.8 |
| Ce | 47.62 | 94.79 | 91.96 | 58.17 | 66.93 | 69.12 | 89.53 | 67.13 | 91.96 | 104.26 | 78.1 ± 18.6 |
| Pr | 5.39 | 8.99 | 8.59 | 6.75 | 7.77 | 8.08 | 8.55 | 7.89 | 8.56 | 9.90 | 8.05 ± 1.25 |
| Nd | 28.26 | 46.48 | 44.79 | 35.48 | 40.54 | 42.48 | 44.48 | 41.20 | 44.73 | 51.96 | 42.0 ± 6.5 |
| Sm | 4.25 | 6.63 | 6.51 | 5.47 | 5.57 | 6.24 | 6.32 | 5.97 | 6.15 | 8.52* | 5.90 ± 0.73 |
| Eu | 0.94 | 1.35 | 1.32 | 1.16 | 1.13 | 1.31 | 1.29 | 1.24 | 1.31 | 1.84* | 1.228 ± 0.131 |
| Gd | 5.12 | 6.45 | 6.38 | 6.29 | 5.27 | 6.60 | 6.41 | 6.19 | 6.14 | 8.53* | 6.09 ± 0.53 |
| Tb | 0.68 | 0.84 | 0.84 | 0.85 | 0.68 | 0.88 | 0.85 | 0.82 | 0.84 | 1.14* | 0.809 ± 0.075 |
| Dy | 3.83 | 4.94 | 4.90 | 4.81 | 4.18 | 5.04 | 4.98 | 4.84 | 4.87 | 6.26* | 4.710 ± 0.415 |
| Ho | 0.76 | 1.04 | 1.02 | 0.94 | 0.89 | 1.03 | 1.03 | 1.00 | 1.00 | 1.24* | 0.968 ± 0.092 |
| Er | 2.24* | 3.28 | 3.16 | 2.88 | 2.85 | 3.08 | 3.12 | 3.02 | 3.05 | 3.71 | 3.128 ± 0.255 |
| Tm | 0.32* | 0.48 | 0.45 | 0.41 | 0.41 | 0.44 | 0.44 | 0.43 | 0.43 | 0.53 | 0.447 ± 0.038 |
| Yb | 2.29 | 3.31 | 3.07 | 2.73 | 2.77 | 2.99 | 2.97 | 2.89 | 2.98 | 3.50 | 2.950 ± 0.328 |
| Lu | 0.35 | 0.51 | 0.47 | 0.42 | 0.42 | 0.45 | 0.45 | 0.44 | 0.45 | 0.53 | 0.449 ± 0.050 |
| LREE | 107.3 | 193.9 | 187.2 | 132.5 | 151.4 | 157.6 | 183.0 | 153.4 | 186.2 | 211.5 | 166.4 ± 31.6 |
| HREE | 15.59 | 20.84 | 20.27 | 19.35 | 17.47 | 20.49 | 20.25 | 19.62 | 19.93 | 25.41* | 19.31 ± 1.70 |
| ΣREE | 123.8 | 216.1 | 208.8 | 153.0 | 170.0 | 179.4 | 204.6 | 174.3 | 207.4 | 238.8 | 187.6 ± 34.0 |
| Eu/Eu* | 0.61 | 0.62 | 0.62 | 0.60 | 0.63 | 0.62 | 0.61 | 0.62 | 0.64 | 0.65 | 0.622 ± 0.015 |
| Th/Co | 1.21 | 0.74 | 0.97 | 0.63 | 1.22 | 1.13 | 1.32 | 2.09 | 1.45 | 0.98 | 1.174 ± 0.409 |
| Th/Cr | 0.11 | 0.08 | 0.09 | 0.13 | 0.08 | 0.09 | 0.09 | 0.10 | 0.10 | 0.11 | 0.098 ± 0.015 |
| Location | Near Ilamatlán | ||||||||||
| Sample # | IM1 | IM2 | IM3 | IM4 | IM5 | IM6 | IM7 | IM8 | IM9 | IM10 | Mean |
| La | 36.25 | 37.36 | 38.13 | 40.84 | 47.01 | 48.22 | 27.06 | 24.73 | 11.10 | 23.02 | 33.4 ± 11.7 |
| Ce | 76.46 | 78.03 | 80.78 | 84.82 | 92.83 | 91.93 | 54.69 | 48.26 | 14.60 | 24.69 | 64.7 ± 27.9 |
| Pr | 7.50 | 7.80 | 9.90 | 10.10 | 11.38 | 11.56 | 6.75 | 6.10 | 1.10 | 2.04 | 7.42 ± 3.61 |
| Nd | 26.64 | 27.34 | 34.72 | 37.51 | 42.74 | 42.58 | 25.44 | 22.93 | 3.21 | 5.62 | 26.9 ± 13.8 |
| Sm | 5.44 | 5.55 | 6.27 | 7.47 | 8.61 | 8.02 | 4.76 | 4.33 | 0.72 | 0.84 | 5.20 ± 2.71 |
| Eu | 0.36 | 0.36 | 0.26 | 0.40 | 0.47 | 0.40 | 1.09 | 1.04 | 0.08 | 0.08 | 0.454 ± 0.348 |
| Gd | 5.92 | 5.52 | 5.70 | 7.30 | 8.27 | 7.74 | 4.24 | 3.90 | 0.95 | 1.12 | 5.07 ± 2.55 |
| Tb | 1.30 | 1.15 | 1.05 | 1.38 | 1.66 | 1.51 | 0.68 | 0.66 | 0.25 | 0.24 | 0.99 ± 0.51 |
| Dy | 8.80 | 7.67 | 6.39 | 8.24 | 10.01 | 8.95 | 3.52 | 3.47 | 2.29 | 1.73 | 6.11 ± 3.07 |
| Ho | 1.77 | 1.54 | 1.21 | 1.50 | 1.85 | 1.66 | 0.63 | 0.63 | 0.57 | 0.39 | 1.18 ± 0.56 |
| Er | 5.17 | 4.43 | 3.57 | 4.19 | 5.15 | 4.56 | 1.80 | 1.77 | 2.08 | 1.25 | 3.40 ± 1.52 |
| Tm | 0.88 | 0.80 | 0.64 | 0.68 | 0.86 | 0.73 | 0.28 | 0.29 | 0.46 | 0.25 | 0.587 ± 0.247 |
| Yb | 5.56 | 4.86 | 4.14 | 4.21 | 5.39 | 4.60 | 1.83 | 1.88 | 3.21 | 1.90 | 3.76 ± 1.46 |
| Lu | 0.81 | 0.74 | 0.60 | 0.59 | 0.80 | 0.67 | 0.26 | 0.28 | 0.51 | 0.29 | 0.555 ± 0.214 |
| LREE | 152.3 | 156.1 | 169.8 | 180.7 | 202.6 | 202.3 | 118.7 | 106.3 | 30.72 | 56.21 | 138 ± 59 |
| HREE | 30.21 | 26.72 | 23.29 | 28.12 | 33.99 | 30.42 | 13.25 | 12.88 | 10.32 | 7.17 | 21.6 ± 9.8 |
| ΣREE | 182.9 | 183.2 | 193.3 | 209.3 | 237.0 | 233.1 | 133.0 | 120.3 | 41.1 | 63.51 | 160 ± 68 |
| Eu/Eu* | 0.19 | 0.12 | 0.13 | 0.17 | 0.17 | 0.15 | 0.72 | 0.76 | 0.31 | 0.26 | 0.298 ± 0.240 |
| Th/Co | 11.87 | 11.08 | 34.84 | 9.91 | 7.90 | 12.99 | 4.44 | 4.10 | 30.81 | 11.60 | 14.0 ± 10.4 |
| Th/Cr | 1.08 | 0.79 | 1.14 | 0.82 | 0.64 | 0.88 | 0.25 | 0.24 | 0.91 | 0.36 | 0.711 ± 0.328 |
Results of successive application of ANOVA at 99% confidence level to element concentration data for shales of the Upper Jurassic Pimienta (PF), Lower Jurassic Huayacocotla (HF), and Upper Cretaceous Mendez Formations (MF), Molango region, Hidalgo, Mexico, after separating normally distributed data based on DODESSYS (Verma and Díaz-González, 2012).
| Element (% or μg.g−1) | Total No. of groups | ν1 | ν2 | Fcalc | Fcrit | H0 | Regions without significant differences | Regions with significant differences |
| SiO2 | 3 | 2 | 27 | 17.4054224 | 6.48949 | F | Gr1, Gr2, Gr3 | |
| Al2O3 | 3 | 2 | 27 | 6.6339906 | 6.48949 | F | Gr1, Gr2, Gr3 | |
| Fe2O3 | 3 | 2 | 27 | 65.6481620 | 6.48949 | F | Gr1, Gr2, Gr3 | |
| CaO | 3 | 2 | 27 | 19.4552911 | 6.48949 | F | Gr1, Gr2, Gr3 | |
| MgO | 3 | 2 | 27 | 75.8637609 | 6.48949 | F | Gr1, Gr2, Gr3 | |
| K2O | 3 | 2 | 27 | 0.1868709 | 6.48949 | T | Gr1, Gr2, Gr3 | |
| Na2O | 3 | 2 | 27 | 0.0682500 | 6.48949 | T | Gr1, Gr2, Gr3 | |
| TiO2 | 3 | 2 | 27 | 72.1816976 | 6.48949 | F | Gr1, Gr2, Gr3 | |
| P2O5 | 3 | 2 | 27 | 4.1818042 | 6.48949 | T | Gr1, Gr2, Gr3 | |
| CIA | 3 | 2 | 27 | 0.7398343 | 6.48949 | T | Gr1, Gr2, Gr3 | |
| Fe2O3/K2O | 3 | 2 | 27 | 20.7800785 | 6.48949 | F | Gr1, Gr2, Gr3 | |
| SiO2/Al2O3 | 3 | 2 | 27 | 7.4502583 | 6.48949 | F | Gr1, Gr2, Gr3 | |
| Ba | 3 | 2 | 27 | 50.2452336 | 6.48949 | F | Gr1, Gr2, Gr3 | |
| Co | 3 | 2 | 27 | 97.3983734 | 6.48949 | F | Gr1, Gr2, Gr3 | |
| Cr | 3 | 2 | 27 | 65.0852634 | 6.48949 | F | Gr1, Gr2, Gr3 | |
| Cs | 3 | 2 | 27 | 35.3230747 | 6.48949 | F | Gr1, Gr2, Gr3 | |
| Cu | 3 | 2 | 27 | 40.7898926 | 6.48949 | F | Gr1, Gr2, Gr3 | |
| Ni | 3 | 2 | 27 | 74.364569 | 6.48949 | F | Gr1, Gr2, Gr3 | |
| Zr | 3 | 2 | 27 | 32.9820669 | 6.48949 | F | Gr1, Gr2, Gr3 | |
| Hf | 3 | 2 | 27 | 39.6571021 | 6.48949 | F | Gr1, Gr2, Gr3 | |
| Nb | 3 | 2 | 27 | 2.8133439 | 6.48949 | T | Gr1, Gr2, Gr3 | |
| Nd | 3 | 2 | 27 | 7.8641713 | 6.48949 | F | Gr1, Gr2, Gr3 | |
| Rb | 3 | 2 | 27 | 18.3125655 | 6.48949 | F | Gr1, Gr2, Gr3 | |
| Sc | 3 | 2 | 27 | 79.2103269 | 6.48949 | F | Gr1, Gr2, Gr3 | |
| Sr | 3 | 2 | 27 | 35.621795 | 6.48949 | F | Gr1, Gr2, Gr3 | |
| Th | 3 | 2 | 27 | 3.7332119 | 6.48949 | T | Gr1, Gr2, Gr3 | |
| V | 3 | 2 | 27 | 40.1095432 | 6.48949 | F | Gr1, Gr2, Gr3 | |
| Y | 3 | 2 | 27 | 1.1571739 | 6.48949 | T | Gr1, Gr2, Gr3 | |
| Zr/Sc | 3 | 2 | 27 | 35.0858032 | 6.48949 | F | Gr1, Gr2, Gr3 | |
| Zr/Al2O3 | 3 | 2 | 27 | 15.8507456 | 6.48949 | F | Gr1, Gr2, Gr3 | |
| Cr/Ni | 3 | 2 | 27 | 45.6851588 | 6.48949 | F | Gr1, Gr2, Gr3 | |
| La/Sc | 3 | 2 | 27 | 56.0284574 | 6.48949 | F | Gr1, Gr2, Gr3 | |
| La/Co | 3 | 2 | 27 | 39.7896966 | 6.48949 | F | Gr1, Gr2, Gr3 | |
| Th/Sc | 3 | 2 | 27 | 41.4861711 | 6.48949 | F | Gr1, Gr2, Gr3 | |
| Th/Co | 3 | 2 | 27 | 15.5702655 | 6.48949 | F | Gr1, Gr2, Gr3 | |
| Cr/Th | 3 | 2 | 27 | 18.022396 | 6.48949 | F | Gr1, Gr2, Gr3 | |
| Sc/Cr | 3 | 2 | 27 | 0.4694586 | 6.48949 | T | Gr1, Gr2, Gr3 | |
| La/Y | 3 | 2 | 27 | 0.1640778 | 6.48949 | T | Gr1, Gr2, Gr3 | |
| (La/Lu)cn | 3 | 2 | 27 | 1.5791069 | 6.48949 | T | Gr1, Gr2, Gr3 | |
| TREE | 6 | 4 | 40 | 0.6441114 | 4.3748 | T | Gr2, Gr1, Gr5, Gr6, Gr3 | Gr4 |
| Eu/Eu* | 6 | 2 | 27 | 0.0461363 | 6.48949 | T | Gr6, Gr2, Gr1 | Gr5, Gr3, Gr4 |
| (Gd/Yb)cn | 5 | 3 | 31 | 0.3972441 | 5.20854 | T | Gr1, Gr5, Gr6, Gr2 | Gr3 |
For interpreting the geochemical data of the study area, a database for source rock geochemistry (older rocks) was constructed from the published literature (Fig. 1 – for locations and references).
4 Results
4.1 Petrography
4.1.1 Pimienta Formation (PF; Upper Jurassic)
Siltstone (Fig. 4a) mainly consists of silt-size, angular to subangular quartz and feldspar grains. Monocrystalline quartz with undulatory extinction is the dominant constituent of this petrographic type. Few grains show point and long contacts. The siltstone exhibits both k-feldspar and plagioclase grains. The pore spaces are filled with brown color materials, which indicate the prevalence of iron oxide cementation in this petrographic type.
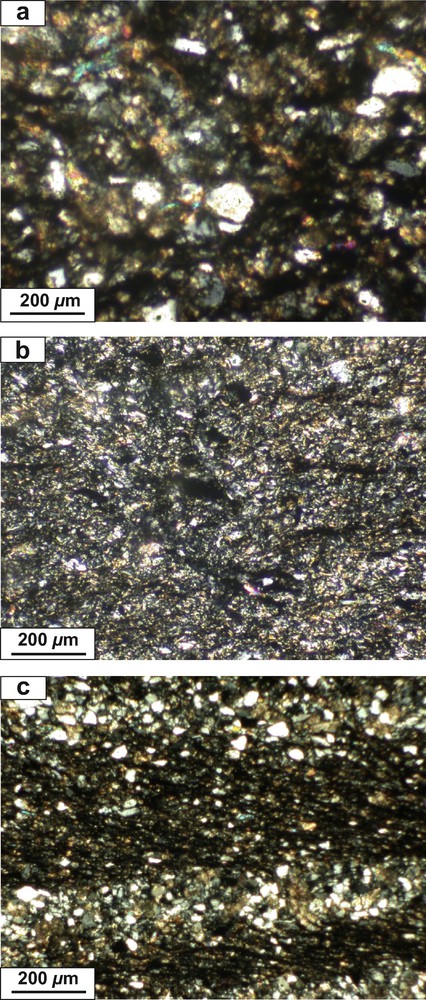
Images of thin section of the shale samples: a: siltstone (Pimienta Formation); b: argillaceous siltstone (Huayacocotla Formation); c: laminated ferruginous siltstone (Méndez Formation). Magnification: 100×. Refer text for explanation.
4.1.2 Huayacocotla Formation (HF; Upper Jurassic)
Argillaceous siltstone (Fig. 4b) mainly consists of silt-size angular quartz and feldspar grains. Framework grains are showing point and long contacts. Few subrounded grains are also noticed. Some grains are floating in the matriz. Matrix also contains microgranular quartz particles. Monocrystalline quartz with wavy extinction is identified. Polycrystalline quartz is present in minor amount, which displays straight internal boundaries.
4.1.3 Méndez Formation (MF; Lower Cretaceous)
Laminated ferruginous siltstone (Fig. 4c) exhibits various layers. The lower part is rich in fine-grained quartz and the size of these grains gradually decreased to silt grade towards the upper part of the thin section, which reveals the fining upward grading. The dark layer seen in the upper part of the photomicrograph is mainly composed of clay-sized materials. The pore spaces are filled with ferruginous materials.
4.2 Mineralogy
The XRD study indicates that the PF, HF, and MF shales consist mainly of illite and muscovite clay minerals with little quartz (Fig. 5a, b, and c). A magnetite mineral is identified in the sample EC7 from PF shale (Fig. 5a). The chemical composition measured using SEM–EDS method (qualitative analysis) reveals that the PF and HF shales are rich in phosphate minerals, probably monazite (Fig. 6a), xenotime (Fig. 6b) and/or apatite. A sample (IM10) with high content of Zr is identified in the MF shale (Fig. 6c), which may be a zircon mineral. Slight elevation in potash content is observed in the sample IM5 (Fig. 6d, MF shale).
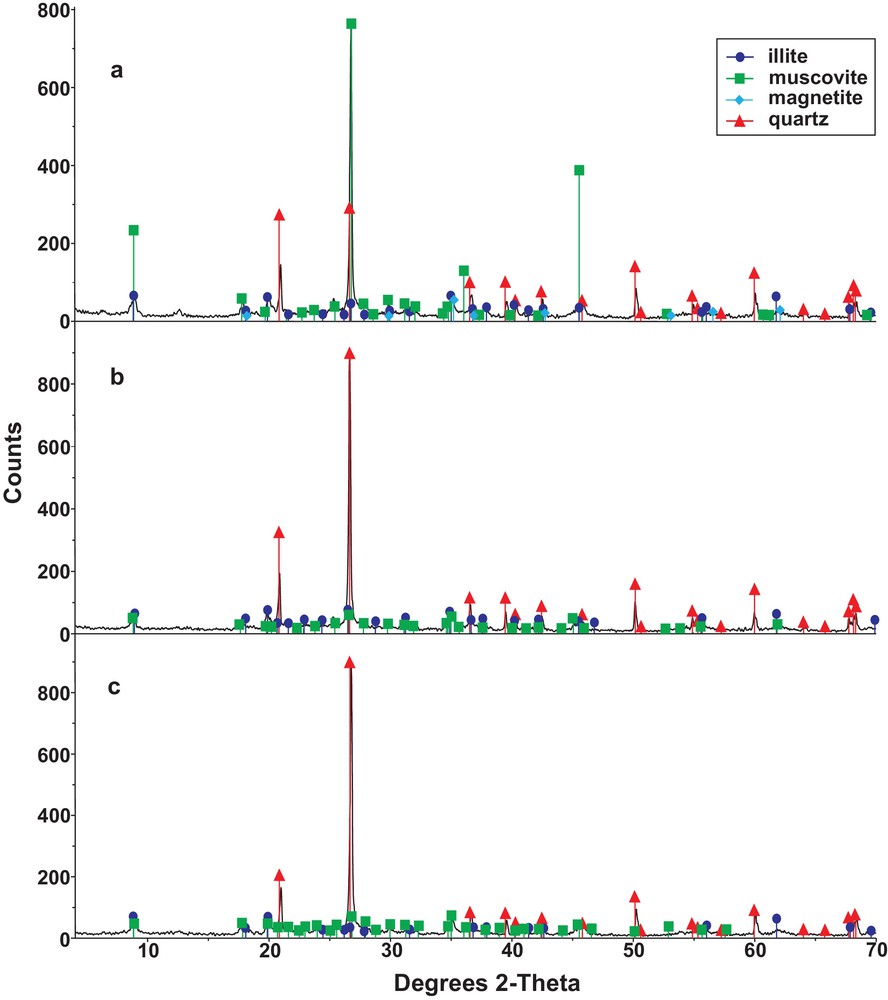
X-ray diffraction patterns of the shale samples: a: Pimienta Formation (sample EC7); b: Huayacocotla Formation (LV1); c: Méndez Formation (IM5).
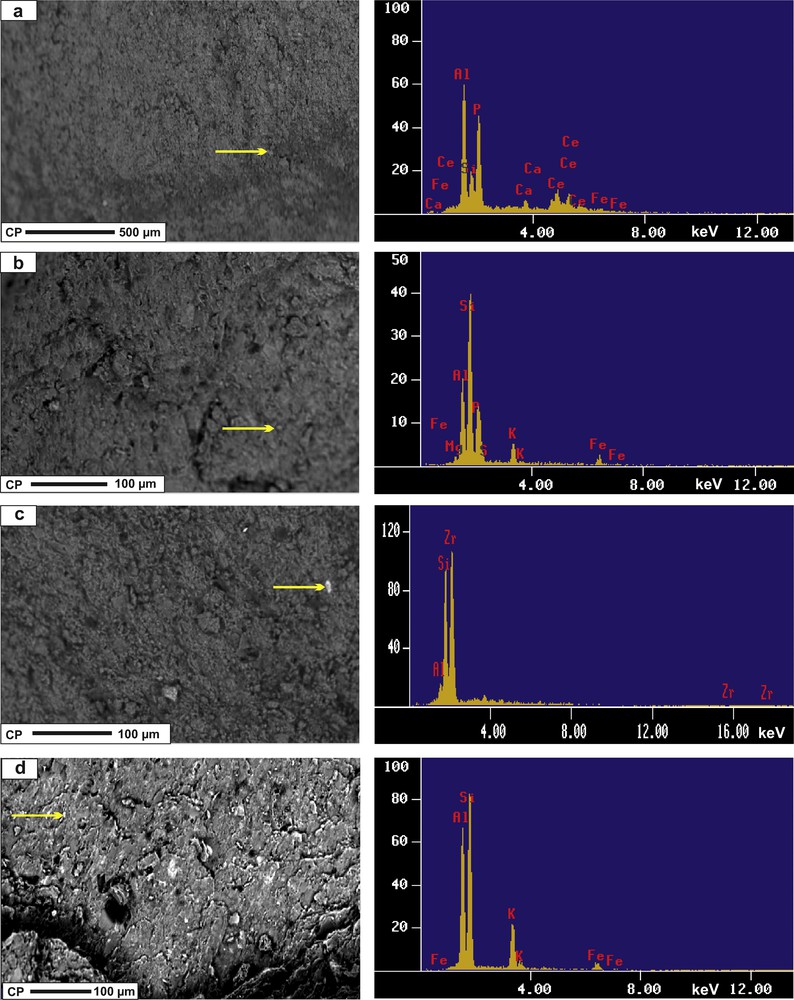
SEM and EDS spectrum for the shale samples: a: Pimienta Formation (sample EC7); b: Huayacocotla Formation (LV1); c and d: Méndez Formation (IM10 and IM5, respectively). Arrow mark shows the points where the EDS analyses were performed.
4.3 Major element geochemistry
Major element concentrations of shales are presented in Table 1. The SiO2 content is higher in the Méndez Formation (MF) (∼70.60–89.91 wt.%; the mean with one standard deviation value being 76.1 ± 6.8; number of samples n = 10), than in the Huayacocotla (HF) (58.90–78.00 wt.%; 66.8 ± 6.3; n = 10) and in the Pimienta Formations (PF) (58.70 to 67.70 wt.%; 62.71 ± 2.71; n = 10). The application of ANOVA (ANalysis Of VAriance) at 99% confidence level reveals a significant difference in SiO2 content among the three formations (Fcalc = 17.40542 and (Fcrit)99% = 6.48949, where Fcalc > (Fcrit)99% indicates that data populations are significantly different at 99% confidence level; Table 4). As expected, the Al2O3 content is greater in PF and HF than in MF shales (Table 4), as a result of the dilution effect of quartz (Cullers, 2000). The average K2O and Na2O contents are almost similar among the PF, HF, and MF shales (Table 4). The MF shales are lower in Fe2O3 (∼0.23–2.22 wt.%) and MgO (∼0.252–0.536 wt.%) contents than in PF (Fe2O3 = ∼5.10–8.50 wt.%; MgO ∼0.90–1.20 wt.%) and HF (Fe2O3 = 3.30–6.10 wt.%; MgO = 0.70–1.10 wt.%) shales. There is no statistically significant difference among the PF, HF, and MF shales in P2O5 content (Fcalc = 4.18180 and (Fcrit)99% = 6.48949, where Fcalc < (Fcrit)99% indicates that the data populations are not significantly different at 99% confidence level; Table 4).
On the Fe2O3/K2O vs. SiO2/Al2O3 chemical classification diagram (Fig. 7; Herron, 1988), the MF shales plot in the wacke, arkose, and sub-arkose fields and PF and HF shales mostly plot in the shale field. The MF shales, which plot in the arkose and sub-arkose fields is probably due to the high K2O (samples IM4 and IM5) and low Fe2O3 (IM9 and IM10) contents, respectively, compared with other MF shale samples (Table 1).
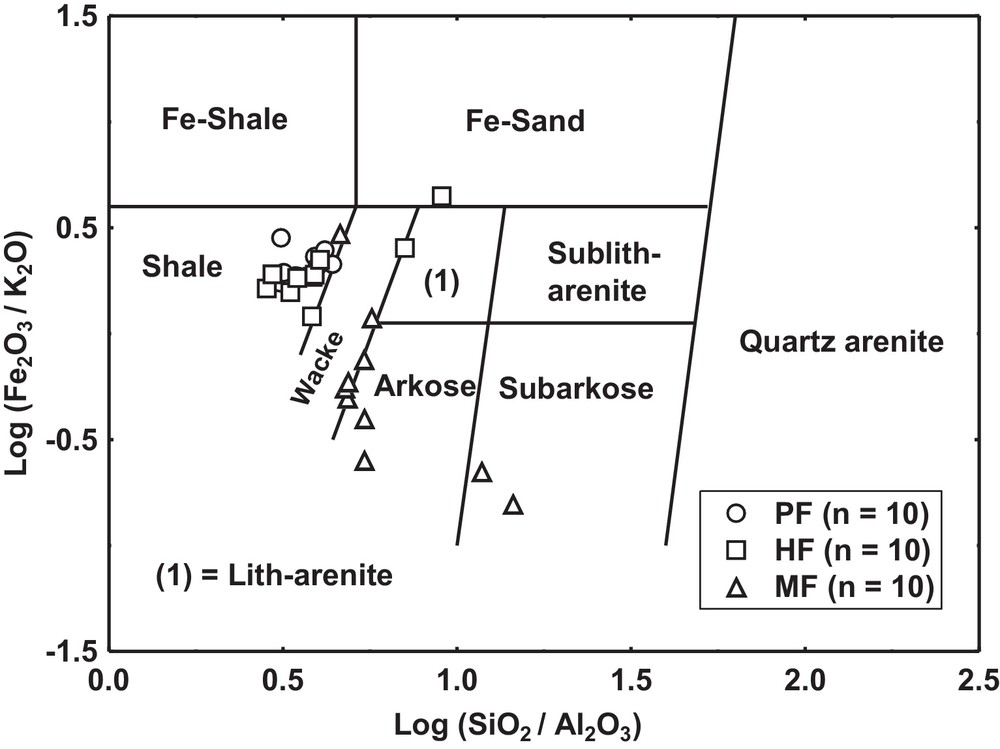
Geochemical classification diagram using log(SiO2/Al2O3)–log(Fe2O3/K2O) (after Herron, 1988). PF = Pimienta Formation; HF = Huayacocotla Formation; MF = Méndez Formation.
4.4 Trace element geochemistry
The trace elements data are provided in Table 2. The Upper Cretaceous MF shales are lower in large ion lithophile elements (LILE; Rb, Cs, Ba, and Sr) and transition trace elements (TTE; Cr, Co, Ni, V, Sc, and Cu) than in PF and HF (Fig. 8a, b, and c; Table 4) shales. In comparison to upper continental crust (UCC; Taylor and McLennan, 1985), PF and HF shales show smaller variations in trace element concentrations than the MF shales. Except for Sr, Zr, and Hf, the rest of the trace elements in the PF shales have similar composition to the UCC. In the case of HF shales, Sr is depleted and other TTE like V and Co are showing wide variation. Compared to UCC, the MF shales are enriched in Y, Zr, Nb, and Hf (Fig. 8).
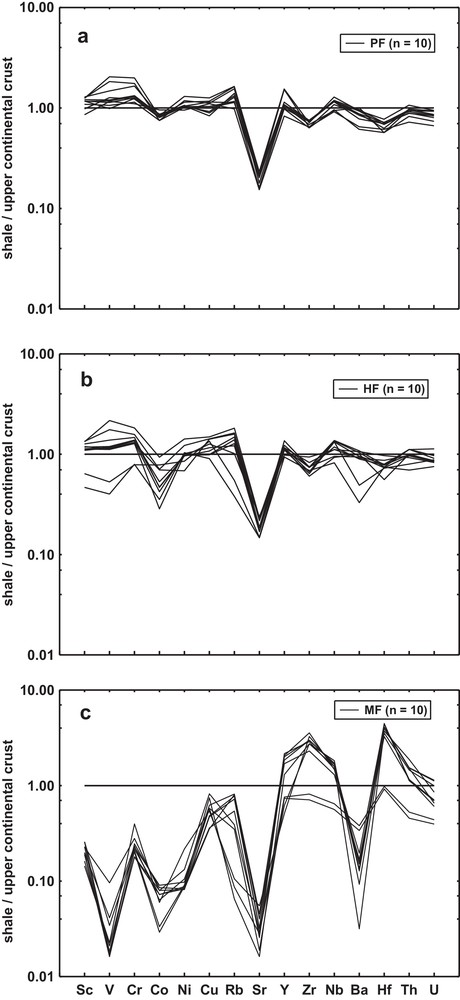
Multi-element normalized diagram for the shale samples, normalized against average upper continental crust (Taylor and McLennan, 1985). A horizontal line for shale/upper continental crust value of 1 is included for reference. a: for the Upper Jurassic Pimienta Formation (PF); b: for the Lower Jurassic Huayacocotla Formation (HF); c: for the Upper Cretaceous Méndez Formation (MF).
As correlations are concerned (Fig. 9), certain trace elements like Rb, Ba, Th, and Sr are positively correlated with Al2O3 in the PF (linear correlation coefficient r = 0.95, 0.91, 0.87 and 0.54, respectively; n = 10) and HF shales (r = 0.91, 0.99, 0.90, and 0.85; n = 10), indicating that these elements are likely fixed in K-feldspars and clays. On the other hand, the correlation of Al2O3 versus Rb, Ba, Th, and Sr is very low or negative for the MF shales (r = 0.47, 0.10, 0.17, −0.51, respectively; n = 10). Similarly, Al2O3 is correlated negatively with HFSE like Zr, Hf, and Nb in the MF shales (r = −0.18, −0.17, and −0.22, respectively; n = 10). This reveals that in the MF shales the HFSE are not likely bound in the clay minerals. The concentrations of the TTE (e.g., Cr, Ni, and V) show a strong correlation with Al2O3 for the PF (r = 0.84, 0.73, and 0.70, respectively; n = 10) and HF shales (r = 0.96, 0.39, and 0.92, respectively; n = 10). This relationship suggests that the TTE are fixed in clay minerals. On the other hand, in MF shales the concentration of Al2O3 is negatively or poorly correlated with Cr (r = –0.57, n = 10), Ni (r = −0.65, n = 10), and V (r = 0.14, n = 10), indicating that the TTE are not likely fixed in the clay minerals. These variations may suggest more detrital sediment input into the depositional basin during the deposition of the Upper Cretaceous MF shales compared with the Jurassic PF and HF shales.

A (Al2O3) – CN (CaO* + Na2O) – K (K2O) ternary diagram (molecular proportions; Nesbitt and Young, 1982). PF = Pimienta Formation; HF = Huayacocotla Formation; MF = Méndez Formation. 1This study; 2,3Taylor and McLennan (1985); 4Condie (1993). n = number of samples.
4.5 Rare earth element (REE) geochemistry
The rare earth elements (REE) data are given in Table 3, and the chondrite-normalized patterns (Taylor and McLennan, 1985) are given in Fig. 10. The average total REE (∑REE) contents are similar among the PF (178.7 ± 35.0), HF (187.6 ± 34.0), and MF (160 ± 68) shales (Fcalc = 0.6441114 and (Fcrit)99% = 4.37800, where Fcalc < (Fcrit)99% indicates that data populations are not significantly different at 99% confidence level; Table 4). Two of the MF shales contain higher SiO2 content (IM9 = 89; IM10 = 91) than the rest of the MF shales, consequently their REE compositions are low (IM9 = 41; IM10 = 63; Table 3). This could be attributed to a dilution effect of quartz (Cullers, 2000).
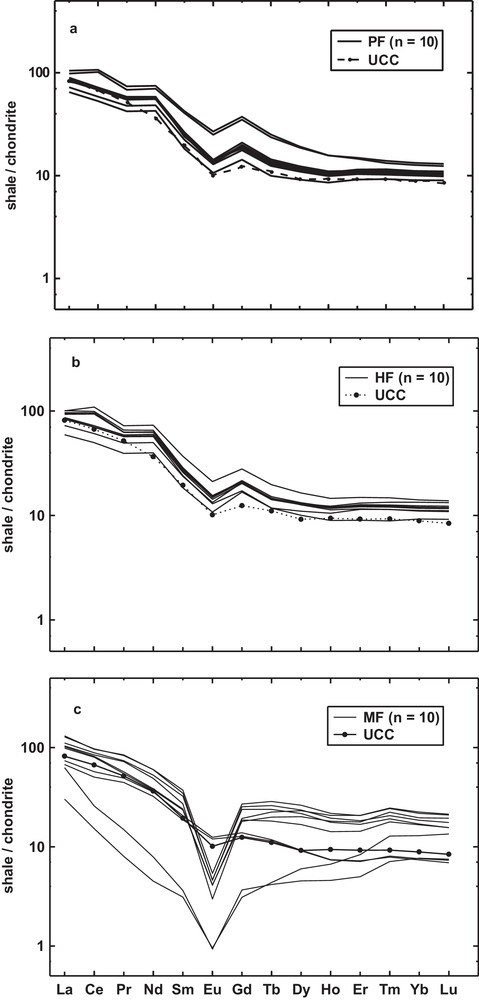
Chondrite-normalized rare earth elements plot. Chondrite normalization values are from Taylor and McLennan (1985). The average upper continental crust (UCC) value is also included for reference (Taylor and McLennan, 1985). a: for the Upper Jurassic Pimienta Formation (PF); b: for the Lower Jurassic Huayacocotla Formation (HF); c: for the Upper Cretaceous Méndez Formation (MF).
In general, chondrite-normalized REE patterns of the Jurassic PF and HF shales (Fig. 10a and b) are characterized by enriched LREE (LaCN/SmCN = 3.23 and 3.29, respectively; the subscript CN refers to chondrite-normalized values), relatively flat HREE (GdCN/YbCN = 1.99 and 1.75, respectively), and negative Eu anomalies (Eu/Eu* = 0.632 and 0.622, respectively). On the other hand, the LREE fractionation in MF shales (LaCN/SmCN) ranges from ∼3.44–17.27, but the HREE fractionation (GdCN/YbCN) ranges from ∼0.24–1.88. The MF shales have large negative europium anomalies (Eu/Eu* = 0.298 ± 0.240) (Fig. 10c). Similarly, the chondrite-normalized REE patterns of the individual samples from the Upper Cretaceous MF shales are not parallel to each other (Fig. 10c), indicating variations in the detrital sediment input during deposition.
5 Discussion
5.1 Weathering and sediment recycling
The intensity and duration of weathering in clastic sediments can also be evaluated by examining the relationship between alkali and alkaline earth elements (Nesbitt and Young, 1982). The chemical index of alteration is one of the most widely used index [CIA = (Al2O3/Al2O3 + CaO* + Na2O + K2O) × 100, using molecular proportions] with higher values suggesting more intense chemical weathering (Fadipe et al., 2011; Jayaprakash et al., 2012; Srivastava et al., 2013; Újvári et al., 2013). The CaO* represents CaO from the silicate fraction. The CaO content in the shales of this study is very low (∼0.01–2.03; Table 1), hence, the available CaO has been used for the calculation (McLennan et al., 1993). In general, the CIA value for kaolinite and chlorite is nearly 100, while it varies from 70 to 75 for average shale (Nesbitt and Young, 1982). The CIA values in the studied shales vary from ∼59 to 93 (Table 1). The difference in the average CIA values among PF (71 ± 3), HF (76 ± 6), and MF (73 ± 11) shales is statistically not significant (Fcalc = 0.7398343 and (Fcrit)99% = 6.48949, where Fcalc < (Fcrit)99% indicates that data populations are not significantly different at 99% confidence level; Table 4) and is within the range of the Post-Archaean Australian Shale values (PAAS; 70–75; Taylor and McLennan, 1985). These values indicate a moderate to intense chemical weathering in the source area. The MF shales have a wide range in CIA values (∼59–93; Table 1), indicating the combination of both mature and immature sediments, which is consistent with the dispersion observed in the SiO2/Al2O3 ratios (Fig. 7).
The CIA values are also plotted in Al2O3 – (CaO* + Na2O) – K2O (A–CN–K) triangular diagram (molecular proportion; Fedo et al., 1996; Fig. 9) which identifies the differentiation of compositional changes associated with chemical weathering and/or source rock composition (Deepthi et al., 2012; Ghosh et al., 2012). In Fig. 9, individual samples plot away from the plagioclase-K-feldspar join line, indicating moderate to intense chemical weathering in the source area. The PF shales are parallel to the A–CN line, showing the leaching of CaO and Na2O under moderate to intensive weathering processes from source rocks of the upper continental crust, e.g., granodiorite and granite. Samples plotting significantly off the predicted weathering trend (trend 1) and towards the K2O apex (trend 2) are interpreted to have likely been affected by potassium metasomatism (e.g., four MF shales), which involves post depositional conversion of kaolin to illite (Fedo et al., 1995). This conversion process produces K2O enrichment and results in lowering of CIA values. This can be corrected by simply projecting a line from the K-apex through a given data, meet until the predicted weathering trend is intersected (trend 1), which gives the premetasomatized CIA value (Fedo et al., 1995). For example, the calculated CIA values of two MF shale samples IM4 and IM5 are 59.30 and 59.11, respectively (Table 1) and their premetasomatized values are predicted to be 68.30 and 68.11, respectively (Fig. 9). Thus, the premetasomatized values of MF shales (four samples) fall in a narrow range and close to the PF and HF shales.
Nesbitt et al. (1997) illustrated that the CIA values may also be influenced by tectonism. In the present study, for MF shales, the degree of weathering is non-uniform and quite variable (∼67–93; Table 1). This spread of CIA values in MF shales is typical of non-steady state weathering conditions, which probably indicates active tectonism or rapid uplift during the Upper Cretaceous.
McLennan et al. (1993) observed that the Th/Sc ratio is a sensitive index of the bulk composition of the provenance, and the Zr/Sc ratio is a useful index of zircon enrichment. Thus, the Th/Sc vs. Zr/Sc bivariate plot can be used to discriminate the compositional variation, the degree of sediment recycling, and heavy mineral sorting (Long et al., 2012; Yan et al., 2012). On the Th/Sc–Zr/Sc diagram (Fig. 11), the shales display two compositional trends with most samples gathered near average UCC composition (trend 1), which is indicative of a minimal influence of mineral sorting. Samples plotting along trend 2 are indicative of concentration of zircon by sediment recycling and sorting. The Zr/Sc ratios for the PF (∼7.17–10.53) and HF (∼6.94–20.57) shales are significantly lower than for the MF (∼50–316) shales, suggesting a higher concentration of zircon in the latter (Fcalc = 35.0858032 and (Fcrit)99% = 6.48949, where Fcalc > (Fcrit)99% indicates that data populations are significantly different at 99% confidence level; Table 4). This fact is also supported by the larger variation of Zr/Al2O3 ratio in MF (∼10–100) shales than in the HF (∼6–15) and PF (∼6–9) shales (Fcalc = 15.85075 and (Fcrit)99% = 6.48949, where Fcalc > (Fcrit)99% indicates that data populations are significantly different at 99% confidence level; Table 4). The enrichment of Zr content, especially in the MF shales could be due to the concentration of zircon mineral. This observation is consistent with the results obtained by the SEM–EDS method (Fig. 6c). Lawlor et al. (1999) and Lopez et al. (2001) also reported the abundance of equant and elongated zircon grains in gneisses (Huiznopala area) and granites (Las Delicias Formation) exposed relatively near to the study area (Fig. 1).
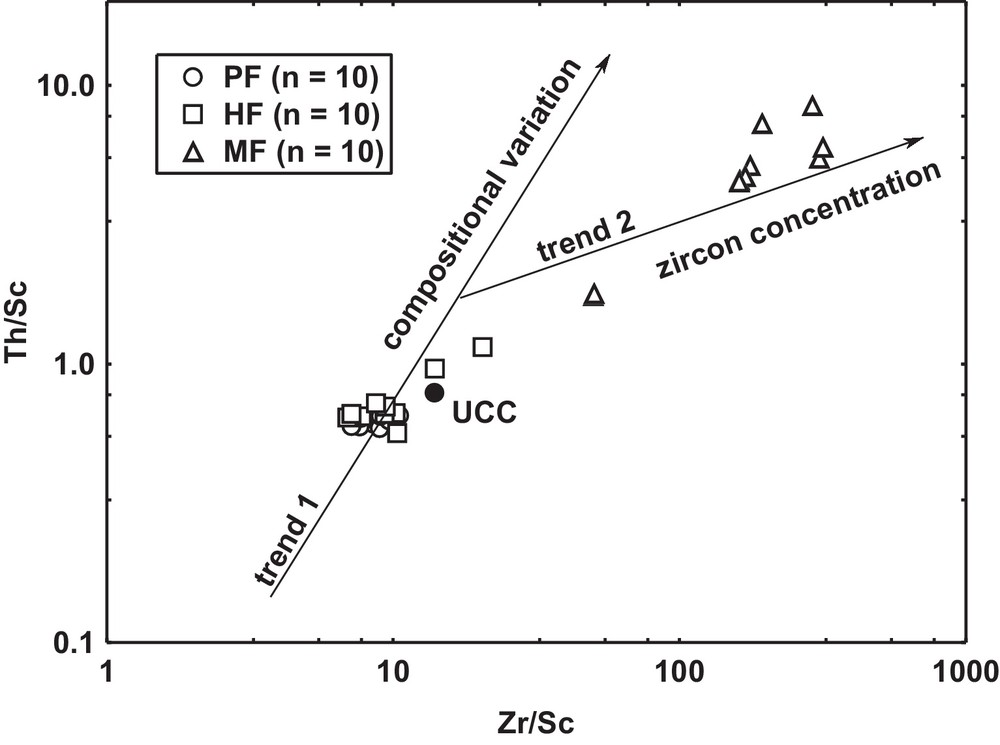
Th/Sc versus Zr/Sc bivariate plot (McLennan et al., 1993). The addition of zircon due to sediment sorting and recycling is observed in trend 2. PF = Pimienta Formation; HF = Huayacocotla Formation; MF = Méndez Formation; n = number of samples.
5.2 Provenance
The geochemistry of clastic sediments has been widely used to identify the provenance (Armstrong-Altrin et al., 2004, 2012; Cullers, 1995; Jafarzadeh and Hosseini-Barzi, 2008). The Zr concentration in clastic sediments can be used to characterize the nature and composition of source rocks (Run-sheng et al., 2012). The average Zr concentration in MF shales (475 ± 185) is higher than in PF (133.9 ± 9.3) and HF shales (139.6 ± 18.2) (Fcalc = 32.9820669 and (Fcrit)99% = 6.48949, where Fcalc > (Fcrit)99% indicates that data populations are significantly different at 99% confidence level; Table 4). The MF shales show a low positive correlation between Zr and HREE (r = 0.45), whereas correlation is absent in PF (r = −0.10) and HF (r = −0.09) shales. This suggests that the concentration of zircon has no influence on the HREE in PF and HF shales, although there may be some on MF shales.
In addition, ∑REE is positively correlated with K2O in PF (r = 0.98) and HF (r = 0.99) shales, but the correlation is poor in MF (r = 0.23) shales, suggesting that illite may be the host of REE in the PF and HF shales. The XRD data is consistent with this observation (Fig. 5). There is also a positive correlation between ΣREE and P2O5 in PF (r = 0.90) shales. This correlation, however, is poor for HF (= 0.31) and MF (r = 0.15) shales. This indicates that phosphate rich minerals such as apatite and/or xenotime may control the REE abundances in the PF shales. The SEM–EDS study also reveals a phosphate rich composition for the PF and HF shales (Fig. 6).
The Eu/Eu*, (La/Lu)cn, La/Sc, La/Co, Th/Sc, Th/Co, and Cr/Th are widely used to understand the provenance composition of the source region since REE, Th, and La abundances are higher in felsic rocks than in basic rocks, whereas, the Co, Sc and Cr contents are higher in mafic rocks than in felsic rocks (Armstrong-Altrin et al., 2004; Armstrong-Altrin, 2009; Cullers, 1994, 2000, 2002; Konstantopoulos and Zelilidis, 2012; Tijani et al., 2010). These ratios are compared in Table 5 with those of possible source rocks, the UCC, and from sediments derived from mafic and felsic rocks. In this study, the Eu/Eu*, (La/Lu)CN, La/Sc, La/Co, Th/Sc, Th/Co, and Cr/Th ratios of the PF, HF, and MF shales fall within the range of sediments derived from felsic source rocks. In addition, elevated concentrations of Cr (> 150) and Ni (> 100) and low Cr/Ni ratios (between 1.3 and 1.5) are indicative of some ultramafic rocks in the source (Garver et al., 1996). The PF, HF, and MF shales have low average Cr (116, 108, and 20 ppm, respectively), Ni (48, 45, and 5 ppm, respectively), and high Cr/Ni (∼2.1–3.3, ∼1.5–3.6, and ∼3.5–5.6, respectively) ratios. The low Cr and Ni values and the high Cr/Ni ratio indicate the absence of ultramafic detritus in the provenance (Table 2).
Range of elemental ratios of shales in this study compared to the ratios in similar fractions derived from felsic, mafic rocks, and upper continental crust.
| Elemental Ratio | Range of shales from Molango Regiona | Range of sediment from felsic sourcesb | Range of sediment from mafic sourcesb | Upper continental crustc | ||
| PF | HF | MF | ||||
| Eu/Eu* | 0.59–0.67 | 0.60–0.65 | 0.13–0.76 | 0.40–0.94 | 0.71–0.95 | 0.63 |
| (La/Lu)cn | 7.20–8.46 | 6.46–8.04 | 2.25–10.68 | 3.00–27.0 | 1.10–7.00 | 9.73 |
| La/Sc | 1.90–2.25 | 1.77–3.42 | 6.20–21.35 | 2.50–16.3 | 0.43–0.86 | 2.21 |
| La/Co | 1.46–3.01 | 2.00–6.44 | 18.28–67.37 | 1.80–13.8 | 0.14–0.38 | 1.76 |
| Th/Sc | 0.59–0.65 | 0.56–1.15 | 1.77–8.51 | 0.84–20.5 | 0.05–0.22 | 0.79 |
| Th/Co | 0.47–0.80 | 0.63–2.09 | 4.09–34.84 | 0.67–19.4 | 0.04–1.40 | 0.63 |
| Cr/Th | 10.22–16.31 | 7.78–12.94 | 0.88–4.18 | 4.00–15.0 | 25–500 | 7.76 |
The REE patterns and the size of the Eu anomalies in sediments also provide important clues on source rock characteristics. Higher LREE/HREE ratios and negative Eu anomalies are the characteristics of felsic source rocks, whereas lower LREE/HREE ratios and little and absence of Eu anomalies are characteristic of mafic rocks (Cullers, 1994). In the present study, the high LREE/HREE ratios and significant negative Eu anomalies are attributed to felsic source rock characteristics for the PF, HF, and MF shales (Fig. 10a–c). Taylor and McLennan (1985) observed that the granitic rocks formed during Phanerozoic Eon have more K-feldspar rich granites and thereby reflect less depletion of Eu, and high depletion of HREE with (Gd/Yb)CN ratio < 2. On the Eu/Eu* vs. (Gd/Yb)cn plot (Fig. 12), except two samples, the remaining samples plot in the post-Archean field with (Gd/Yb)cn = 0.24–1.98. The average REE data of the gneisses (Proterozoic Huiznopala gneiss; Lawlor et al., 1999) and granites (conglomerate-bearing layer of the late Palaeozoic Las Delicias Formation, exposed near Las Uvas, Coahuila, northeastern Mexico; Lopez et al., 2001), located relatively near to the study area (Fig. 1 – for locations) are also shown in this diagram (Fig. 12). The shales of this study plot close to the average granite (Lopez et al., 2001) from the Late Palaeozoic Las Delicias Formation (Fig. 1). This diagram further illustrates the larger negative Eu anomalies in the MF shales (Eu/Eu* = 0.13–0.76) compared with the PF (Eu/Eu* = 0.59–0.67) and HF (Eu/Eu* = 0.60–0.65) shales (Table 3). The large negative Eu anomaly in the MF shales is most probably due to the depletion of plagioclase. The ANOVA test at 99% confidence level for ∑REE content demonstrates that the studied shales are compositionally similar to the gneiss (Lawlor et al., 1999) and granite (Lopez et al., 2001) rocks, exposed relatively close to the study area (Fcalc = 0.64411 and (Fcrit)99% = 4.37800, where Fcalc < (Fcrit)99% indicates that data populations are not significantly different at 99% confidence level; Table 4).
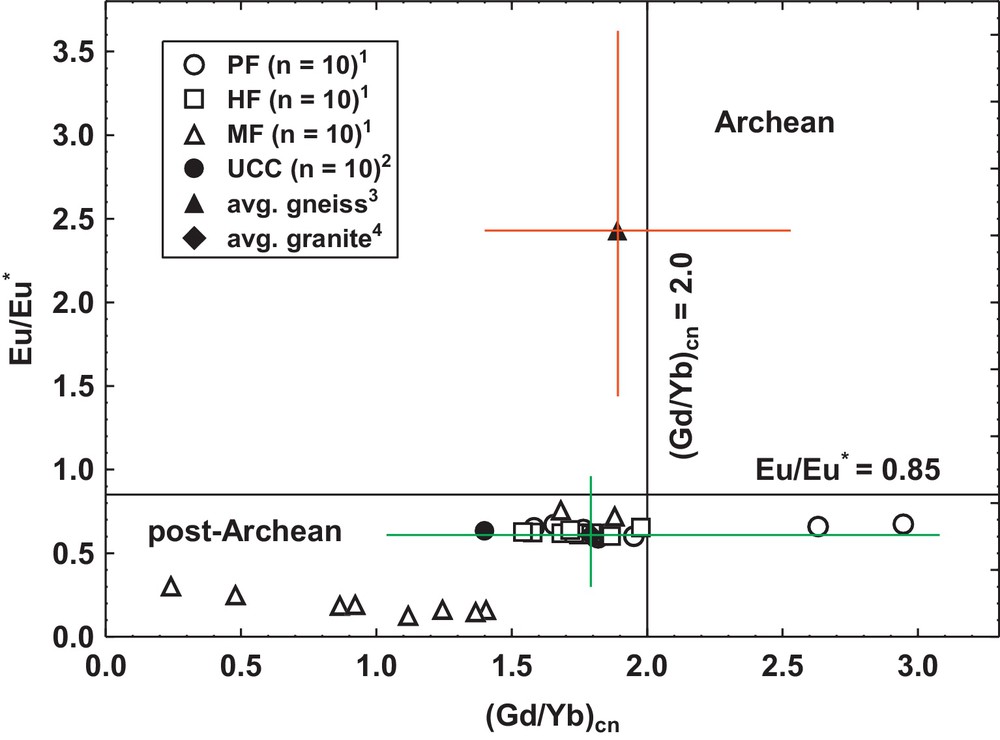
Plot of Eu/Eu* versus (Gd/Yb)CN for the shales of the Pimienta (PF), Huayacocotla (HF), and Méndez Formations (MF). Fields are after McLennan and Taylor (1991). 1Shales of this study; 2Upper continental crust (Taylor and McLennan, 1985); 3Proterozoic Huiznopala gneiss (Lawlor et al., 1999); 4Conglomerate-bearing bed of the Late Palaeozoic Las Delicias Formation, exposed near Las Uvas, Coahuila, northeastern Mexico (Lopez et al., 2001). Refer to Fig. 1 for location of the source areas used for comparison. n = number of samples.
Lopez et al. (2001) stated that the isotopic studies and U–Pb dating of zircons from Precambrian granitoids that occur as cobbles and boulders in the Palaeozoic conglomerate exposed in the state of Coahuila have Grenvillian crystallization ages from 1232 ± 7 to 1214 ± 2 Ma. Therefore, based on Lopez et al. (2001), the present study provides a clue that the detritus of the Delicias Formation and shales of the Molango region were possibly derived from a similar source.
5.3 Tectonic setting
Tectonic setting discrimination diagrams proposed by Bhatia (1983) and Roser and Korsch (1986) have been extensively used in sedimentary geochemistry to identify the tectonic setting of unknown sedimentary basins (Purevjav and Roser, 2012; Yan et al., 2012). However, in recent years, tectonic discrimination based on major elements has received considerable criticism (Armstrong-Altrin and Verma, 2005; Ryan and Williams, 2007), whereas schemes that depend on trace elements have been considered as relatively reliable (LaMaskin et al., 2008). Most conventional bivariate and ternary tectonic discrimination diagrams are plagued by the incorrect statistical data handling (Agrawal and Verma, 2007; Verma, 2010). Nevertheless, instead of using major element based diagrams, the trace elements discrimination diagram of Bhatia and Crook (1986) is used to infer the tectonic setting. On the Sc/Cr-La/Y diagram (Fig. 13) most of the studied shale samples plot in the passive margin field, except few MF shale samples, which fall in the continental island arc field with scatter.
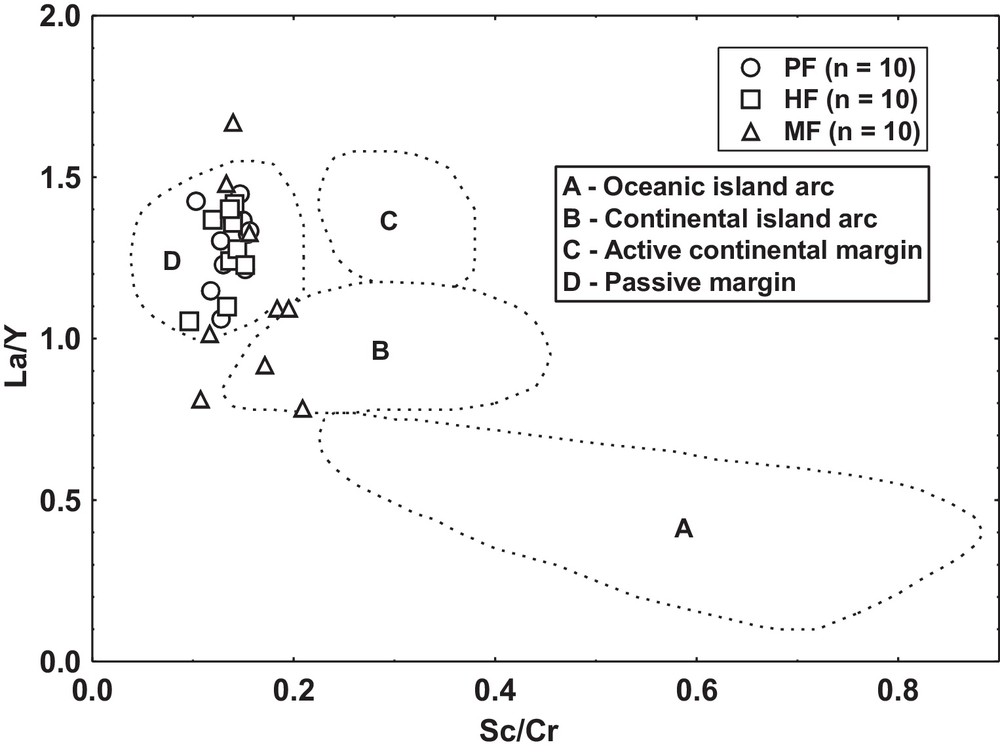
Sc/Cr-La/Y bivariate plot of Bhatia and Crook (1986).
The tectonic environments can also be inferred based on the REE distribution in clastic sediments (Bhatia, 1985; McLennan and Taylor, 1991; McLennan et al., 1993). Bhatia (1985) documented that passive margin is typically characterized by uniform REE patterns similar to average PAAS (Taylor and McLennan, 1985) with pronounced negative Eu anomaly, while sediments from active continental margin display fractionated REE patterns with wide range of negative Eu anomaly. In the present study, the PF and HF shales show relatively similar REE patterns, with pronounced negative Eu anomalies (Eu/Eu* = ∼0.59–0.66), which favour for the passive margin, probably suggesting the Jurassic extensional event. On the other hand, fractionated REE patterns (ΣREE = ∼41–237) and wide range in Eu anomaly (Eu/Eu* = ∼0.130–0.762) of the MF shale samples may suggest an active tectonism, probably an uplift, during the Upper Cretaceous (Table 3). However, further research is needed to infer exactly the tectonic setting of the study area.
The studied shales of the Molango region, Mexico, are examples for a regional study mentioned in recent works by Anderson et al. (2012), Calas and Brown (2011), and Chabaux and Paquet (2012). These works highlight the necessity of having a good knowledge on the regional geology, related to the earth surface processes, such as for instance source-area weathering, provenance, palaeoclimate, and tectonic environments, in order to infer the depositional conditions, recycling and/or potential exploration of petroleum.
6 Conclusion
The chemical index of alteration (CIA) values of the studied shale samples indicate that the intensity of chemical weathering in the source area was probably moderate to intense. The Eu/Eu*, (La/Lu)cn, La/Sc, La/Co, Th/Sc, Th/Co, and Cr/Th ratios reveal that the shales were derived from mostly felsic source rocks. The low Cr and Ni contents and high Cr/Ni ratio suggest an absence of ultramafic components in the provenance. The chondrite-normalized REE patterns of the shales are characterized by enriched LREE, relatively flat HREE, and negative Eu anomalies. The large negative Eu anomalies, high Zr, Hf contents and Zr/Al2O3 ratio in the MF shales indicate a more felsic nature than the HF and PF shales. The compositional similarity among the three formations (PF, HF, and MF) is tested statistically by the application of ANOVA (ANalysis Of VAriance) at 99% confidence level to avoid misinterpretation.
The present study provides a clue that the detritus of the Delicias Formation and shales of the Molango region were possibly derived from a similar source. The trace element concentrations of PF and HF shale samples suggest a passive margin setting, probably indicating the Jurassic extensional event. A wide spread of CIA values and highly fractionated REE pattern of the MF shales may suggest the unstable tectonic regime with little sediment mixing during the deposition of the Upper Cretaceous MF shales.
Acknowledgement
This work is part of the BSc thesis completed by the co-authors Adriana Cruz-Martínez and Gladis Avila-Ramírez. We express our gratitude to the laboratory technicians Eduardo Morales de la Garza, Susana Santiago-Perez, Héctor M. Alexander-Valdés, and Ricardo Martinez for their invaluable assistance. We thank the staffs Patricia Girón García for XRD analysis and Carlos Linares-López for SEM–EDS study, which helped to revise the manuscript within time. The authors are grateful to Elisa Liliana Hidalgo and Olmedo Natalhy-Pineda for the assistance during SEM–EDS study. Rufino Lozano-Santa Cruz, geochemist, Institute of Geology, UNAM (Universidad Nacional Autónoma de México), is greatly thanked for chemical analysis. Special appreciation goes to Lic. Arturo Ferrer Méndez Flores, librarian, UNAM for providing the geology map. We are grateful to the reviewers Peter Stille and Robert L. Cullers and Associate Editor François Chabaux for numerous helpful comments to improve our paper. Yong Il Lee is grateful for the financial support from the Korea Research Foundation (grant No. 2010-0009765). This research was supported financially by the Instituto de Ciencias del Mar y Limnología, Universidad Nacional Autónoma de México, Institutional (Project No. 616; contribution No. 10) and PAPIIT (Project No. IA101213; contribution No. 2) Projects. This paper has been formatted according to the preceding guidelines of C. R. Geoscience.