

1 Introduction
The intrinsic attenuation of seismic waves mainly results from the friction between the particles and fluid diffusion of the medium during the passage of the seismic wave. Due to this friction, the mechanical energy is converted into heat. The intrinsic attenuation is usually quantified as the inverse of the quality factor, Q, which is directly related to the inverse of the energy loss per cycle, (φ) divided by the total energy (W) at the same cycle:
| (1) |
The intrinsic attenuation can be also quantified through the absorption coefficient α, which is related to the amplitude A(x) of the attenuated waves at the distance x:
| (2) |
The mechanism behind the intrinsic attenuation is very complicated and it is still not very well understood. However, several laboratory and in situ studies have attempted to characterize intrinsic attenuation. These studies showed a clear dependence of intrinsic attenuation upon the physical properties of the media, such as grain size and porosity (Hamilton, 1972; McCann, 1969; Shumway, 1960), as well as upon the presence of fluid and the amount of saturation in the sediments (Bouchaala and Guennou, 2012; Nur and Simmons, 1969; Toksöz et al., 1979).
The time necessary for the system perturbed by wave passage to attain its equilibrium is called relaxation time. At high frequency, the relaxation time is bigger than the wave period, so during the wave passage the system has not enough time to return to its equilibrium; therefore, the internal friction caused by the relative movement of the fluid toward the solid has a significant contribution to wave attenuation. However, at low frequency, the relaxation time is smaller during the wave passage than during the wave period; therefore, the system has enough time to return to its equilibrium. In this case, the contribution of the internal friction to wave attenuation is not significant. The close relationship between the physical properties of the media and the attenuation makes this parameter very useful for characterizing and investigating the natural media. The estimation of the attenuation is also useful for amplitude correction, which enhances the quality of seismic images.
A biased estimation of the intrinsic attenuation can result in poor estimation and interpretation of the intrinsic properties of the natural media. An accurate estimation of this parameter requires a good quality of raw data, robust methodology and also the repeatability to confirm the results. The Vertical Seismic Profile (VSP) dataset are known to be nearly ideal for attenuation studies. For example, Q estimation from VSP dataset has been carried out successfully in a number of studies (e.g., Ganley and Kanasewich, 1980; Jansen et al., 1985; Pevzner et al., 2012; Stainsby and Worthington, 1985).
Several methods and techniques were developed to estimate Q from the VSP dataset, either in the time domain or in the frequency domain. For example, in the time domain the rise time (Gladwin and Stacy, 1974) and amplitude decay methods (McDonal et al., 1958; Tonn, 1991) are widely used, and in the frequency domain the spectral-ratio (Bath, 1974) and the frequency shift methods (Quan and Harris, 1997) are popular.
The methods mentioned above give an estimation of the apparent attenuation, which is the sum of the intrinsic and the scattering attenuations (Schoenberger and Levin, 1974):
| (3) |
Unlike intrinsic attenuation, scattering is an elastic phenomenon, which is due to a redistribution of the energy in the space because of the medium heterogeneities without energy loss. We note from equation (3) that as for the intrinsic attenuation, the scattering can be also quantified through a quality factor, Qscattering. Usually scattering attenuation is computed in the elastic domain from the velocity and the density of the medium layers obtained from the sonic and density logs, independently from the apparent attenuation (O’Doherty and Anstey, 1971; Pevzner et al., 2013). Finally, the intrinsic attenuation can be estimated by subtracting the scattering attenuation from the apparent attenuation—see equation (3).
Several studies have been conducted on scattering and intrinsic attenuation in clastic rocks, but very few in carbonate rocks (e.g., Adam et al., 2009). Until now, no attenuation profile has been estimated or at least published in the UAE subsurface formations. Hence, this study provides a first estimation of the attenuation profile of subsurface carbonate rocks in Abu Dhabi. Therefore, we cannot compare our results to those of any previous study. Accordingly, to check the reliability of our results, we estimated the Qapparent profile using two methods, one in the time domain (amplitude decay method) and the other in the frequency domain (spectral-ratio method).
2 Survey area
2.1 Geological setting
The VSP survey was acquired from March to April 2007 over an onshore oilfield in the Emirate of Abu Dhabi in the United Arab Emirates, located about 80 km southwest of Abu Dhabi Island (Fig. 1a). The producing zones of the oilfield are all within a series of stacked reservoirs of the Thamama Group (Barremian to Late Aptian). However, the VSP array extended only up to Simsima and did not reach the Thamama reservoirs.
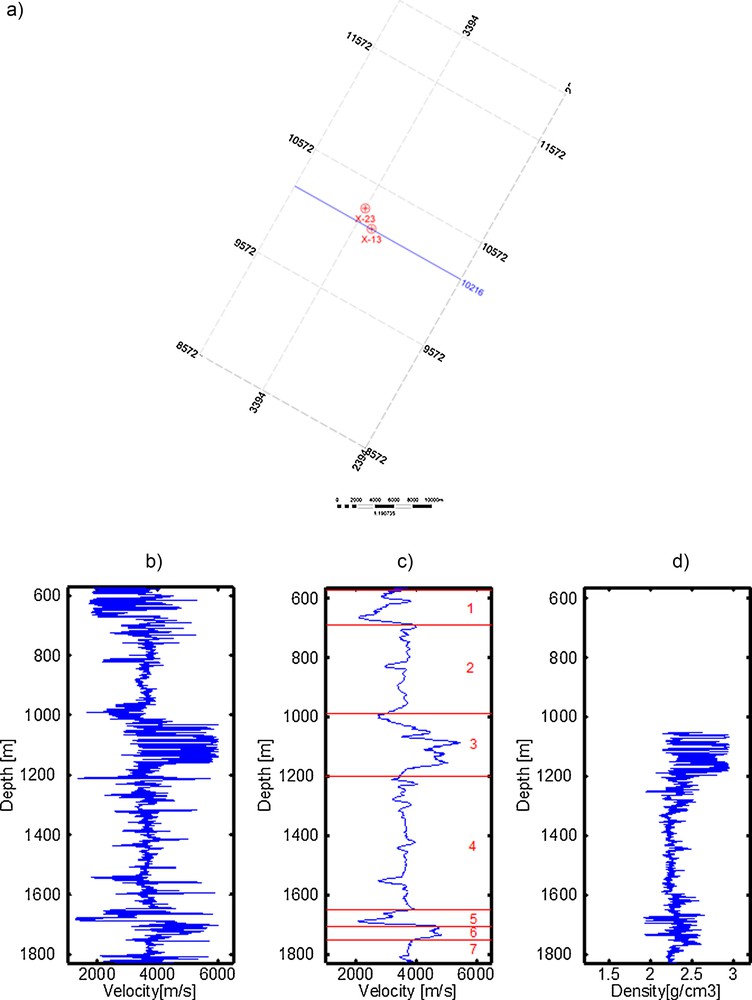
(a) Geographical position of the wellbore X-13. The seismic section shown in Fig. 8 is indicated by the blue line. (b) Sonic log of well X-13. (c) Averaged sonic log and identification of units. Each unit is indicated by a number and its thickness. Unit 1 is the lowest part of the Miocene Clastic Formation, unit 2 is the Dammam Formation, unit 3 is the Rus Formation, unit 4 is the Umm-Er-Radhuma Formation, and units 5 to 7 belong to the Simsima Formation. (d) Density log of well X-13. Note the upper 400 m of the density log is missing. (For interpretation of the references to colour in this figure legend, the reader is referred to the web version of this article).
From the sonic logs (Fig. 1b and c), we defined seven units that vary in thickness from 55 m to 450 m. The first two upper units are Miocene in age and consist of clastic sediments including mudstone, siltstone, and conglomeratic sandstone with some shales and limestone (Alsharhan and Nairn, 1995; Sharland et al., 2004). The third unit is Eocene in age. The upper part of the unit, the Dammam Formation, consists of marly limestone with some dolomite and gypsum. The lower part, the Rus Formation, consists of dolomite and limestone with crystalline anhydrite and some shale (Rizk and Alsharhan, 2003; Whittle et al., 1996). The fourth unit, the Umm-Er-Radhuma Formation, is Palaeocene–Eocene in age. The lower part of the unit consists of thin beds of shales, while the upper part comprises argillaceous and dolomitic limestones (Alsharhan, 1989). The three lower units are all within the Simsima Formation of Maastrichtian age. The units are very heterogeneous and consist of bioclastic packstones, wackestones, grainstones, microcrystalline dolomite and dolomitic limestone (Alsharhan and Nairn, 1990).
2.2 Data acquisition
The VSP survey was acquired from well X-13 (Fig. 1a), which contains a suite of logs including sonic and density logs. The objective of the survey was to construct a high-resolution structural and stratigraphic seismic image around the wellbore. The survey consisted of 125 levels of three components geophones spaced 15 m apart and spread depth from the surface to 1830 m. Two vibrators were used to generate broadband sweeps (6–120 Hz).
We selected the vertical component of the down-going waves from the zero-offset dataset to estimate the apparent attenuation profile. The down-going waves have a good signal-to-noise ratio. In addition, the amplitudes of the seismic waves were preserved, which is an imperative condition for attenuation estimation. Seventy-four traces were selected for our seismic attenuation study (Fig. 2a). The upper 51 traces were noisy due to the casing effect. From the picking times of down-going waves, we determined the average seismic velocity of each unit using the slope of the curve of the picking time versus the offset (Fig. 2b). The velocities of the units vary from 3445 m/s to 4291 m/s.
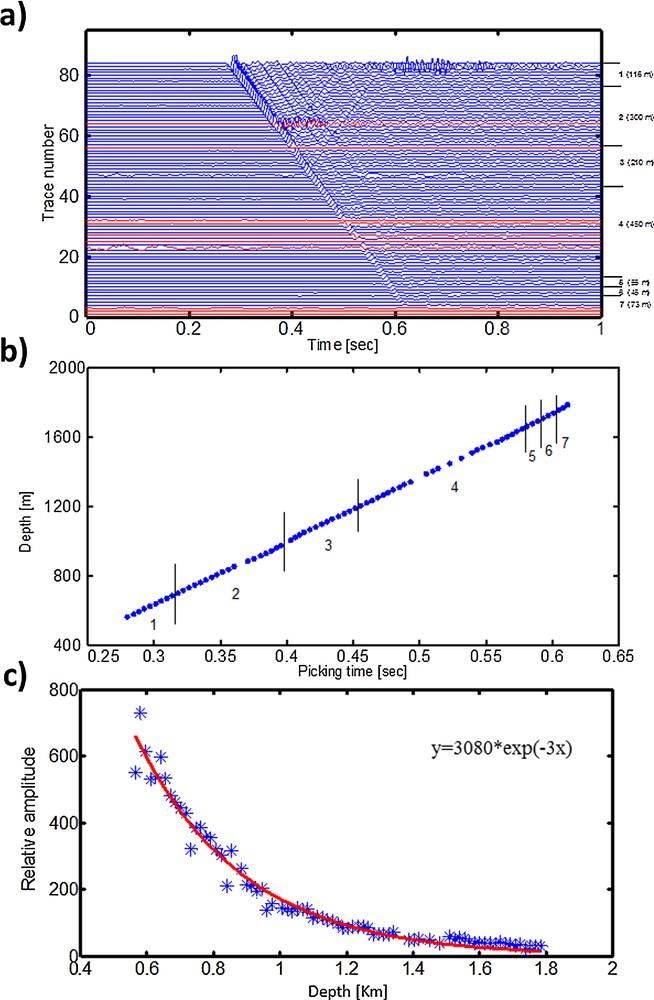
(a) A zero-offset shot gather. The thickness of each layer is displayed. The colour red highlights the bad traces. (b) Offset versus picking time curve of the shot gather. The numbers (1 to 7) indicate the same layers as in Fig. 1c. (c) Amplitude of corrected (geometrical spreading correction) shot gather, versus the offset (blue) with an exponential fitting (red). (For interpretation of the references to colour in this figure legend, the reader is referred to the web version of this article).
3 Methodology
First, we estimated the apparent and the scattering attenuation from down-going compressional waves, and sonic and density logs. We then subtracted the scattering attenuation from the apparent attenuation (see equation (3)) to deduce the intrinsic attenuation.
3.1 Apparent attenuation
We used two methods to estimate the Qapparent profile to check the repeatability and the stability of the results. The first method is in the time domain, namely amplitude decay method, and the second one in the frequency domain, namely the spectral-ratio method. These two methods are valid under the assumption that the quality factor is independent of the frequency.
After applying the geometrical correction (to remove the geometrical spreading effect), the quality factor in the amplitude decay method is estimated from the amplitude ratio of two waves recorded at two different distances x1 and x2 (McDonal et al., 1958; Tonn, 1991).
| (4) |
In the spectral-ratio method, the quality factor is estimated from the slope of the spectrum ratio (S2/S1) of two waves recorded at two neighbouring receivers, in a selected frequency range (Bath, 1974).
| (5) |
| (6) |
3.2 Scattering attenuation
The scattering is caused by the heterogeneities in the medium, which implies a spatial change in the density and the velocity of the wave. We estimated the scattering attenuation using the generalized reflection–transmission matrix forward model (Kennett, 1983). The model is used for plane layered and laterally homogeneous media, therefore it is suitable for the estimation of 1D scattering. Bouchon (1981) adapted the method for the frequency domain and with an inverse Fourier transform to obtain the response of the stratified medium in the time domain. Dietrich (1988) developed a code, called SKB, based on this method. We used the SKB to estimate the scattering attenuation.
3.3 Application and results
After applying the geometrical spreading correction, the equation (2) can be written as:
| (7) |
The curve of the amplitude versus the offset shows an exponential decay (Fig. 2c), which proves the attenuating behaviour of the medium.
After several tests, we chose a rectangular window of length 0.018 s to extract the down-going waves, 0.011 s before and 0.007 s after the time corresponding to the maximum amplitude (Fig. 3a–c). This window length is sufficient for all traces as it excludes the noise without affecting the signal. We estimated the apparent attenuation between each two neighbouring receivers. The results for each unit are then averaged. For few receiver pairs it was not possible to estimate the apparent attenuation using the spectral-ratio or/and amplitude decay methods. This is because their amplitude ratio is bigger than 1 in equation (4) or because they give a positive slope in equation (5). This might be explained by the contamination of down-going waves recorded at these receiver pairs with the interference effect. However, generally both spectral-ratio and amplitude decay methods give reliable results. Fig. 4a shows an example of a linear fitting of the spectral-ratio of two traces recorded at two neighbouring stations versus frequency. Fig. 4b illustrates the apparent attenuation profiles derived from the amplitude decay and the spectral-ratio methods. The profiles show a good agreement in the variation of 1/Qapparent between the two methods. However, they do not give the same results. The reason for this difference is unclear; however it might be due to the fact that the two methods do not have the same sensitivity to certain parameters such as the noise and the sampling rate. Furthermore, the profiles indicate very high apparent attenuation in the unit between 1700 m and 1750 m (Fig. 4b). In this unit the 1/Qapparent reaches its maximum (0.076 for spectral-ratio and 0.064 for amplitude decay). The unit is located on the top of Simsima Formation, which consists of bioclastic packstones, wackestones, grainstones, microcrystalline dolomite and dolomitic limestone (Alsharhan and Nairn, 1990). The lowest values of 1/Qapparent (0.01 for spectral-ratio and 0.012 for amplitude decay) are evidenced in the Umm–Er-Radhuma Formation, located between 1200 m and 1650 m (Fig. 4b). This formation consists mainly of shale and limestone (Alsharhan, 1989).
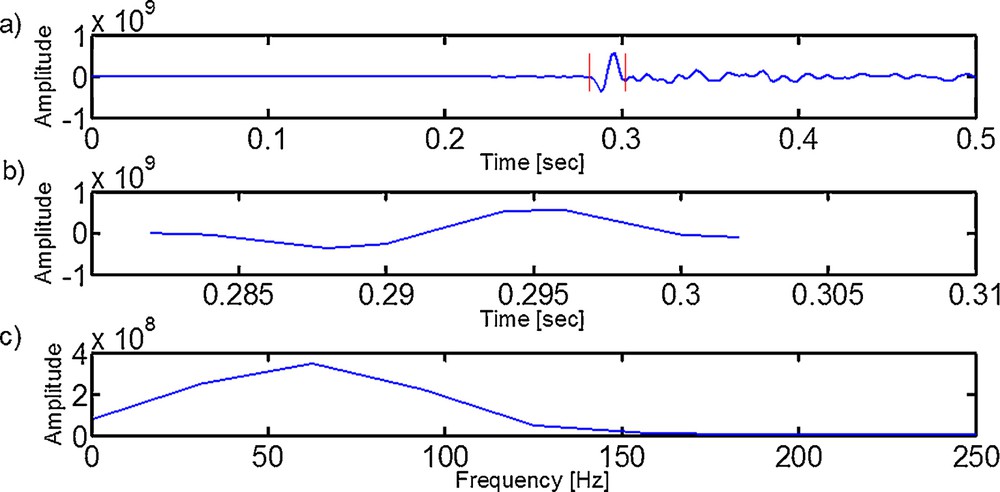
(a) An example of an extracted down-going wave (trace 82). The cutting window is bordered by the red lines. (b) Zoom on the down-going wave. (c) Spectrum of the down-going wave. (For interpretation of the references to colour in this figure legend, the reader is referred to the web version of this article).
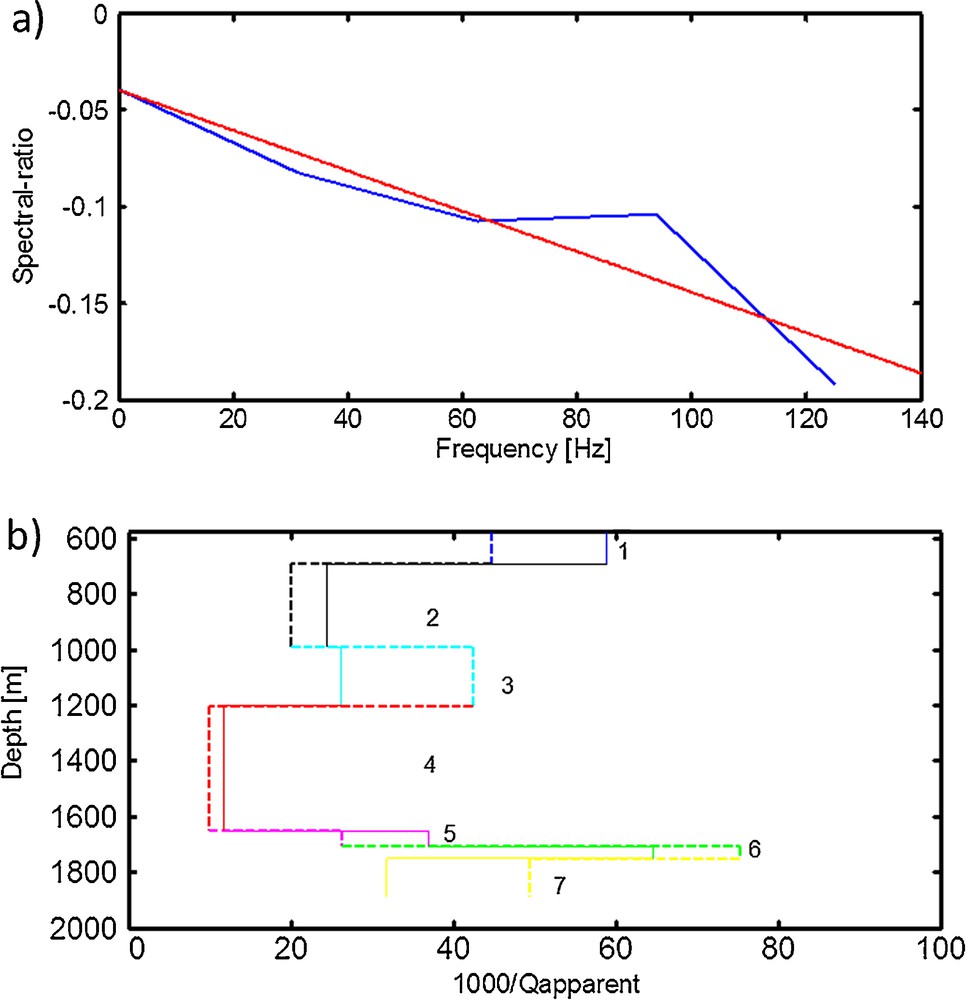
(a) An example of a spectral-ratio (blue) of two down-going waves recorded at two neighbouring stations, with linear fitting (red). (b) Apparent attenuation determined using the spectral-ratio method (solid lines) and the amplitude decay method (dashed lines). Unit 1 is the lowest part of the Miocene Clastic Formation, unit 2 is the Dammam Formation, unit 3 is the Rus Formation, unit 4 is the Umm-Er-Radhuma Formation, and units 5 to 7 belong to the Simsima Formation. (For interpretation of the references to colour in this figure legend, the reader is referred to the web version of this article).
To estimate the scattering attenuation we generated synthetic seismograms in thin-layered elastic model constructed from the sonic and density logs (Fig. 1b and d). The upper 400 m of the density log is missing from the well. We, therefore, plotted logarithmic curve of the density versus the velocity (Fig. 5) for the entire profile. We obtained the following relationship:
| (8) |
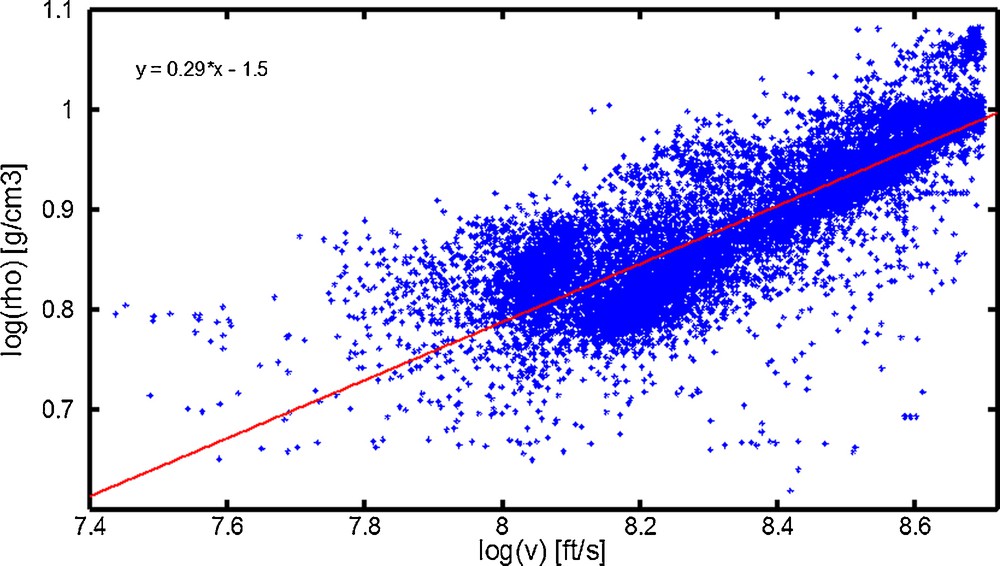
Logarithmic curve of the sonic velocity versus the density (blue) for the entire sonic log, with a linear fitting (red). (For interpretation of the references to colour in this figure legend, the reader is referred to the web version of this article).
The coefficients of the above equation are very close to those of Gardner's equation (Gardner et al., 1974). We, therefore, used the above equation to estimate the density of missing upper part of the log. Even though our method to complete the density profile is approximate, we believe that the error in the computed densities is insignificant on the estimation of the scattering attenuation. The latter is derived from the reflection–transmission coefficients between the fine layers, which are dominated more by velocities than by density contrast.
A total of 8197 layers were generated assuming that every sample interval of the sonic and density logs represents a separate layer. For each layer and for each input values of Qintrinsic (e.g., 40, 60, 80, 100, 1500, 10,000), we computed synthetic seismograms. The scattering attenuation of each layer is determined from the intercept of the curve 1/Qapparent computed from the synthetic seismograms versus the corresponding values of the 1/Qintrinsic (Fig. 6a and b).
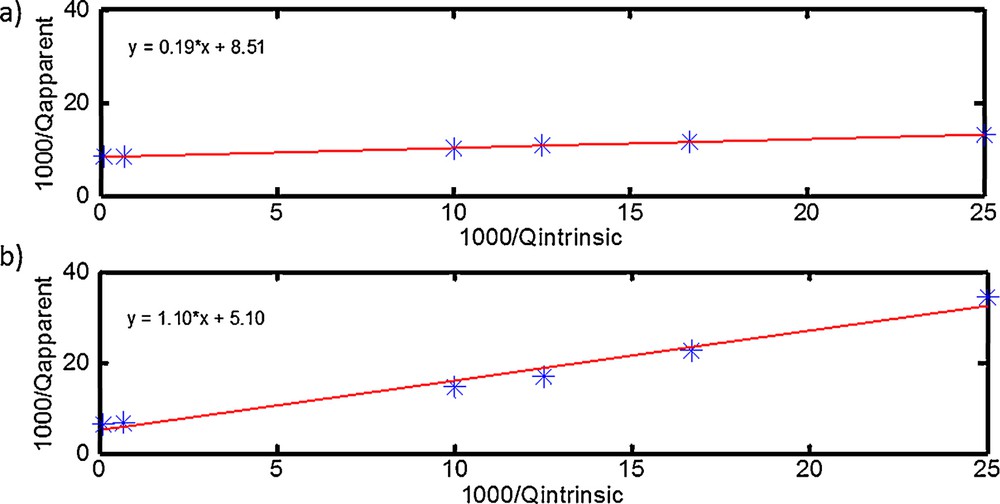
Example of scattering attenuation estimation (Umm-Er-Radhuma Formation) from the intercept of the linear fitting (red line) of the curve displaying 1/Qapparent. (For interpretation of the references to colour in this figure legend, the reader is referred to the web version of this article).
As it is shown in equation (3), the intrinsic attenuation profile should be estimated from the subtraction of scattering from apparent attenuation. However, the latter is estimated from the VSP data, which has a frequency range from 6 to 120 Hz, and scattering is estimated from the sonic log that has a frequency range from 5 to 18 kHz. Hence the following question must be asked, is it consistent to compare the two profiles, apparent attenuation and scattering, which were constructed from different frequency ranges?
Typically, an upscaling should be applied to predict the elastic wave velocities at lower frequencies from the velocities at higher frequencies. This upscaling is based on some averaging techniques such as volume and statistical averaging (Muller and Shapiro, 2001) and Backus averaging (Backus, 1962). However, these methods remain mathematical tools and can bias the results, especially in strongly heterogeneous areas as the carbonate rocks media.
To estimate the scattering in the frequency range of the VSP data (6–120 Hz) we computed the interval velocities from differential picking times of the down-going waves and the distances between each two neighbouring receivers. This resulted in the velocity profiles of 73 samples, whereby each sample can be assumed to be an independent layer. As in the case of the sonic log, we used the SKB code to generate synthetic seismograms from a layered elastic model constructed from the 73 interval velocities and from the corresponding densities. Lastly the scattering of each layer is estimated from the intercept of the curve of apparent attenuation versus intrinsic attenuation. The scattering profiles derived from VSP data and sonic log (Fig. 7a and b) show almost the same variation between the layers. However, scattering estimated from the sonic log is bigger than that estimated from VSP data.
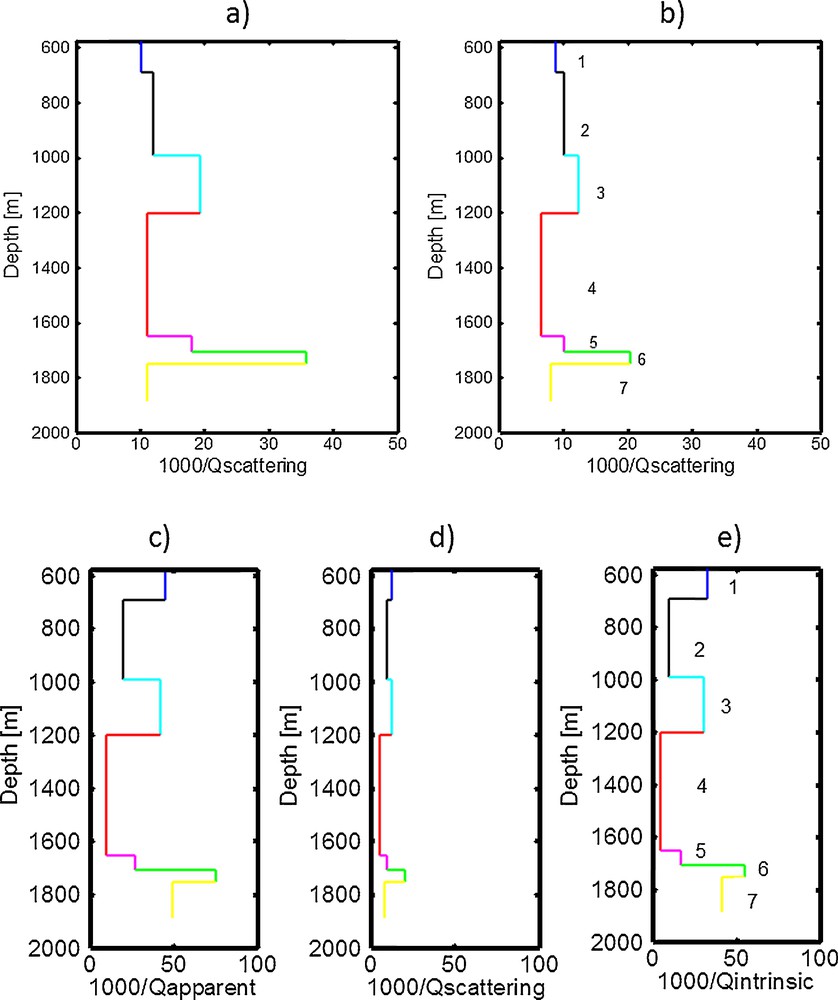
(Colour online.) (a) Scattering attenuation profiles estimated from sonic log. (b) Scattering attenuation profiles from VSP data. (c) Apparent attenuation determined using the spectral-ratio method. (d) Scattering attenuation profile determined from VSP data. (e) Intrinsic attenuation profile. Unit 1 is the lowest part of the Miocene Clastic Formation, unit 2 is the Dammam Formation, unit 3 is the Rus Formation, unit 4 is the Umm-Er-Radhuma Formation, and units 5 to 7 belong to the Simsima Formation.
We observe also that unit 6 (Simsima Formation) located at depths between 1700 m and 1750 m, which has the maximum apparent attenuation, presents also the maximum scattering. Furthermore, the Umm-Er-Radhuma Formation, located between depths 1200 and 1650 m, which has the minimum apparent attenuation, presents also the minimum scattering.
The intrinsic attenuation profile is finally estimated by subtracting the scattering attenuation profile determined from the VSP data, from the apparent attenuation profile determined from the spectral method. We chose the latter because it showed more robust results in several studies, as in the case of the basalt sequence (Schuler et al., 2013). Also, in the amplitude decay method, the geometrical spreading correction is an approximation that can cause an error in the quality factor's estimation. Furthermore, the 1/Qintrinsic profile (Fig. 7e) shows that the highest attenuation occurs in zone with the largest scattering attenuation.
4 Discussion
The results showed that the scattering attenuation estimated from the sonic log (5–18 kHz) is higher than that estimated from the VSP data (6–120 Hz). Indeed, in highly heterogeneous media, the heterogeneity scale is comparable to the high-frequency wavelength, so the wave is more scattered compared to the low frequency case.
Because our apparent attenuation profile was estimated from the VSP data (6–120 Hz), we assume that it is more consistent to compare it with the scattering profile deduced from the VSP data. However, the number of layers used to estimate this profile is ten times smaller than that used to estimate the scattering attenuation from the sonic log. So the effect of the layering could be severely underestimated, therefore the scattering also.
Wu and Aki (1988) categorized the scattering into several domains of the wavenumber k multiplied by the heterogeneity size a. They show that when 0.1 < k × a < 10, the size of the heterogeneities can be considered comparable to the wavelength and that in this case the effect of the scattering is not underestimated: this regime is called “Mie scattering regime”. The heterogeneity size a corresponds to the layering scale, which in our case is equal to the depth interval, 15 m. Multiplying a by the wavenumber computed from the velocity (3500 m/s) and the dominant frequency of 62.5 Hz, we find k × a = 1.71. This value is within the above domain, so we can assume that the scattering attenuation estimated from the VSP data is not underestimated.
The results of this study show a significant amount of scattering attenuation compared to published studies carried out in media composed mainly of clastic rocks. Pevzner et al. (2013) selected 70 wells from several areas in Australia and estimated the scattering attenuation profiles from the sonic logs (order of kHz), assuming an heterogeneity size between 1 and 2 m. They found that the scattering attenuation rarely exceeds 0.003. However, in this study it reaches 0.02. This significant scattering attenuation can be explained by the strong heterogeneity of carbonate rocks of the study area.
The layers located between depths 1700 m and 1850 m show the highest scattering attenuation as well as the largest intrinsic attenuation. These layers belong to the Simsima Formation, which is one of the largest aquifers in the region. In addition, the Simsima Formation is strongly heterogeneous, porous and highly permeable (Brook et al., 2006; Suleiman et al., 2010). Furthermore, the Rus Formation, located between depths 1000 m and 1200 m, shows a large amount of scattering and intrinsic attenuation. Similar to Simsima Formation, Rus Formation is considered as an aquifer and it is characterized by high porosity, heterogeneity and permeability (Rizk and Alsharhan, 2003; Whittle and Alsharhan, 1994). This implies that the mechanism of the intrinsic attenuation involves interactions between pore fluids and solids.
The Umm-Er-Radhuma Formation, located between 1200 m and 1650 m, is a prolific carbonate aquifer in Saudi Arabia and Oman, but it does not have the same potential in the UAE, especially in Abu Dhabi Emirate (Brook et al., 2006), which explains why scattering and intrinsic attenuation are relatively small in this formation. The uppermost unit of the section, which almost belongs to the Dammam Formation and is located between 680 m and 1000 m, has a smaller amount of scattering and intrinsic attenuation. This formation may contain clastic rocks and is less heterogeneous than the other layers (Alsharhan and Nairn, 1995; Sharland et al., 2004), which may explain the relative small amount of scattering and intrinsic attenuation in the formation. We cannot give any interpretation for the layer situated on the top of the unit, between 573 m and 680 m, because it represents only a small part of the Miocene Clastic Formation.
Fig. 8 shows a seismic section across the oilfield illustrating the subsurface structure of the study zone. The seismic section shows a fault within the Fiqa Formation. However, there is no indication of faults and fractures in the study zones. The absence of fractures in the study zones makes us more confident about the obtained results. Otherwise, it is necessary to take into account fracture effects in the scattering attenuation estimation. Furthermore, even though the results of attenuation are derived only from the down-going waves of zero-offset data, we can consider them as representative of the whole medium, since the lateral variation of lithology can be assumed small, as shown on the seismic section (Fig. 8).
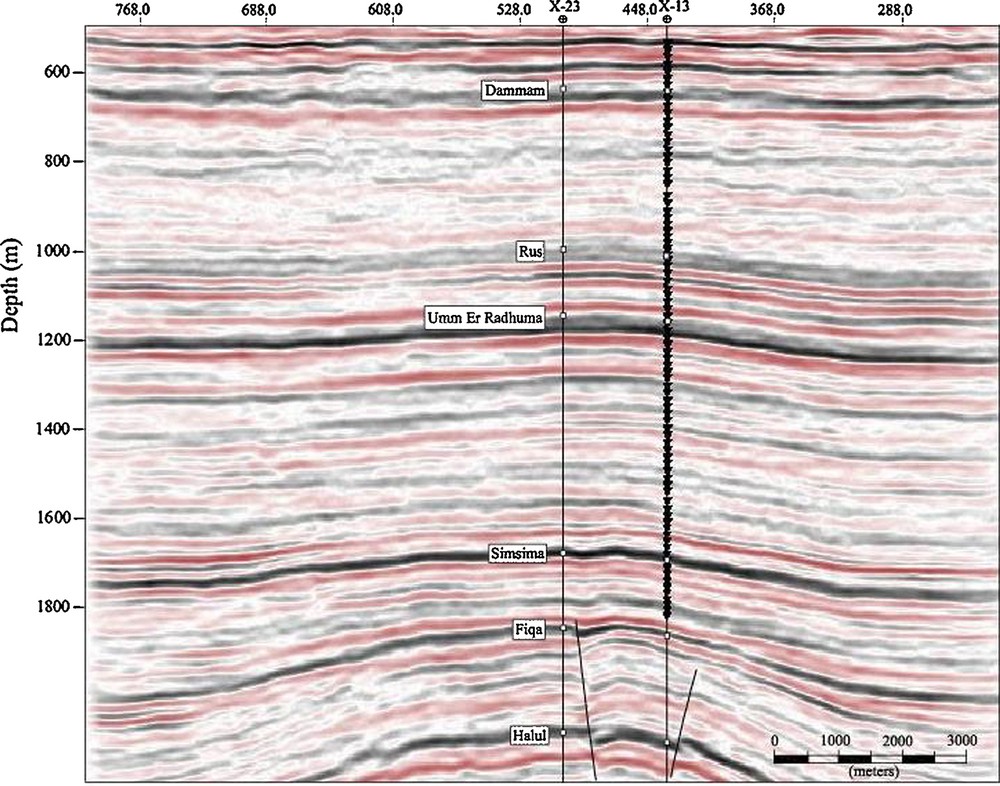
(Colour online.) A seismic section across the oilfield showing the lateral continuation of the formations and the existence of faults below the study zones. Black triangles show the location of the receivers in well X-13.
5 Conclusions
This paper provides the first attenuation profiles in the Abu Dhabi carbonate rocks. The following conclusions are drawn from this study:
- • the quality and the depth interval of the data are very important for the accuracy of the scattering and the attenuation estimation;
- • the factor 1/Qscattering reaches 0.02, which is very significant compared to published studies carried out in clastic media. This can be explained by the strong heterogeneity that characterizes the carbonate rocks;
- • scattering and apparent attenuation should be computed in the same frequency range. The sensitivity of scattering to the frequency domain may not be an important factor in media other than carbonate rocks. This is because, in these types of media, scattering is less significant due to their lesser degree of heterogeneity;
- • scattering was estimated in order to retrieve intrinsic attenuation from apparent attenuation. Intrinsic attenuation is the more interesting profile, because it is more related to the physical properties of the medium. We interpreted the mechanism behind the intrinsic attenuation as the interaction between pore fluids and solids;
- • there is no evidence to indicate that fractures and faults exist in zones of the study area. However, this study can be extended to the hydrocarbon reservoir zones. The carbonate reservoirs in Abu Dhabi are highly fractured. Therefore, in this case an effort at modelling and getting some information about the geometry of the faults and density are necessary.
Acknowledgements
We are grateful to the Oil-Subcommittee of the Abu Dhabi National Oil Company (ADNOC) and its operating companies (OpCos) for sponsoring this project (grant number 10805) and providing data used in this study. We thank Jun Matsushima and Catherine Alexandrakis for their helpful comments on an early version of the paper.