

1 Introduction
The major progress accomplished in recent years in the fields of geodesy and seismology has made it possible to clarify seismic hazard in numerous regions around the world. In order to document the Quaternary seismicity of a given area, palaeoseismological studies are necessary to characterize the earthquake cycle, and to provide complementary data to the instrumental approach for risk assessment. However, these studies are especially critical when the current seismicity does not reflect the long-term activity of a given area, as it is the case of the Levant fault. This fault zone has quite an extensive seismic catalogue since the beginning of our era, which strongly contrasts with the much weaker seismicity during the last century (Ambraseys, 2009; Ambraseys and Jackson, 1998). The archaeological wealth of this region is a major asset to document its recent seismicity, concurrently with traditional palaeoseismological studies. Several recent works have studied damaged historical sites in order to find traces of earthquakes in the buildings and to quantify the associated deformation (Altunel et al., 2009; Galli and Galadini, 2001; Meghraoui et al., 2003; Passchier et al., 2011; Volant et al., 2009). The aqueducts are especially interesting buildings for archaeoseismic studies as they commonly present a simple, linear path, and were quickly and systematically repaired after being damaged because of their critical role in providing the cities with water. Ancient sources, such as Strabo (XII.8.18, cf. Jones, 1928, p. 515), also show that the Romans had a real awareness of seismic hazard and took that in consideration when planning their constructions.
In this perspective, the Roman city of Antioch-on-the-Orontes (Antakya, Southern Turkey) (Fig. 1) offers the benefit of having a well-documented historical seismicity and information about the restoring phases of the aqueduct of the city after its deterioration by the earthquakes. Such restoring works, financed by the Roman emperors, are mentioned by the Byzantine chronicler Malalas (243, 275–276, 418–422, cf. Dindorf, 1831) for three earthquakes in 37, 115 and 526 CE. Some parts of this aqueduct are still well preserved nowadays. The objective of the present study is to characterise the restoring phases and to evaluate if they could help us to clarify the earthquake calendar. This study aims at investigating the possible evolution of Roman materials and building techniques, as well as its impact on the building resistance to earthquakes. This latter issue is addressed by the analysis of bricks, as they are anthropic materials. Looking at different parameters, it is possible to get an insight into the different manufacturing steps. We present here the first steps of this work, which consist of characterizing and dating the aqueduct's building materials.
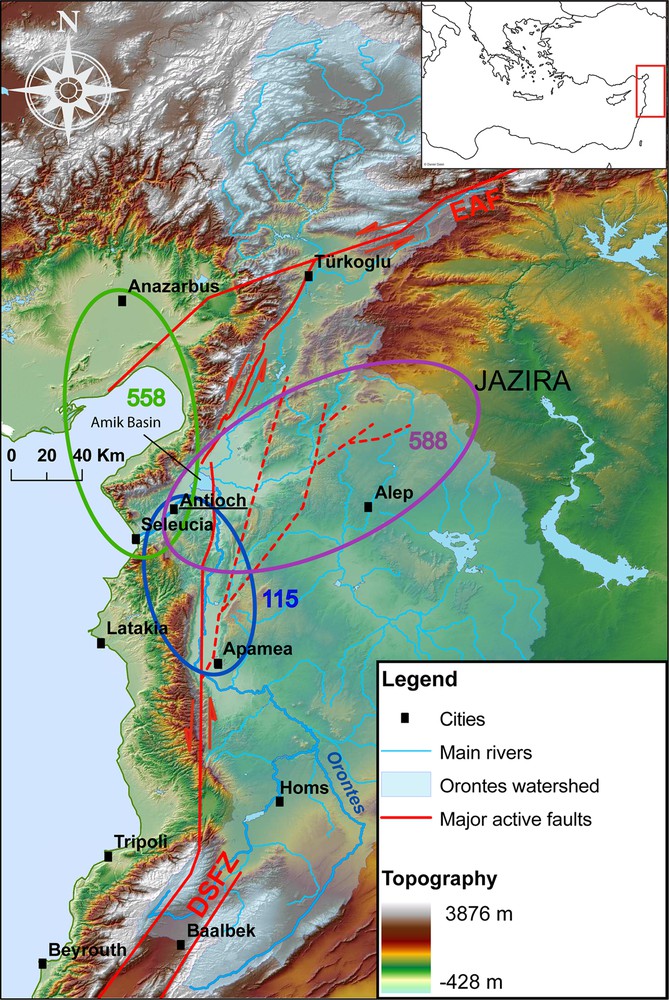
(Colour online.) Location map of this study. The three coloured circles represent the damaged areas of three historical earthquakes, estimated from the sources available. The dates are given CE. The faults were drawn according to Akyuz et al. (2006).
2 Geological and archaeological context
2.1 Local geology
The city of Antioch is located in the Karasu valley, a depression set between two ranges of mountains, the Amanos on the western side and the Anatolian range on the eastern side. This rift is bordered by two NE–SW fault systems, which are part of the transition between the Levant fault and the East Anatolian fault. At this point, the penultimate big segment of the Levant fault crosses the Amik basin, at the Northwest of the city, and joins the last segment with a NE–SW orientation, known as the Karasu fault (fig. 1) (Karabacak and Altunel, 2013; Rojay et al., 2001). The surrounding rocks are set on a pre-Pliocene basement and can be subdivided into two groups: Palaeozoic igneous units topped by an allochthonous Mesozoic ophiolitic complex, and a Lower Miocene–Upper Eocene sedimentary sequence made of folded sandstones and limestones (Fig. 2) (Boulton, 2009; Rojay et al., 2001). The ophiolite includes serpentinised peridotites, gabbros, diorite dykes, various basaltic lavas, boninites and plagiogranites (Robertson, 2002). These rocks are covered with Plio-Quaternary sediments and Quaternary volcanic rocks (quartz tholeiite, olivine tholeiites, alkali basalts) (Alici et al., 2001; Bagci et al., 2008; Parlak et al., 2009).
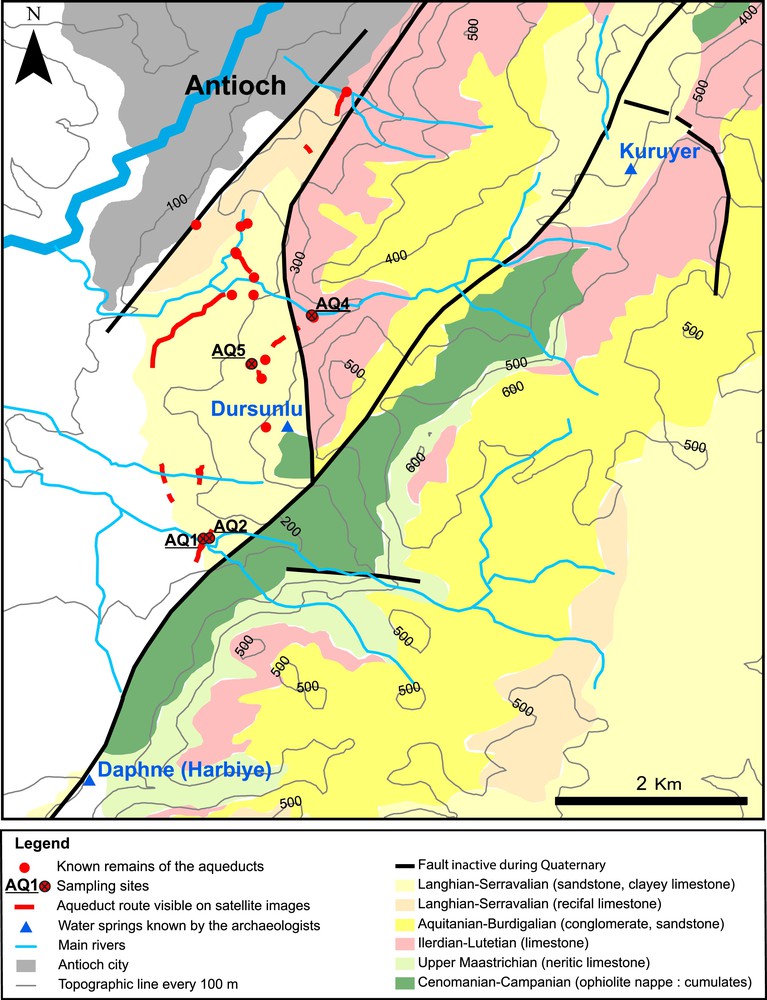
(Colour online.) Map of the aqueducts and their geological context. The white areas are covered by Quaternary sedimentary deposits. The local lithology was taken from Aksay et al. (2002).
2.2 Archaeological background
2.2.1 The ancient city and its aqueducts
Founded in 300 BC by the Seleucids, the city of Antioch was famous in ancient times for its sophisticated and efficient system of water supply (Fig. 2) (Kondoleon, 2000). Drinking water mainly came from karsts overhanging the plateau of Daphne, 6 km south of the city. The aqueduct system visible today was described by the Byzantine chronicler Malalas (243, cf. Dindorf, 1831). Following an earthquake in 37 AD, Caligula built baths and an aqueduct supplying them with water from Daphne springs. Malalas (275–276, cf. Dindorf, 1831) also writes that after the earthquake in 115 AD, Trajan and Hadrian also built baths with their associated aqueduct. The subsequent fate of the aqueducts is unknown, although one of the two aqueducts may have been used at the end of the 12th century according to Johannes Phocas’ testimony (Wilber, 1938). Both aqueducts (fig. 2) were identified during archaeological surveys in the 1930s. One aqueduct (AQ1), supplying the North and the centre of the city, was dated to Caligula's reign, while the other (AQ2), located at a higher elevation and better designed, seems to date back to Trajan and supplied the southern part of the city (Wilber, 1938). It should be noted that those surveys were not extensive and have not been updated since then. During a field mission in July 2012, we identified two other portions of aqueduct (AQ4 and AQ5), which seem to belong to a third system, higher than the two lines described above.
2.2.2 Construction materials sampled
Thanks to an extensive and almost continuous documentation since the Roman period, we know that Antioch and its surroundings have been repeatedly struck by many earthquakes (Fig. 1). According to ancient sources, the city was struck by no more than nine significant earthquakes between 0 and 500 CE (Ambraseys, 2009; Guidoboni et al., 1994). These successive earthquakes, together with the effects of time, led to several repairs that are still visible on the aqueducts.
The different building materials analysed in this study were sampled in July 2012. Twelve bricks were sampled on four different portions of aqueduct identified in the city. AQ1 and AQ2 belong to the two systems described above, while AQ4 and AQ5 are part of a third higher system. Nine bricks come from the first building stages, while three were sampled on repaired structures, which enabled us to compare the materials used in different building stages, and to check if the restoring bricks present peculiar features. The name, location, size and building context of each brick are summarised in Table 1.
Names, location and context of the studied samples. AQ2 remains consist in three successive piles, with a north–south orientation. Pile 1, in the middle, supports the southern part of an arch and a portion of channel above. Pile 2 stands just south. The arch between piles 1 and 2 is now destroyed. For the locations of AQ4 samples, see also Fig. 3.
| Sample | Coordinates | Context | Dimensions of sample (length × thickness) in cm |
| AQ1-1 | 36°09.115 N–36°09.241 E | Origin, channel wall, just above the ground | 18 × 4 |
| AQ2-1 | 36°09.121 N–36°09.267 E | Origin, outside wall of channel above the arch | 30 × 3 |
| AQ2-2 | 36°09.121 N–36°09.267 E | See AQ2-1 | 30 × 3 |
| AQ2-4 | 36°09.121 N–36°09.267 E | See AQ2-1 | 30 × 3 |
| AQ2-5 | 36°09.121 N–36°09.267 E | Origin, arch | 40 × 5.5 |
| AQ2-8 | 36°09.117 N–36°09.260 E | Origin, pile 1, 161 m above the ground | 80 × 5 |
| AQ2-9b | 36°09.117 N–36°09.260 E | Origin, pile 1, just above AQ2-8 | 20 × 5.5 |
| AQ2-9c | 36°09.117 N–36°09.260 E | See AQ2-9b | 40 × 4 |
| AQ2-10 | 36°09.114 N–36°09.258 E | Origin, pile 2, 26 m above the ground | 35 × 4.5 |
| AQ4-1 | 36°10.355 N–36°09.849 E | Repair structure on a crack, west side, just south of a big travertine deposit, 80 cm below the channel's top | 20 × 3.5 |
| AQ4-4 | 36°10.378 N–36°09.843 E | Repair structure on a crack, west side, northern end of the aqueduct, 2.6 m above the the ground | 25 × 5.5 |
| AQ5-1 | 36°10.118 N–36°09.584 E | Repair structure on a crack, 3 m above the ground | ? |
| AQ5-2 | 36°10.092 N–36°09.500 E | Origin, 3 m above the ground | ? × 5 |
3 Methods
3.1 Construction survey
A LIDAR scan was carried out on AQ4 in order to have a detailed topographic map of this portion of aqueduct, preliminary to a more comprehensive field study (fig. 3). The LIDAR technique is based on the measure of the travel time of a laser beam between the source device and a given target. Scanning the target with multiple beams allows one to produce a 3D scatter plot with a millimetre resolution. An extensive LIDAR survey was done with the Optech ILRIS 3D system. The scatter plot was then generated with the PolyWorks 10.0™ software, and processed with the Trimble RealWorks 7.1.1™ software at the University of Liège (Belgium). Thanks to this processing, several measurements were done on the building: horizontal track on the aqueduct, thickness and height of the different architectural layers, deformations. Finally, the photographs taken on the field were projected on the scatter plot and ortho-rectified to realise a sketch of the aqueduct, on which the main structures were drawn.
3.2 Petrologic characterisation of the building materials
3.2.1 Macroscopic features, texture, and mineralogy
The different bricks were first compared on the basis of macroscopic features (Fig. 4), such as the size, colour, and texture. Then, in order to study more precisely their manufacturing process, thin sections were made at the Laboratory of Geology of the École Normale Supérieure (Paris) and characterized under an optical microscope Leica DMRXP, equipped with a camera Leica DFC420. The nature of different components observed was also studied with an FEG Zeiss Sigma scanning electronic microscope (Table 2).
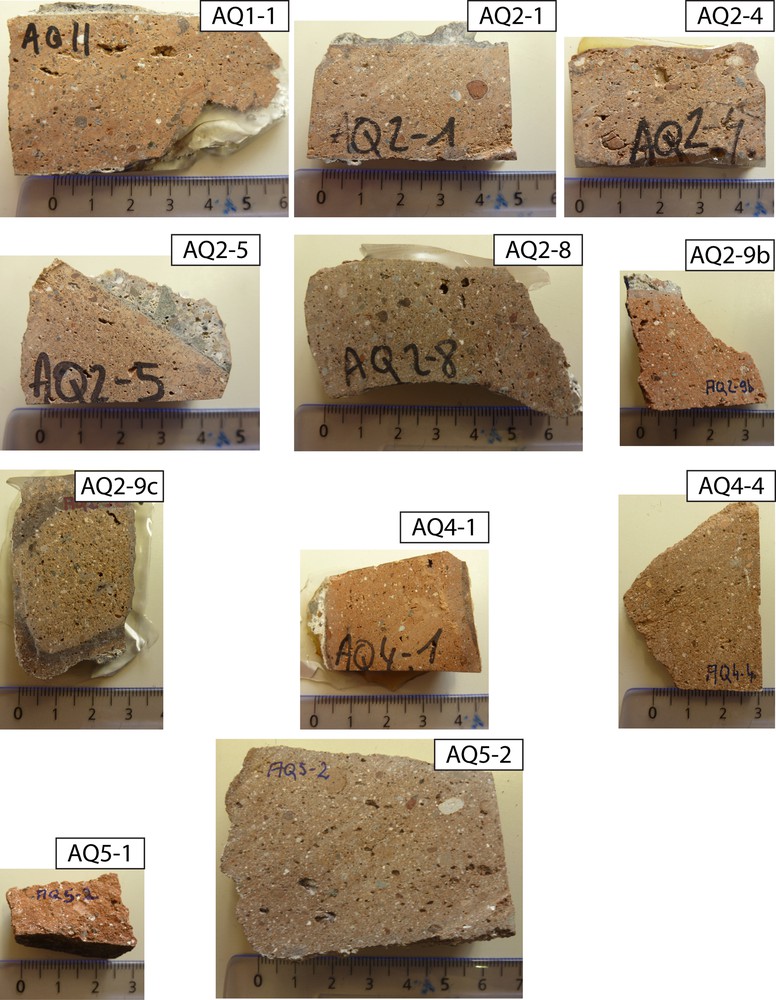
(Colour online.) Macroscopic photographs of eleven fragments of the brick samples. The fragments were cut and polished during the preparation of the thin sections.
Nature of the temper grains in the bricks. Cpx = clinopyroxene, opx = orthopyroxene, amphi = amphibole, plagio = plagioclase, K–Fd = K-feldspar, ol basalt = olivine basalt, br lava = brown lava, carb peb = carbonate pebble. “o” means an occurrence of the element.
| AQ1-1 | AQ2-1 | AQ2-2 | AQ2-4 | AQ2-5 | AQ2-8 | AQ2-9b | AQ2-9c | AQ2-10 | AQ4-1 | AQ4-4 | AQ5-1 | AQ5-2 | |
| Cpx | o | o | o | o | o | o | o | o | o | o | o | o | |
| Opx | o | o | o | o | o | o | o | o | o | ||||
| Amphi | o | o | o | o | o | o | o | o | o | o | o | ||
| Olivine | o | o | o | o | o | o | o | o | o | o | o | ||
| Plagio | o | o | o | o | o | o | o | o | o | o | |||
| Quartz | o | o | o | o | o | o | o | o | o | o | |||
| K–Fd | o | o | o | o | o | ||||||||
| Calcite | o | o | o | o | o | o | o | o | o | o | |||
| Chromite | o | o | o | o | |||||||||
| Ol basalt | o | o | o | o | o | o | o | o | o | o | o | o | o |
| Gabbro | o | o | o | o | o | o | o | o | o | o | o | ||
| Br lava | o | o | o | o | o | ||||||||
| Diorite | o | o | o | o | o | ||||||||
| Andesite | o | o | o | o | o | o | |||||||
| Granite | o | o | o | o | o | o |
3.2.2 2D-porosity and granulometry
SEM picture mosaics were realised on most of the bricks, with a magnification of 500 and a resolution of 1024 × 768 pixels. On the SEM images, the pores are the only areas coloured in black, which makes it easy to compute then 2D-porosity using the JMicroVision software, (Roduit, 2007). To check the reliability of this method, 3D-porosity measurements were also carried out concurrently on two bricks (AQ4-4 and AQ5-2), using the triple-weight method (NF EN 1936, 2007 norm).
For the granulometry study, the brick thin sections AQ1-1, AQ2-4, AQ2-5, AQ2-8, AQ2-9b, AQ4-1, AQ5-1, and AQ5-2 were fully photographed in polarised light with a magnification of 1.6 and a resolution of 2592 × 1944 pixels. The pictures were then processed using the JMicroVision software. The area and equivalent circular diameter of the grains are then estimated. The percentage of area covered by the grains is then plotted in diagrams (Figs. 5 and 6).
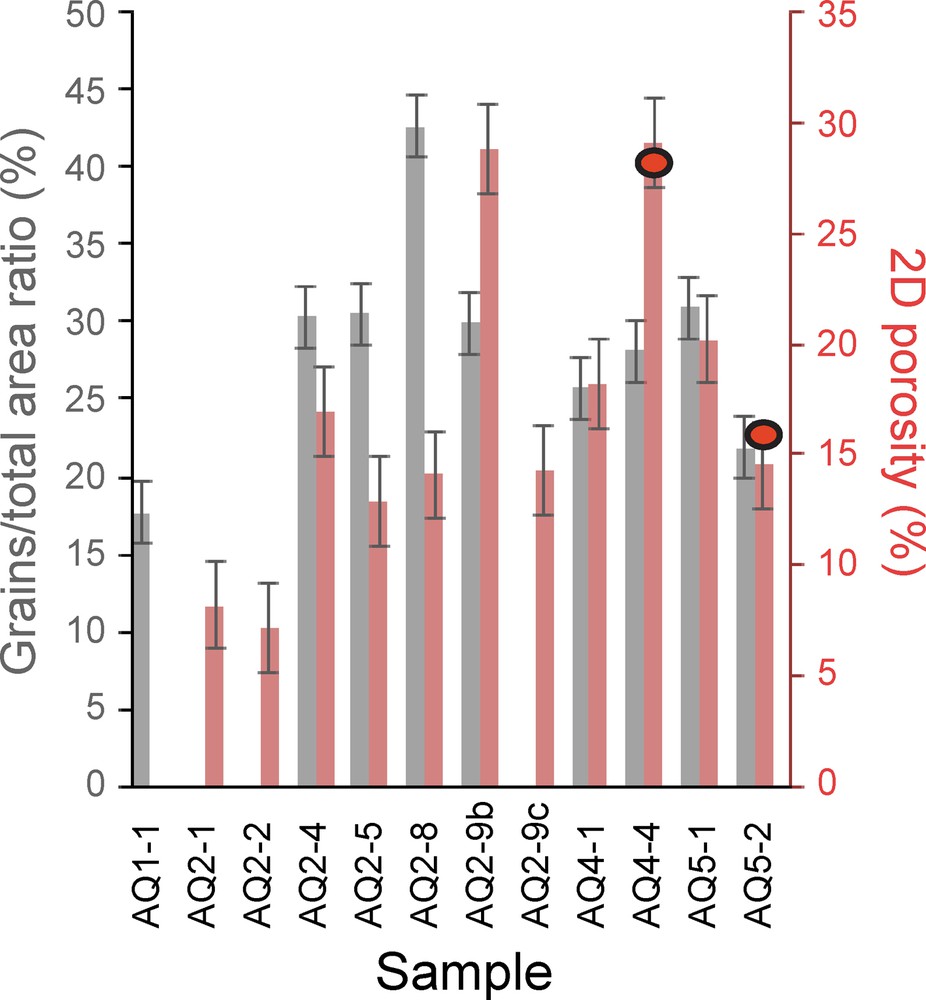
(Colour online.) Amount of grains and porosity of the bricks. The grains/total area ratios (grey bars) were estimated with thin section microphotographs, and the 2D porosities (red bars) with SEM images. The two orange ellipses indicate 3D-porosity values. The values for AQ2-9b and AQ4-4 must be considered with caution because of the small amount of material on the thin section. The uncertainty is ± 2%.
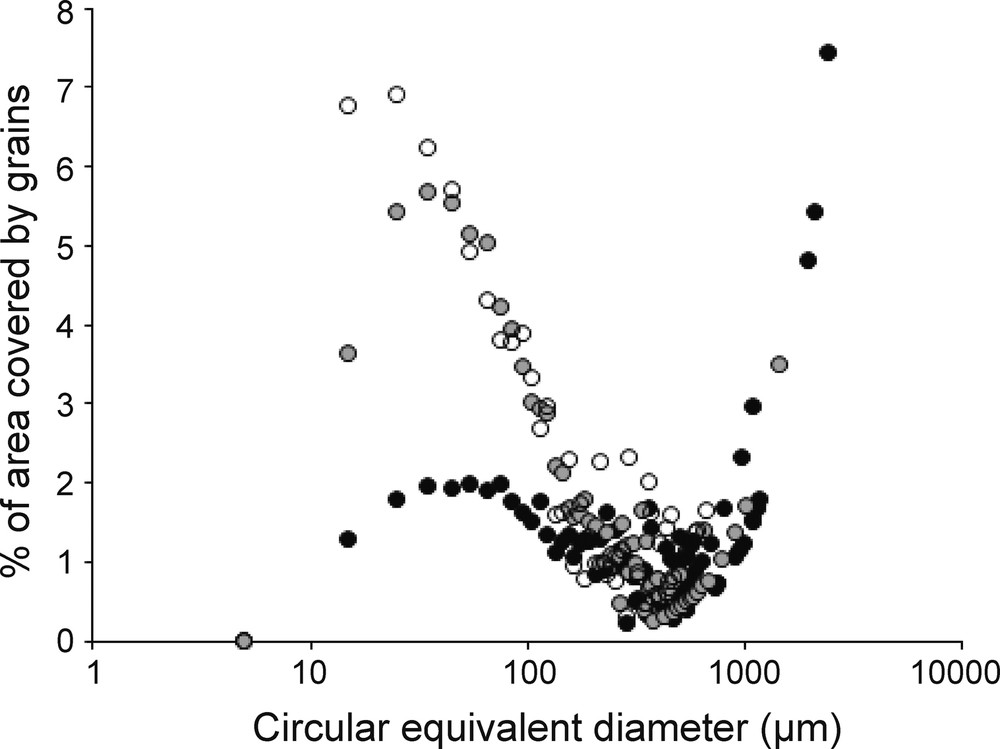
Grain distribution of three representative bricks. The three bricks are representative of the three types identified in this study: type A (AQ2-4, black), type B (AQ4-1, grey), and type C (AQ2-9b, white). The scale used for the diameter is logarithmic.
3.3 Dating
3.3.1 Archaeomagnetism
In order to constrain the age of production of the different bricks, magnetic palaeo intensities measurements were carried out on eight samples (AQ1-1, AQ2-1, AQ2-5, AQ2-9b, AQ2-10, AQ4-1, AQ5-1, and AQ5-2) at the Saint-Maur-des-Fossés observatory, in collaboration with Yves Gallet and Maxime Le Goff (IPGP, Paris). These measurements were done with two triaxe magnetometers, whose operating principle is described in Le Goff and Gallet (2004) (Table 3). Low-field thermomagnetic curves acquired with a KLY Agico equipped with a CS2 oven up to 580 °C on AQ1-1, AQ2-5, AQ2-9b, AQ2-10, AQ4-1, AQ4-4, AQ5-1, and AQ5-2 allowed us to gain insights into the magnetic mineralogy and stability of the magnetic phases during thermal treatments. In addition, the composition, size and texture of ferri/ferromagnetic phases were described using the BSE mode during SEM observations on AQ1-1, AQ2-5, AQ2-9b, and AQ2-10 thin sections.
Magnetic palaeointensities recorded in the bricks. The means were computed on three fragments for each brick, except AQ2-5 that showed greater variability and for which six fragments were used.
| Sample | Mean intensity (μT) | Standard deviation |
| AQ1-1 | 59.9 | 2.3 |
| AQ2-9b | 58.5 | 0.8 |
| AQ2-10 | 57.2 | 1.0 |
| AQ4-4 | 58.1 | 0.8 |
| AQ5-2 | 54.8 | 2.8 |
3.3.2 Carbon 14
Charcoal fragments were extracted from the mortar of samples AQ1-1, AQ2-9, AQ2-10, and AQ4-4, and dated by Aeon Laboratories (aeonlaboratories.com) with the 14C method, to constrain the building age of the different architectural units. The radiocarbon ages were converted into calendar ages with the INTCAL09 calibration (Heaton et al., 2009) using Oxcal program (Ramsey, 2009).
4 Results
4.1 Damages reported on AQ4
Fig. 3 shows a synthetic sketch of the survey realised with the LIDAR scan of AQ4. The aqueduct roughly follows a north–south line, with two direction changes that make it concave toward the west. The first change in the northern part has been made by the hand of man to join the other side of the aqueduct across the river. By contrast, the change in the southern part (red arrow in Fig. 3) is associated with a crack, hidden by a huge accumulation of travertine that precipitated because of a leakage; this is interpreted as the result of a deformation suffered by the aqueduct after its construction. The whole southern part of the aqueduct suffered an anticlockwise rotation of about 15°, and the layer indicated by a red line on Fig. 3 has suffered a collapse of 10 to 15 cm, south of the travertine deposit. After this damage, water was no longer able to flow northward as it did before. Another fracture can be seen at the northern end of the aqueduct.
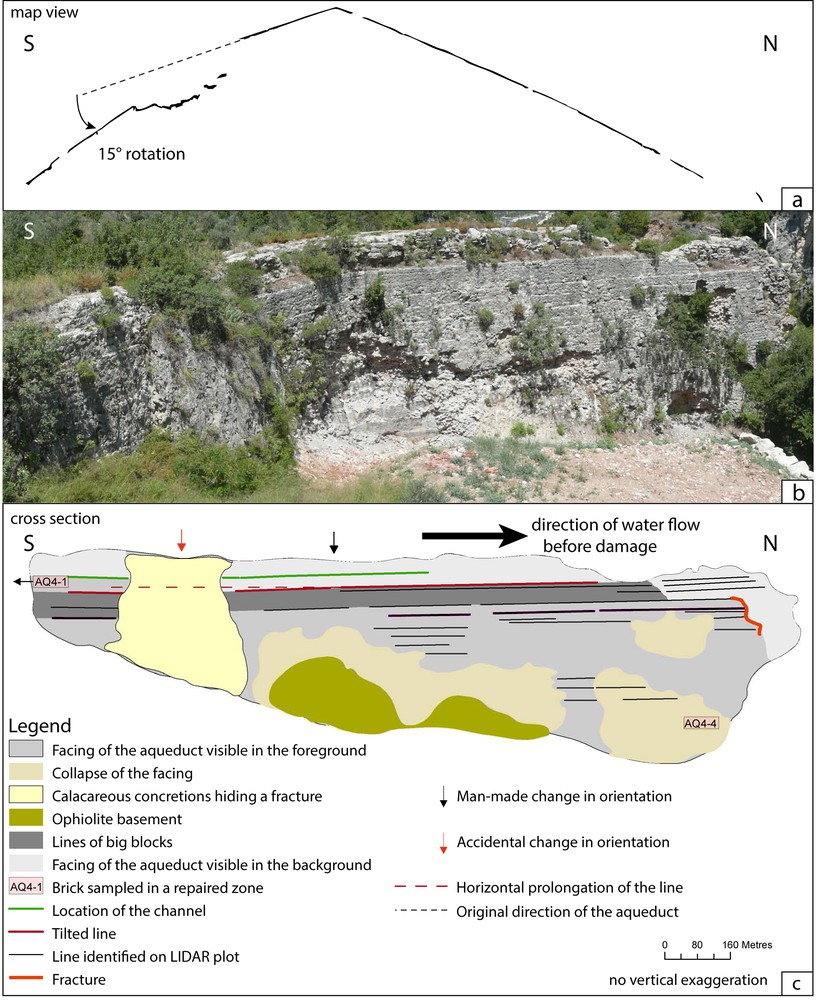
(Colour online.) Interpretative sketches of the LIDAR scan for the site AQ4. a: horizontal profile of the aqueduct; b: photograph of the eastern side of the aqueduct; c: schematic sketch of the eastern side of the aqueduct projected on a vertical plane. The features were digitalised from the ortho-rectified photographs of the aqueduct with ArcGIS™. The image corresponds to a north–south projection. The red and black broken lines show the original position of the southern part of the aqueduct before damage.
4.2 Petrology of the bricks
4.2.1 Microscopic texture and mineralogy
All the bricks show their own characteristics in terms of texture, which may reflect different qualities of fabric (Fig. 4). AQ2-1, AQ2-2, and AQ4-1, have a rather homogeneous granulometry of the temper and show a good quality of clay-temper mixing. On the contrary, AQ2-4, AQ2-8 and AQ2-10 contain various sizes of grains and the mixing was done less careful, as showed by the presence of several clay lumps without temper. The other bricks present intermediate qualities of fabric. Fig. 5 presents the grain area percentages estimated by image processing. Most of the bricks have a value close to 30%, but some bricks, like AQ1-1, AQ4-1 and AQ5-2, exhibit lower values, while AQ2-8 shows remarkably high grain content, larger than 40%.
The mineralogy of the temper is reported in Table 2. It is composed of various fossils, such as nummulites (from Eocene limestones), and isolated minerals and fragments of rocks, which can be identified. Most of them come from basalts and gabbros. All the bricks exhibit quite similar mineralogical contents. The temper includes rounded and angular fragments, the latter often having very acute and reflex angles.
4.2.2 Porosity measurements
The 2D-porosity results are shown in Fig. 5. The 3D-porosity measurements carried out on AQ4-4 and AQ5-2 provided values of 28% and 16%, respectively that confirm the 2D-porosity analysis done on the photograph. The 2D analysis seems therefore to give reliable porosity estimates. The 2D-porosity values are quite similar among the bricks. Still, AQ2-4, AQ4-1 and AQ5-1 exhibit higher values, closer to 20%, while AQ2-1 and AQ2-2 show lower ones, below 10%.
4.2.3 Granulometry
Typical granulometry diagrams are shown in Fig. 6. The curves can be divided into two parts. The first one includes the smaller grains that clearly follow a Gaussian pattern, while the biggest grains lie above the Gaussian curve. It is noticeable that the grain diameter for which the grain area percentage is the highest is the same for almost all the bricks, around 40 μm, except AQ2-9b, which contains more grains of a lower diameter, close to 20 μm. The coarser grains in most of the bricks follow a regular pattern that looks like a parabola (e.g., AQ2-4). Several points do not fit on this parabola, between 200 and 700 μm, and can represent a significant area, as in AQ2-9b (fig. 6). The average diameter of these outliers is also different between the bricks. The maximum grain diameter for all the bricks does not exceed 3 mm, and it is even lower than 1 mm for AQ2-9b and AQ4-4.
4.3 Dating
4.3.1 Archaeomagnetism
Over the 24 samples measured, 6 did not provide results that fit the quality criteria, such as described in Gallet and Le Goff (2006). AQ2-5 and AQ4-1 showed anomalous results that can be explained by an unsuitable mineralogy, with an important amount of large titanomagnetites. All suitable results are displayed in Table 3. All the samples provided similar intensities, with a mean of 57.6 ± 1.7 μT. The obtained intensity values are too close, considering the associated uncertainties, to really distinguish subgroups among the bricks.
Thanks to the reference curve established for ceramics from the Nishapur site in Iran, at the same latitude as Antioch (Genevey and Gallet, 2013), but 1700 km more to the east (Fig. 7), the measured intensities can be converted into ages. As the reference curve is not established in Antioch, some errors may be generated, in particular a systematic time lag due to a westward drift of the geomagnetic secular variation has been recently under discussion (Aubert et al., 2013; Livermore et al., 2013). The time interval that we obtain with this correlation ranges from the 5th century BCE to the 1st century CE, which covers the construction age of AQ1 estimated by the archaeologists (see Section 2.2.1). Another less probable possibility would be later than the 4th century CE. As the bricks were likely produced during the Roman period, after the 1st century BCE, the production age is mostly constrained by the lower limit of the intensity interval, toward the mid-1st century CE.
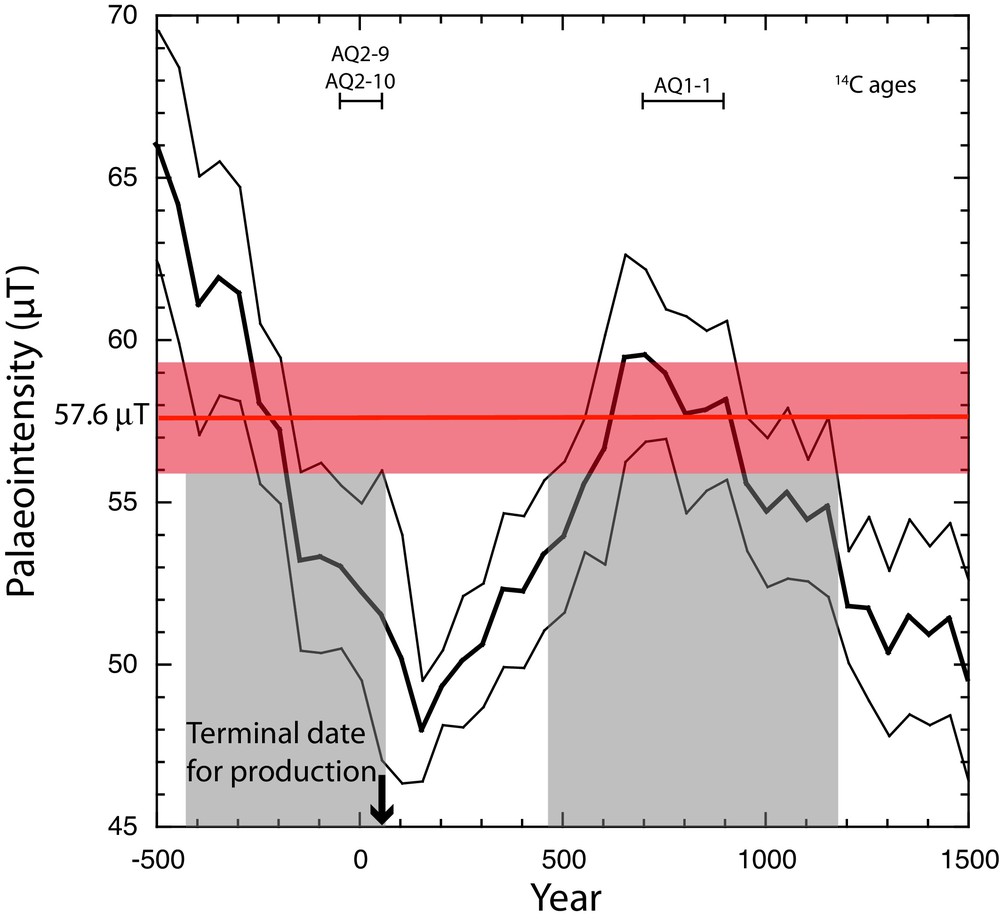
(Colour online.) Reference curve of the variations of the magnetic field for the site of Nishapur The palaeointensity data and their dating were taken from (Genevey and Gallet, 2013). The mean of the data obtained from the bricks is indicated by the horizontal red line and the standard deviation by the horizontal red band. The time intervals corresponding to those intensity results are shown with two vertical grey bands. The reliable construction age intervals obtained from 14C dating on charcoals from the mortar are indicated by the horizontal black bars.
4.3.2 14C ages
Three charcoals extracted from the mortars of AQ2-9 and AQ2-10 provided similar ages of 0 ± 50 year CE (2σ uncertainty) that would match a construction during Caligula's reign. A second charcoal from AQ2-9 mortar gives a much older age, between 500 and 400 BCE, which could be due to the use of old wood in the construction. The charcoal from AQ1-1 mortar provided an age of 800 ± 100 year. The last charcoal, from AQ4-4 mortar, gives a quasi-modern age, certainly dubious as the sample was too light to be analysed properly.
5 Discussion
5.1 Relevance of the different parameters observed on the bricks
The colour of a brick depends mainly on the clay and the firing process. Clay deposited near the alteration area will show a red to brown colour, while purer sedimentary clay will exhibit white to yellow colours (Velde and Druc, 1999). The firing process can significantly alter this original colour: a high-temperature, oxidising firing will give a red colour, while a reducing firing will make the brick darker. This reducing atmosphere can be obtained by reducing the temperature and putting wet organic matter in the kiln. Differences in the colour intensity may also result from different positions in the furnace (Le Ny, 1985).
The macroscopic or microscopic texture, as well as the porosity, may give information on the care with which the brick maker worked on his paste. For instance, a homogeneous spatial distribution of the pores and grains, with sometimes a preferential orientation of grains, indicates a careful mixture of the clay and the temper. It is also possible to study the selection of the temper by looking at the nature, angularity, and granulometry of the grains. According to Velde and Druc (1999), the Gaussian pattern for the finer grains in the grain size diagrams (fig. 8) corresponds to the “natural temper”, i.e. the grains that were originally present in the clay resource. Therefore, the peak of the Gaussian curve, i.e. the grain size covering the biggest area, can be used to characterise and compare different clay resources. The coarser grains were added by the brick maker to give better mechanic coherence to the clay paste. Those grains can also follow regular patterns like a parabola, which corresponds to an uniform distribution of the different grain sizes, or not and it is then possible to see if a peculiar size range was chosen by the brick maker. The fact that the maximum grain size does not exceed 3 mm can indicate the use of sieving. The anthropic addition of grains is also evidenced by the coexistence of naturally incompatible minerals in the same brick, like quartz and olivine, and the high angularity of many grains that can result of crushing.
5.2 Origin of the building materials
The rock fragments used as temper are very similar to the geological outcrops around Antioch, and several identified rocks can be compared to the different units of the ophiolitic complex: basaltic lavas, gabbros, diorites. Rare plagiogranites may have been used. The fossils found in the bricks match with those found in the local limestones. Limestones were not only used for construction (we observed several blocks of similar limestone in the building), but also as temper and fluxing agent. All these facts support the hypothesis of a local production for the bricks.
5.3 Typology for the bricks
5.3.1 Selection of relevant comparison parameters
The bricks AQ2-1 to AQ2-5, sampled in the arch of AQ2, are all very similar on many aspects. They were produced using the same manufacturing process; they certainly belong to the same production, and were probably made by the same ceramist. The bricks of this coherent group present variability for some studied parameters, which give an idea of the heterogeneity inside one set. It is noticeable that the porosity is quite uneven within this group, and that their mineral content may not be strictly similar. Therefore, the porosity and the occurrence of some peculiar minerals/rocks will not be used to discriminate the different productions. By contrast, the amount of temper, the granulometry, and the colour are very homogeneous within this group, and may certainly be used as relevant parameters.
5.3.2 Comparison and typology
A first group of bricks (AQ2-1 to AQ2-5) is characterised by a high proportion (30%) of temper, a selection of middle-sized grains (around 300 μm), a 3-mm sieving, and a rather oxidising firing (type A). AQ2-10 and probably AQ5-1 can be added to this group A. A second group (type B) can be identified, which could include AQ1-1 and AQ4-1, and is characterised by a very small amount of temper, fine grains (around 200 μm), a 3-mm sieving, and an oxidising firing. Finally, a third group (type C) differs from the type A because it presents no grain above 1 mm, and could include AQ2-9b and AQ4-4. They do not show a similar distribution of fine grains, though the peak of the Gaussian curve occurs at 40 μm for AQ4-4 like for the other bricks, against 20 μm for AQ2-9b. So, these two bricks seem to have followed the same manufacturing process, but they differ by their clay resource and may not be from the same workshop, AQ4-4 having a similar clay type to the other bricks contrary to AQ2-9b. There remain three isolated bricks, AQ2-8, AQ2-9c, and AQ5-2, all different. The three bricks share the particularity of having been fired under a reducing atmosphere, as shown by their brownish colour, but does not present similar grain size distribution: while AQ2-8 has a huge amount (over 40%) of unsorted temper, AQ5-2 contains coarse temper in very small proportion (20%).
5.4 Dating of the building
The archaeomagnetism results suggest that all the bricks were probably manufactured before the 2nd century CE. This age is consistent with the 14C age obtained for AQ2-10s mortar, and with a construction during Caligula's reign, as claimed by Malalas (243). However, this age disagrees with the few archaeological data available, which claim that AQ2 was built by Trajan in the 2nd century CE. For AQ1-1, we obtained a much later age for the construction that could match with the later time interval suggested by archaeomagnetism (from 500 to 1200 CE). While the archaeological data claim that AQ1 was built during Caligula's reign, the 14C data on AQ1-1 mortar suggests that this portion of AQ1 was built or rebuilt in the Middle Ages.
6 Conclusion
We have provided a first work on this building, which has been very poorly studied so far. Our Lidar study proved that the aqueduct was deformed after it was built, which resulted in important leaks along the cracks, a tilt of the whole structure, and a reverse water flow causing massive travertine precipitation. The bricks study has allowed us to characterise different productions and to identify some manufacturing techniques, like the use of sieving. The temper analysis proves a local origin for the bricks. Most of the ages obtained for the bricks dated by archaeomagnetism and the 14C method on mortar are coherent, except for one very young 14C age. Nevertheless, the ages remain poorly accurate. As long as we lack a solid time frame, it seems difficult to link these repairs and the cracks observed on the aqueducts with historical earthquakes. Supplementary data is needed to better constrain the chronology of the brick production, the building of the different aqueducts and their repairs. A detailed archaeological study of the building and thermoluminescence dating on the bricks could refine the chronology of the construction and brick production. Nevertheless, we have developed through this work promising methods to study ancient building deformations and materials, which could be applied to other archaeological sites prone to seismic hazard.
Acknowledgements
This research was mostly founded by the ENS (Paris, France), the Mistral project of INSU, and the University of Liège (Belgium). We thank Hatice Pamir for enabling the sampling in Antioch. ISTerre is part of Labex OSUG@2020 (ANR10 LABX56).